


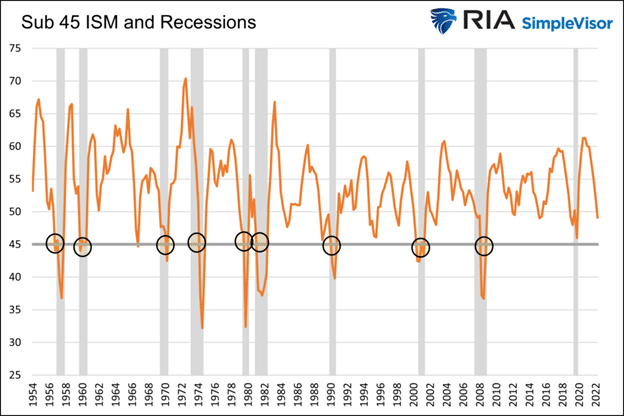
The graph below shows that a sub-45 reading on the ISM manufacturing survey index has accompanied nine of the last ten recessions. The only outlier, and by a very slim margin, was 2020. The never-seen-before economic shutdown and the massive stimulus made that recession non-comparable to more typical economic slowdowns.
The latest ISM survey rose slightly from 47.4 to 47.7, staying above 45. A reading below 50 denotes economic contraction. New orders, a good leading indicator, rose to 47 from recent lows of 43, but it remains in contraction territory. Employment fell slightly, but the prices paid index rose sharply to 51.3 from 44.5. It signals that inflationary pressures remain. The ISM survey data point to the Fed’s conundrum. Economic indicators like ISM are dangerously close to signaling a coming recession, yet price pressures remain high.
What To Watch Today
Economy
- S&P Global U.S. Services PMI, February Final (50.5 prior)
- S&P Global U.S. Services Composite PMI, February Final (50.2 prior)
- ISM Services Index, February (54.5 expected, 55.2 prior)
Earnings
- No notable earnings releases today
Market Trading Update
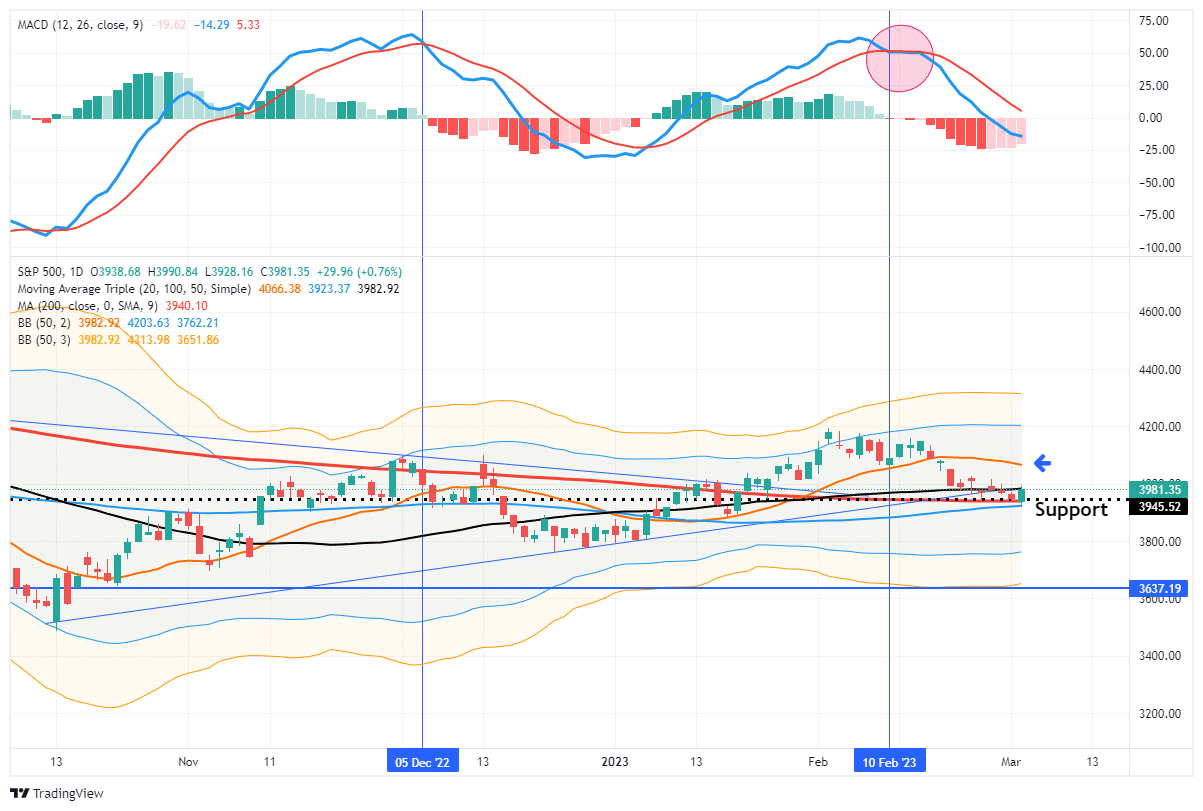
Finally, a rally. As noted, we were looking for a rally this week as the market is very oversold. While there were several attempts to rally, they all failed until yesterday’s test of the 200-DMA, which brought buyers in looking for the “dip.” While the bounce was welcome and a good first retest of support, it was not a strong bullish advance. The conviction of buyers was missing suggesting any follow-through may be limited for now. There are a lot of “trapped longs” in the market currently, which will likely use rallies over the next couple of weeks to sell into. Such will keep any advance limited.
Continue using rallies to the 20-dma to reduce risk, raise cash, and rebalance portfolios accordingly. While the market has not done anything “Technically” wrong since the October lows, the downside risk is present. Continue to protect capital until a more bullish setup is in place.

Productivity and Labor Costs
Fourth quarter productivity was revised sharply lower from 3% to 1.7%. The culprit was an upward revision to unit labor costs from 1.1% to 3.2%. The data indicates corporate margins may be under pressure due to sharply rising wages. The graph below from John Hussman shows the correlation between labor costs and profit margins.
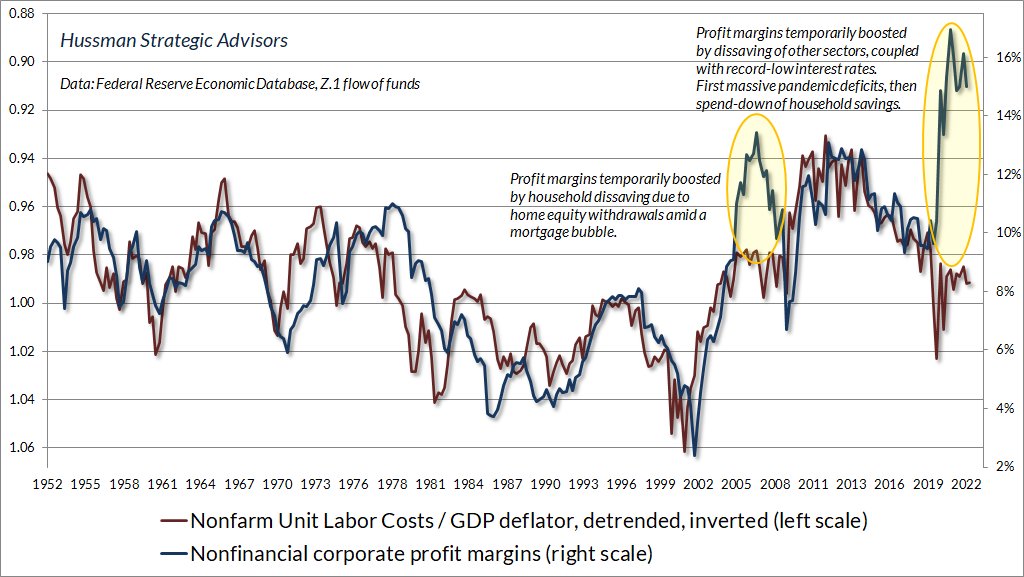
While the information is from the fourth quarter, it is not welcome news for the Fed, which fears a price wage spiral. It also points to a resilient economy where companies may be desperate for employees even at higher costs and reductions in productivity.
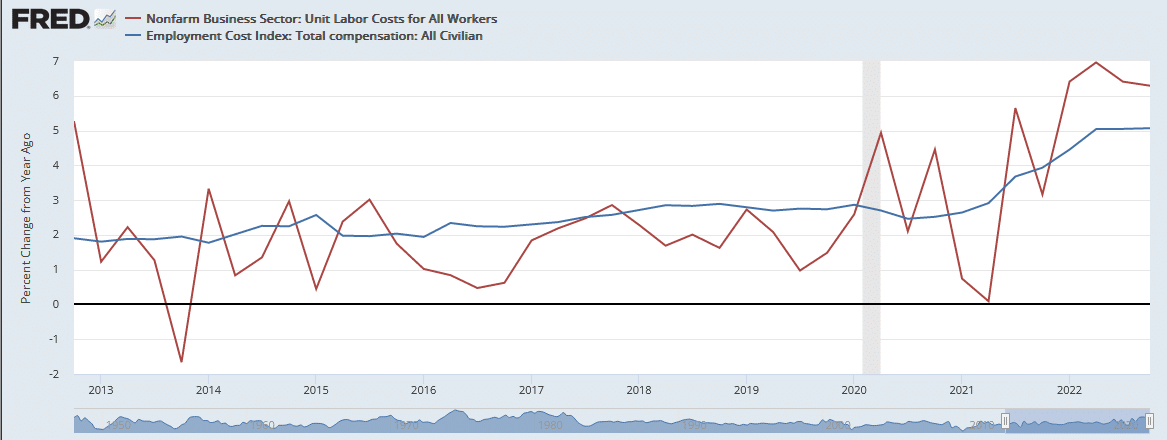
The graph below shows that annualized unit labor costs and the employment cost index are double their pre-pandemic run rate.
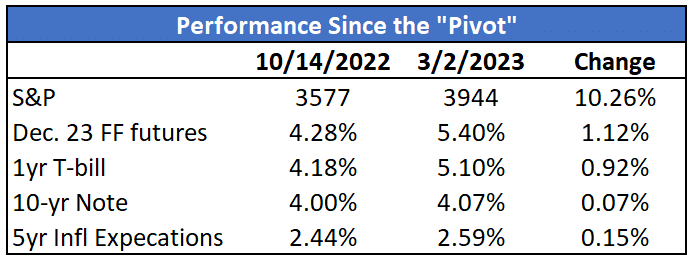
Post Pivot Divergences
Throughout 2022 Stocks and bonds traded in lockstep with the Fed’s plan for rate hikes. In October, stocks rallied, and bond yields fell as it was widely believed the Fed was nearing the end of their rate hikes, and a pivot to lower rates in the second half of 2023 was likely. Recently, substantial employment growth, good economic data, and higher-than-expected inflation data have quashed the pivot narrative.
The table below looks at various markets to see how they are digesting the new line of Fed thinking. For starters, Fed Fund futures are up over 1% and pricing in 5.40% Fed Funds by year-end. Treasury bills followed, up almost 1% since October. Ten-year Treasury notes and five-year inflation expectations are up slightly. Both are for extended periods, so the market is pricing in higher short-term rates and, simultaneously, the negative effect of higher short-term rates on longer-term economic activity and inflation.
Lastly, the S&P 500 has declined recently but is still about 10% above last October’s price, despite sharply higher expectations for Fed Funds. Can bond and stock investors have significantly different views on what the Fed will do? Such is not often the case, but maybe this time will be different.
Upside Down Cars
Higher new and used car prices and longer auto loan terms result in some car owners being underwater. In other words, the value of their car is worth less than their loan amount. If trading the vehicle in, they need to make up that difference which takes away from their ability to buy a new car. The Bloomberg graph below shows that the average amount of negative equity of the vehicles with negative equity being traded in is rising. While below the pandemic peak, it is above the pre-pandemic peak of $5,000 and rising. Below the graph are a few facts on the auto market from Edmunds.
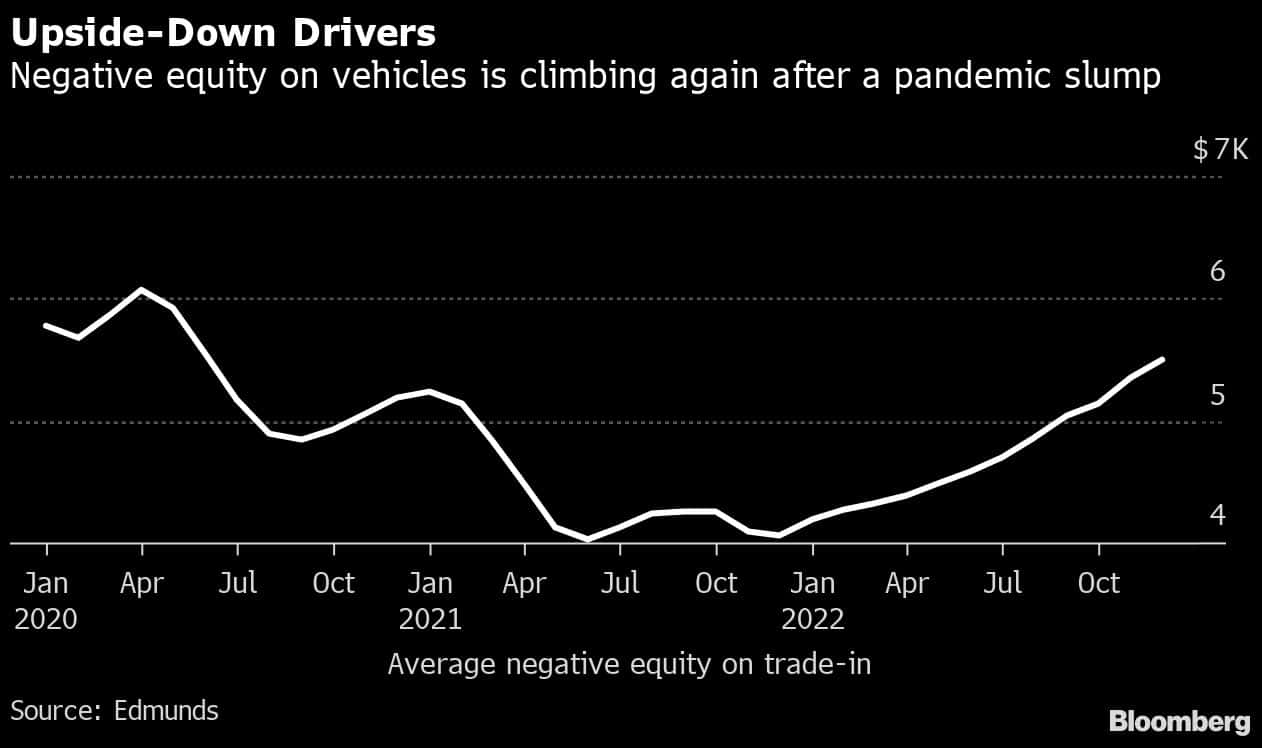
Per Edmunds:
- The average annual percentage rate (APR) on new financed vehicles climbed to 6.5% in Q4 2022 compared to 5.7% in Q3 2022 and 4.1% in Q4 2021. The APR on used financed cars climbed to 10% in Q4 2022 compared to 9% in Q3 2022 and 7.4% in Q4 2021.
- 15.7% of consumers who financed a new vehicle in Q4 2022 committed to a monthly payment of $1,000 or more — the highest it’s ever been — compared to 10.5% in Q4 2021 and 6.7% in Q4 2020.
- 17.4% of new vehicle sales with a trade-in had negative equity in Q4 2022, compared to 14.9% in Q4 2021.
- The average amount owed on upside-down loans was $5,341 in Q4 2022 compared to $4,141 in Q4 2021.
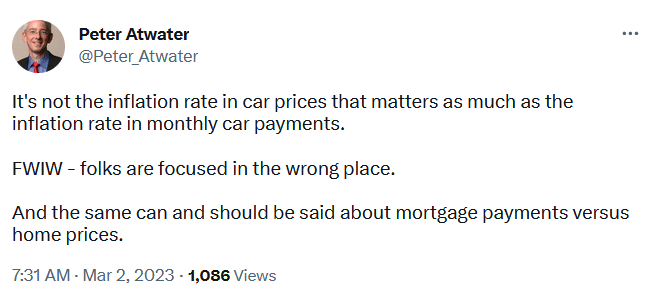
Tweet of the Day
Please subscribe to the daily commentary to receive these updates every morning before the opening bell.
If you found this blog useful, please send it to someone else, share it on social media, or contact us to set up a meeting.