


In a surprise announcement Sunday morning, OPEC cut oil production by 1.15 million barrels per day (bpd). Per OPEC, the cuts aim to support stability in the oil market. Since December, crude oil prices have oscillated between $70 and $82 a barrel. In mid-March, it broke the range falling to $64 a barrel. A break above $82 may propel oil back to the mid-$90 peaks from last fall. Crude oil surged over $5 to $81 a barrel on the news.
Two reasons are being floated by the media explaining the surprise production cuts. Per the Financial Times- “Riyadh was irritated last week the Biden administration publically ruled out new crude purchases to replenish a strategic stockpile (SPR) that had been drained last year as the White House battled to tame inflation.” Further, “The White House had previously offered reassurance to Saudi Arabia that it would step in to make purchases for its strategic reserve if prices fell.” The other explanation is that OPEC may anticipate a recession and reduced demand for oil. The graph below, courtesy of @forklift5909, shows the three most significant cuts in the last 25 years were done during the previous three recessions. On average, the price of oil drops for one, three, and six months after OPEC production cuts. While we think a recession is likely, we believe the move was predominately motivated by politics.

What To Watch Today
Economy
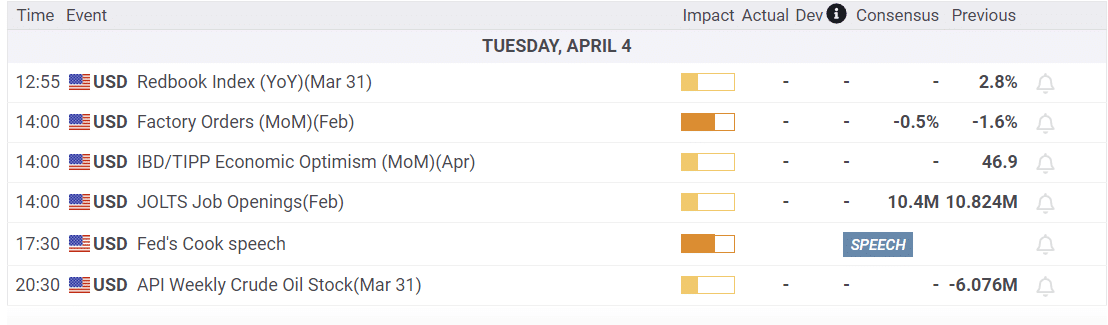
Earnings
- No notable earnings releases today
Market Trading Update
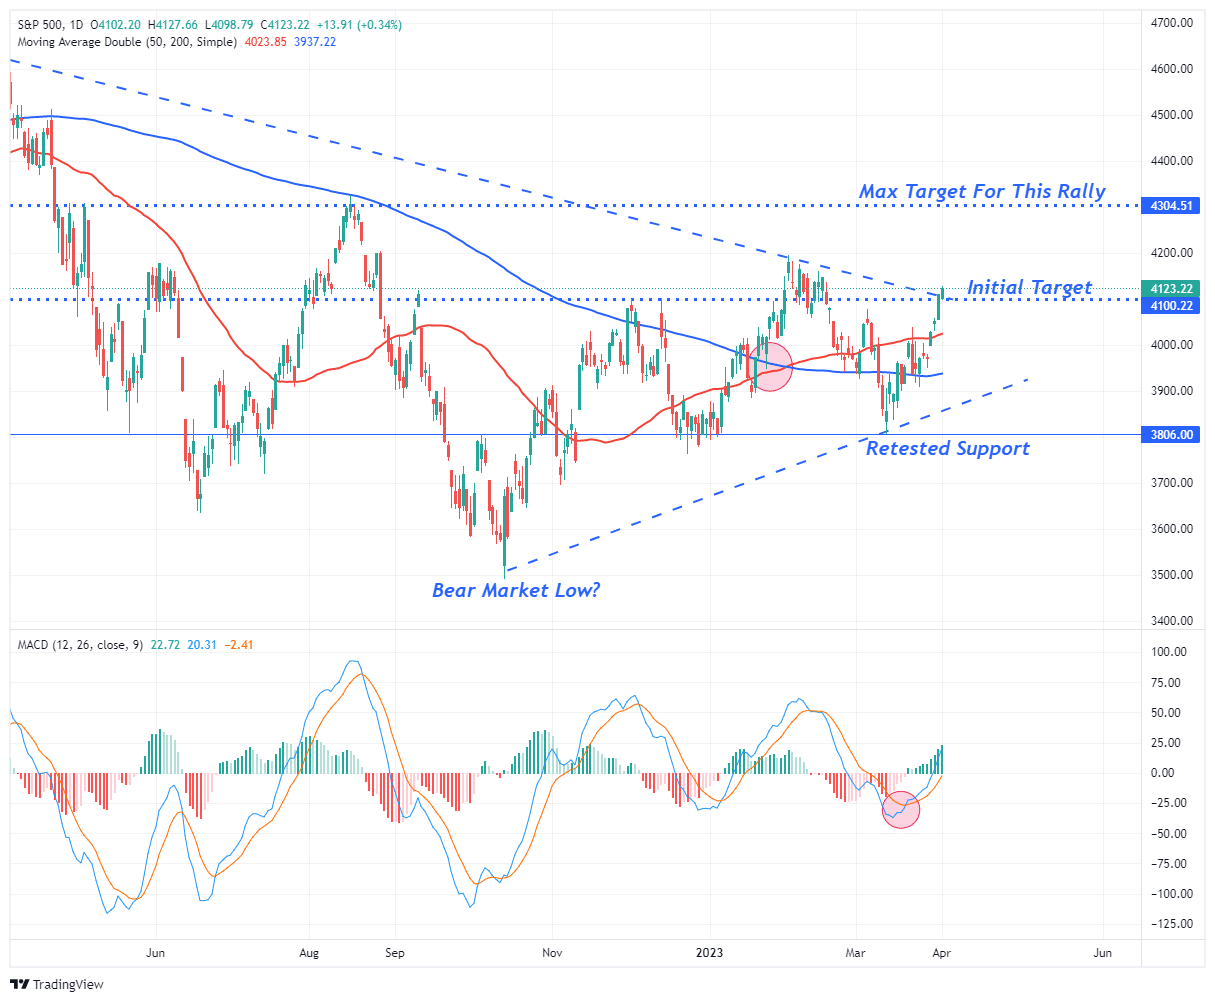
While trading was sloppy yesterday, with markets moving into positive and negative territory, it finished in the green and moved above the downtrend line from the April highs. This is a potentially bullish breakout if it holds. However, in the short term, the market is extremely overbought and needs a bit of a price correction to reset if a move higher is coming.
For now, maintain increased equity exposure and look for a pullback to the 50-DMA that holds to add exposure accordingly. With the 50-DMA trading decently above the 200-DMA, the market’s bullish trend persists. However, some important data could derail the bullishness from Friday’s employment report to the next FOMC meeting and the upcoming earnings season is coming up. With that said, watch the major market buy/sell signals and be prepared to reduce equity exposure when they turn.

Battling Behavioral Biases Make for Better Investment Results- Conformation Bias
Market pundits often share technical and fundamental analyses on stocks or markets. While both tools are critical for investment success, said pundits often fail to remind investors of the behavioral traits that play a big role in investor perception and, ultimately, their success. Given the importance of behavioral finance, we will spend some time discussing a series of behavioral biases in future commentaries.
We lead off with confirmation bias. This trait has strengthened with the growth of social media.
Confirmation bias is a condition when we search for or interpret information in a manner that tends to confirm our existing views and opinions. Those exhibiting this bias pay little attention to data and research that offer alternative possibilities.
Our Twitter feed is constantly inundated with opinions often aligned with our views. Such is the nature of the algorithms that drive social media. While confirmation of one’s views may build confidence, we argue it can be false confidence. We think the best way to gain a conviction for a market view is to assess what those with differing views think. For instance, we think a recession is highly likely. Therefore we spend more time reading commentary and research from those with optimistic economic outlooks. Refuting such analysis builds conviction or better appreciating a different view can motivate one to alter their view.
TPA Relative Rotation Analysis
In SimpleVisor, we offer an add-on service by Turning Point Analytics (TPA). TPA’s RRG report captures the movement in and out of stocks and sectors by quantifying momentum and relative performance.
TPA’s most recent RRG report notes interesting behavior in the sector ETF XRT and, especially importantly, explains what it might mean from an economic perspective. Per TPA:
Retail, defined by XRT – an even-weighted ETF has dropped to 5th worst in the ETF rank. At the beginning of December 2022, Retail (XRT) was the highest-ranked sector, but in 1-week XRT declined from #6 to #23. As the table below shows, this is the lowest rank for XRT going back to last summer. Unlike XLY, which is dominated by AMZN, XRT is a better measure of Retail stocks performance. This is definitely a development to watch as it may indicate consumer stress. Which could affect the economy and the stock market.

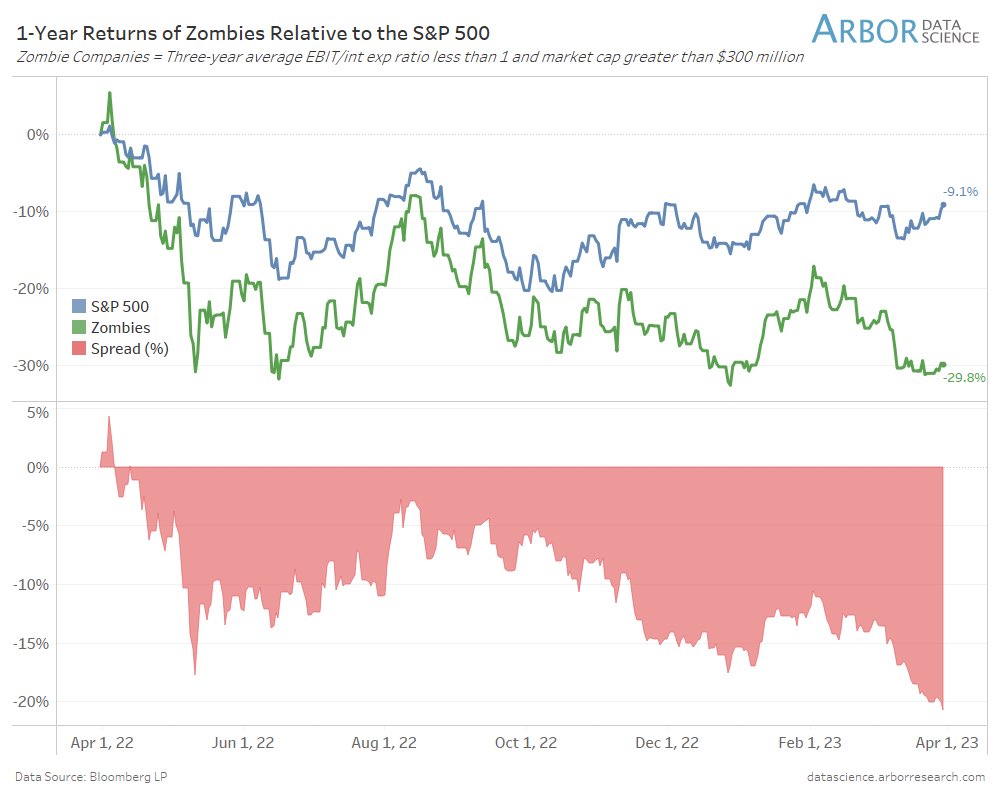
Zombies are Underperforming
Zombie companies have been underperforming the S&P 500 since 2022. As shown below, courtesy of Arbor Data Science, the one-year return differential between zombie companies and the S&P 500 is negative 20%. Zombie companies are those that do not earn enough to make interest payments. Therefore, they consistently require debt or asset sales to avoid bankruptcy. Consequently, higher interest rates and tightening lending standards are costly for zombies. The markets clearly understand the situation. While interest rates may be close to peaking, tightening lending standards, amplified by the fallout of the recent crisis, will keep pressure on zombie stocks.
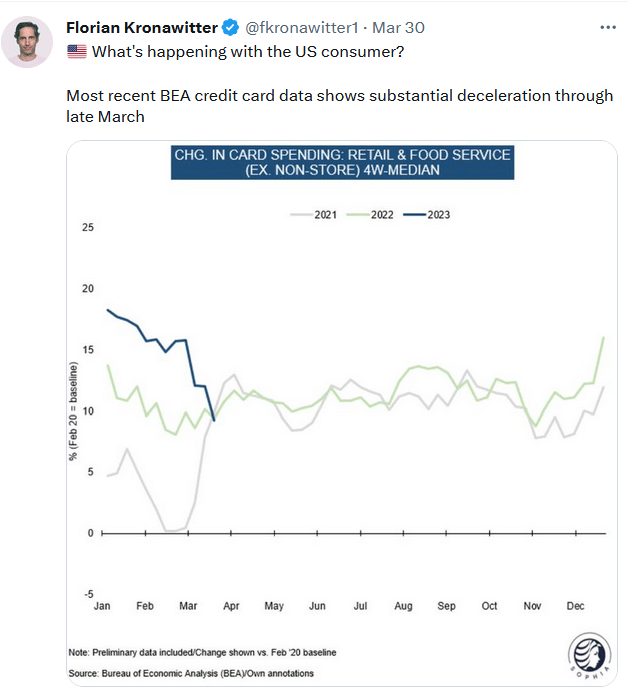
Tweet of the Day
Please subscribe to the daily commentary to receive these updates every morning before the opening bell.
If you found this blog useful, please send it to someone else, share it on social media, or contact us to set up a meeting.