We are keeping the legacy RIA Pro site up for a few weeks to make your adjustment to SimpleVisor easier. Your user name, password, and account settings will remain the same. Please contact us if you have any questions.
Starting today, Real-Time Commentary, Trade Alerts, Blog Posts, and Videos are only on the SimpleVisor site.
For access, go to SimpleVisor and expand the vertical Commentary menu item on the left side.
Daily Update has the Daily Commentary and recent RIA blog posts
Trade Alert posts all trades from our Equity and ETF SimpleVisor portfolios
Blog contains SimpleVisor reports such as the Technical Value Scorecard and Five For Friday
Video has the Three Minutes on Markets & Money and the Real Investment Show videos
We are replacing the running Commentary with Daily Market Commentary. Daily Market Commentary provides the same market-related information you are accustomed to, as well as more technical guidance and a preview of what to watch for in the day ahead. Here is today’s Commentary.
December 9, 2021
**Due to technical difficulties, there will be no 3 Minutes on Markets today.
Jobless Claims at 50-year Lows
Initial Jobless Claims fell to 184k this past week, hitting its lowest level since 1969. In 1969, the U.S. population was 203 million. Today it’s 332 million. If you adjust for the population increase, jobless claims are well beyond the prior record low of the late 60s.
Between last Friday’s employment report, JOLTs data, and initial claims, the Fed will likely continue to shift toward inflation-biased policy. Such logic entails the Fed will be more aggressive in reducing QE. Asset prices and the current high-risk tolerance among many investors are largely supported by the Fed’s liquidity. While markets may ignore the circumstances for a while, we mustn’t forget the Fed regime is changing. We think the change in monetary policy will be an important theme driving investment results in 2022. Stay tuned!
How Big Is Apple?
Apple’s stock is up over 10% in the last five trading days. In the last month, its market cap increased $400 billion and is now approaching $3 trillion. To put that in context consider the $400 billion gain in market cap over just the last month is more than the total market cap of the world’s 20th largest company, Walmart ($380 billion). The two bar charts below compare Apple versus the total size of the top ten nations ranked by their respective aggregate stock market capitalization and nominal GDP. As shown, Apple is bigger than all but six nations in terms of stock market size and is bigger than the GDP of all but seven nations.
Home Equity
The graph below from Home Equity Insights, by Core Logic, sheds more light on recent home equity gains which directly boosts the amount of credit available to consumers via mortgage refinancing. Core Logic estimates homeowners with mortgages saw their equity increase by $2.9 trillion over the past year, an increase of nearly 30%. The map below breaks down the average equity gains by state. The amount of credit card debt has recently picked up back to normal levels. Further, savings rates have fallen to pre-Covid levels. While both of those data points argue that consumers do not have much money beyond their paychecks to spend, the sharp increase in home equity is a potential source to fund new spending. Assuming house prices stay stable or increase, we should expect consumers to tap equity to finance consumption and lessen the burden of inflation.
December 8, 2021
Jobs Aplenty
The BLS JOLTs report once again confirmed there is a severe shortage of labor. JOLTs data lags the employment report by a month, but it shows there are 11.033 million job openings, 400k more than last month. This data along with recent productivity and labor costs adds to the mounting evidence that corporate profit margins will come under pressure in the coming month. Simply, job seekers and current employees have more bargaining power today than in decades.
The first table below puts context to how outsized the current number of job openings are versus the last 20 years. The second table breaks down the number of job openings by industry.
Apple’s Nightmare Before Christmas
Nikkei Asia published Apple’s Nightmare Before Christmas this morning, detailing how chip shortages and energy restrictions are cutting down on Apple’s ability to produce iPhones. Despite the bad news, it is not denting investor enthusiasm. Apple’s stock price has been on a tear recently, rising 22% since early October. Our equity model holds a 3.75% position in Apple.
“Due to limited components and chips, it made no sense to work overtime on holidays and give extra pay for front-line workers,” a supply chain manager involved told Nikkei Asia. “That has never happened before. The Chinese golden holiday in the past was always the most hustling time when all of the assemblers were gearing up for production.”
After launching the iPhone 13 range and new iPads in September, Apple is falling millions of units short of its production goals and missing out on billions of dollars of revenue. In many countries, it is now too late for consumers to buy some Apple products in time to give as holiday gifts.
Is The Short Term Rally Here To Stay?
Consumer Credit is Finally Slowing Down
Consumer Credit rose by $16.9 billion in October almost half of an expected $30 billion increase. It also marks a sharp slowdown from September’s $27.8 billion growth. As stimulus checks were wound down, consumers started relying more on credit card debt and mortgage refinancings to meet their needs and compensate for inflation. One month does not make a trend, but this new data point along with weak consumer spending data for Black Friday and Cyber Monday argues consumer activity may be slowing.
U.S. Multiple Expansion vs. The World
The graph below, courtesy of Top-Down Charts, shows that since the Financial Crisis the CAPE P/E ratio has expanded 3x in the United States versus staying relatively flat in developed and emerging foreign markets. One reason to partially explain the outperformance is that the U.S. equity indexes are more highly dominated by higher growth tech companies which tend to command higher P/E’s. That said, when it comes to paying the piper and valuations normalize in the U.S., foreign markets may offer a little protection.
December 7, 2021
Profit Margin Pressures Are Coming
Unit labor costs rose 9.6%, year over year, in part due to productivity, which fell 5.2% over the same period. Hourly compensation rose 3.9%. While wage growth is higher than average, it is well below the rate of inflation. The decline in productivity is the largest since 1960. Surging labor costs and falling productivity is a recipe for profit margin compression for many corporations. Given margins are at historically high levels, a decline should not be a surprise.
Easy Money- “Buying The 50”
The graph below shows how the S&P 500 (SPY) has repeatedly bounced off its 50dma in 2021. The black bars quantify the 20-day returns from each trading day SPY was below its 50 dma. As we show, buying below the 50 dma and holding for 20 days has been easy money. On December 1st, as circled, SPY fell below its 50 dma. It has since rebounded 3.5% from that day. “Buying the 50” is a great trade and may continue to work well, however, there will come a time SPY breaks below the 50 dma and fails to recover quickly. That could be a signal the market environment is turning.
The black line below charts the difference between implied volatility (VIX) and realized volatility. We use this measure to help us quantify how risk tolerances are changing for the market in aggregate. The difference between implied and realized volatility is frequently above zero, so we prefer to key on the variance around its trend line to assess. When implied volatility spikes above the trend line, it signals that investors are becoming more risk-averse as they bid up options. This is what happened last week as the difference rose to 8-month highs. The large difference has since come down but remains elevated. Also of note, the trend for the differential is gently rising, meaning investor risk-averseness is slowly increasing with the market. Given high valuations and the Fed pivot, the upward trend makes sense.
Bonds vs. Stocks
Based on the hoopla surrounding the bullish stock market one would think bonds would have been a bad place to be invested. Contrary to popular opinion, long-duration Treasury bonds (TLT) have kept up with the S&P 500 since April. The graph below shows the price ratio between TLT and SPY. The recent increase in the price of TLT and the decline of SPY have brought the ratio back to April’s levels.
December 6, 2021
The Fed Pivots
As is quite common, the Fed likes to signal changes in policy via the media. Today, the Wall Street Journal published an article entitled, High Inflation, Falling Unemployment Prompted Powell’s Fed Pivot. The article confirms some of Chairman Powell’s testimony to Congress from last week. The bottom line per the article: “Officials are making plans to accelerate the process at their policy meeting next week, ending it by March instead.” The article clearly articulates that inflation, not employment, is now the Fed’s primary concern. While the Fed thinks high inflation rates will come down next year, they “can’t act as though we’re sure of that.” The Fed often gets economic data prior to their release. Is it possible this Friday’s CPI report is concerning?
In last Friday’s Relative Value Scorecard report for RIAPro subscribers, we noted the communications sector is performing incredibly poorly on a relative basis versus the S&P 500. To wit: “The standout on the relative charts is the incredibly oversold condition of the communications sector. Its score is -12.41 out of a possible -13.5.” While a bounce versus the market is likely we caution the sector is very top-heavy. As such, over half of its weighting is in three stocks- FB, GOOG, and NFLX. The fortunes of those companies, especially FB and GOOG are likely to drive the sector. The graph below, courtesy of Charles Schwab, further highlights how poorly the communications sector is trading. Every member of the sector is below its respective 50dma and 81% are below their 200dma (not shown).
The Week Ahead
There are not many relevant economic data releases but what data is coming out is important to better assess what the Fed may do at their FOMC meeting next week. Wednesday’s JOLTs report is expected to show the number of job openings continues at or near record-high levels, meaning the labor market is robust. Job Quits, another indicator of the jobs market is also supposed to be high, signaling employee confidence in their ability to quit and find a better or higher-paying job. On Friday the BLS will report on CPI. After last month’s shocking 6.2% print, economists are expecting another bump higher to 6.8%. Such a number will put further pressure on Powell and the Fed to speed up the taper process and start thinking about the timing of interest rate hikes.
On Wednesday and Thursday, the Treasury will auction 10 and 30-year bonds respectively. Typically the auctions can weigh on bond prices in the days prior. The Fed will enter its self-imposed media blackout window this week with the FOMC meeting next Wednesday.
December 3, 2021
Are Value Stocks in Vogue?
The Finviz heat map below shows there is a clear divide between the winners and losers. The winners in green, are companies and sectors that have been lagging the market. Many of these companies are considered value stocks, due to their relatively low valuations. Many of the companies in red are stocks that have done very well this year. In many cases, they are trading at or near record-high valuations. The last few days have been a rare instance of outperformance by the value sectors. It’s way too early to call it a trend but it is worth following closely.
Five Stocks for Friday uses stock screens to give readers five stocks that we expect to outperform if a particular investment theme plays out in the future. Investment themes may be relevant to the current or expected market, industry and/or economic trends. Check out our inaugural picks.
First Impressions can be Deceiving
Stocks initially rose on the employment data as the weak jobs print might mean the Fed would step down from recent hawkish tones. St. Louis Fed President Bullard, quickly put an end to such wishful thinking and took the wind out of the sails of the stock market. He said the Fed could consider raising rates before they finish tapering. Almost all investors were under the impression the Fed would finish tapering before raising rates. Such implies no rate hikes until July unless the Fed speeds up its taper schedule. The May Fed Funds Futures Contract now implies a 65% chance the Fed tightens before June. The market is betting that Bullard is on to something.
The BLS Employment Report- Good or Bad?
CNBC says “Job Growth Disappoints“. CNN Money writes “The U.S. economy added 210,000 jobs in November, far fewer than expected.” The headline number, +210k new jobs, is well off expectations for a gain of 545k jobs, thereby justifying the concerning headlines. However, the underlying employment data was robust. The unemployment rate fell from 4.5% to 4.2%. Maybe the most crucial data point persuading the Fed’s assessment of the labor markets is the labor participation rate which rose .2% to 61.8%. Chairman Powell repeatedly uses the low participation rate as an excuse to remove monetary accommodation at a very slow pace. Might the pick-up in labor participation further support his recent hawkish tone regarding combatting inflation? The market is reacting positively to the report, signaling it thinks weak job growth will impede the Fed from speeding up the pace of tapering at the December FOMC meeting.
Our graph below shows that professional and business services accounted for nearly half of the job gains. Curiously, retail lost 20k jobs in November, which is one of the biggest shopping periods. We suspect the seasonal adjustments and Covid-related anomalies make reporting an accurate number difficult for that sector.
The graph below shows that the risk/reward equation for the S&P 500 becomes much more skewed when the VIX is between 31 and 100. The VIX has been hovering near 30 recently. The green shaded area shows that S&P 500 returns tend to follow a relatively normal distribution curve with a skew toward positive returns. The black bars highlight the non-normal distribution of returns when the VIX is elevated. During such periods, returns tend to be better than average but the risk of a 10-20% drawdown is also much higher than when the VIX is below 31.
Stranded Containerships
The graph below courtesy of Zero Hedge and Goldman Sachs shows the amount of stranded containership tonnage at U.S. ports is abating. Per Goldman Sachs: “While the amount of stranded tonnage is still historically elevated, a further decline in congestion could boost supply and ease inflation pressures for consumer goods and manufactured products in early- or mid-2022”. It is also worth noting that as we pass the holiday season the demand for many goods will lessen appreciably which should further relieve pressure at the ports.
December 2, 2021
OPEC is Threatening to Curtail Planned Output Increases
Oil prices opened the day 5% weaker as OPEC decided to go ahead with a planned output hike of 400k barrels for January. The news was a bit of a disappointment as there were expectations they might curtail the increase to 200k or even less. Oil prices came storming back, however, as OPEC said they may revisit the potential to reduce their planned output increases at the January 4th meeting.
The tweet and graph below show the bullish percent index on the S&P 500 has dipped below 50%. The last six times that occurred it proved to be a good buying opportunity. However, as shown, the first dip below 50% on the graph was a false signal. Do you feel lucky? The index is a measure of breadth that simply counts the percentage of stocks with a point & figure buy signal.
In yesterday’s commentary, we note that heavy short interest in Treasury note futures could propel bond prices higher (yields lower) if those with shorts are forced to cover their positions. The graph below provides a little technical context for what might cause them to do so. As shown, the price of TLT (20 year UST ETF) has bumped up against $152 numerous times since July. Each time it was repelled but to increasingly higher lows. If bonds can break through the current wedge pattern, the 2020 highs may be in sight. Many technical traders’ that are short bonds are likely watching how this plays out closely.
Will Inflation Heat Up More?
The first graph below shows the inverse correlation between rental vacancy rates and owners’ equivalent rent. Not surprisingly, a lower vacancy rental rate tends to result in higher rental prices. With the Fed seemingly getting more serious about inflation, rental prices and owners’ equivalent rent (OER), which account for nearly a third of CPI, become very important data points to follow more closely.
Rental vacancy rates are back to 30+ year lows which is pushing rents higher. Adding to the pressure on rents and ultimately CPI is surging home prices. The second graph, courtesy of Fannie Mae, shows their model based on home prices predicts a big jump in OER in 2022. Per the article: “On a year-over-year basis, house price gains historically lead to changes in the CPI shelter cost measures by about 5 quarters.” Home prices started spiking in September of 2020, about 5 quarters ago. If CPI continues higher, the Fed is more apt to remove liquidity quicker. As we discuss in Is a Stock Market Crash Like 2000 Possible, liquidity via QE and zero rates are the lifeline of excessive stock valuations.
December 1, 2021
National Manufacturing Surveys
The PMI manufacturing survey was weaker than expectations at 58.3 versus 59.1. Per the report- “November PMITM data from IHS Markit signaled the second-weakest rise in production recorded over the past 14 months as producers reported further near-record supply delays and a slowing of new order inflows to the softest so far this year. Jobs growth also waned amid difficulties filling vacancies.” Further- “While average selling price inflation eased as firms sought to win customers, the rate of input cost inflation hit a new high, hinting at a squeeze on margins.”
The ISM survey came in at expectations of 61.1. While below levels from earlier this year, the survey remains near 20-year highs. The much-followed prices paid index fell slightly. Supply line disruptions remain a big problem. Over half of the respondents report slower delivery times. The normal range is 10-20%. The table below annotated by Zero Hedge shows six of the ten ISM components were lower this month.
The chart below provides fodder for oil bulls and bears. The price of oil tends to rally strongly following periods when the OVX (oil volatility index) is above 65. Currently, the index is at 75. While the reading entails oil may rise in price once volatility declines, we must consider the volatility index can stay elevated resulting in further declines. For example, the index was above 65 from October 2008 to March 2009. In 2020, the index was above 65 from early March until late May. Currently, the index is only on its third day above 65. Bulls are waiting on a sub-65 reading and bears are hoping volatility remains elevated. We do caution, the index can fall slightly below 65 for a day or two before rising back above 65. In such prior cases, the price of oil continued lower.
The second graph below compares the price of the popular energy sector ETF, XLE, to the OVX index. As shown, like oil prices, XLE tends to do well once the index falls back below 65. However, XLE bucked the trend in 2020 as it rose when the index was above 65 and fell once it dropped back below 65.
Everyone Hates Bonds- Is That Bullish?
Per Reuters, the net bearish bets on U.S. Treasury ten-year note futures is now the largest since February 2020. In January and February 2020, bond prices were rising and yields falling as the economy was slowing and the Fed had begun cutting rates late in 2019. The advent of Covid in early March sent bond prices soaring, fueled in part by traders forced to cover their short bets. Today, like then, net shorts are extreme and some traders are starting to buy to cover their shorts as the new Covid variant and hawkish tones from Powell pressure stocks. History may not repeat itself, but it often rhymes.
Cyber Monday Disappoints
According to Adobe Analytics, sales for Cyber Monday were disappointing. Online sales for last Monday totaled $10.7 billion, a 1.4% decline from last year. While it is the first decline for Cyber Monday, one must factor that last year’s data was an anomaly due to Covid and consumers’ reluctance to go to stores. To wit, foot traffic is up 48% versus last year, but it is still down 28% from pre-pandemic years. Personal consumption accounts for approximately two-thirds of GDP. As such, holiday spending is an important component of growth. This year we must be careful reading too much into retail sales data. Inflation and shortages of many goods are resulting in timing and spending behaviors that are not comparable to years prior.
November 30, 2021
Consumer Confidence Continues to Weaken
The Conference Boards Consumer Confidence Index fell to 109.5, down from 111.6. Both the present situation index and the expectations index were lower. Driving consumers’ moods are concerns about rising prices and income prospects.
The Chicago PMI, a precursor to national manufacturing surveys, fell more than expected to 61.8 from 68.4. After hitting a high of 75 in April, the index has been trending lower. The slowing of new orders and employment were partially responsible for this month’s decline. The ISM and PMI manufacturing surveys will be released tomorrow. Both are expected to show slight increases from last month.
Sounding The Inflation Alarms
Chairman Powell was vocal about inflation and is finally backing off using the word “transitory” to describe it. Per his testimony to the Senate: “time to retire the term”transitory” regarding inflation.” He followed, “the risk of persistently higher inflation has increased. We will use our tools to make sure higher inflation does not become entrenched.” The inflation comments are an upgrade to his recent descriptions of inflation. However, he countered the discussion by mentioning the weak labor participation rate and covid related factors affecting economic growth. On balance, his statement was a little more hawkish than usual.
Chairman Powell spoke late on Monday. While his economic assessment was generally in line with other recent speeches, he did offer pause about the new Omicron variant.
The recent rise in COVID-19 cases and the emergence of the Omicron variant pose downside risks to employment and economic activity and increased uncertainty for inflation. Greater concerns about the virus could reduce people’s willingness to work in person, which would slow progress in the labor market and intensify supply-chain disruptions.
Buckle Up – The Debt Ceiling is Upon us Again
The last debt ceiling debate ended with an extension to mid-December. December starts tomorrow, and the debt ceiling headlines are starting back up. For instance, Bloomberg reports that Congress needs to pass a stopgap funding bill to keep the government open beyond this week. The graph below, courtesy of Zero Hedge, shows that Treasury Bills maturing in mid and late December are now trading about 4bps higher than where they should. Such a kink in the curve is due to investors requiring a premium to take the risk that principal payments on maturing bills are delayed.
A Bull Market For the Ages
The chart below, courtesy of Fidelity, shows all of the cyclical bull markets since 1920. The rally starting in 1932, following the crash of 1929 and subsequent 89% drawdown, is the only rally that is steeper than the current post-March 2020 rally.
November 29, 2021
Twitter Rollercoaster
Twitter’s stock jumped almost 10% at the market open on news that CEO Jack Dorsey will be stepping down. The gains were short-lived as shown in the graph below. Twitter has become a large social media brand but its stock price is basically flat since IPO’ing in 2013. After the initial rush of enthusiasm, it appears investors are concerned that promoting a long-time Twitter veteran (current CTO – Parag Agrawal) to replace Dorsey will not result in the types of changes investors are asking for.
The graph below compares two widely followed foreign stock ETFs and the S&P 500, from the beginning of the Covid outbreak through today. EEM holds emerging market stocks, and EFA developed market stocks. As shown, all three ETFs performed similarly during the decline in early 2020 and the recovery afterward. However, starting in the spring of 2021, the foreign market ETFs peaked while the S&P 500 continued to new highs. Over the last nine months emerging markets (EEM)s have given up about 25% of their post-Covid gains, while developed markets (EFA) have essentially flatlined. The following factors help account for some of the U.S. equity outperformance:
Since June 2021, the USD index is up about 8%.
The economic recovery in the U.S. has been stronger than in most nations.
The Fed is slightly more hawkish than other central banks.
China’s economic activity has slowed significantly, weighing heavily on many emerging markets.
The week’s significant events will be the ADP employment report on Wednesday and the BLS report on Friday. Currently, the forecast is for a gain of 550k jobs in the November BLS jobs report. Investors are likely to focus on the labor participation rate as Fed Chairman Powell claims the lower rate is a sign of labor weakness. The current estimate is for the participation rate to uptick 0.1% to 61.7%.
Investors will also watch the ISM manufacturing and services surveys on Wednesday and Friday, respectively. Current indications are that both numbers will remain at their current levels. We will follow the price gauges in both surveys closely.
The next Fed meeting will be in two weeks on the 15th of December. Assuming the new covid variant does not become problematic for global economic activity, we might see some Fed members encouraging a faster tapering pace in speeches and comments this week. Voting Fed members go into their self-imposed media blackout period next week, so this week may be their last chance to speak up publically before the meeting.
November 26, 2021
**The equity markets will close at 1 pm ET today
Green in a Sea of Red
The Finviz heat map below shows many stocks are down 2-3% on the day, but there are a few bucking the trend. In most cases, the green on the map is in businesses that benefit from the lockdowns. In addition to the obvious winners in the healthcare industry, are Verizon, NetFlix, and Clorox. Moderna and Pfizer are up significantly. The restaurant and travel business are faring the worst. In the upper right corner, notice losses approaching 10% for Marriot, Las Vegas Sands, and Booking.com.
Stocks are declining worldwide due to a new variant of covid detected in South Africa. Per CNBC:
“South African scientist Tulio de Oliveira said in a media briefing held by the South Africa Department of Health on Thursday that the variant contains a “unique constellation” of more than 30 mutations to the spike protein, the component of the virus that binds to cells. This is significantly more than those of the delta variant.
Many of these mutations are linked to increased antibody resistance, which may affect how the virus behaves with regard to vaccines, treatments and transmissibility, health officials have said.”
The bond market is assuming the new strain will force the Fed into a more dovish policy stance. 2-year yields are down 12 bps this morning, essentially taking out half of a 25bps Fed rate hike over the next two years.
Many traders are out for the holiday, so liquidity will be poor and trading may likely be volatile.
The Dollar is on Fire
The dollar rose in light trading on Wednesday. The impetus behind the dollar continues to be economic data that the market believes will push the Fed to become more hawkish. It is worth noting many corporate and sovereign borrowers that borrow in dollars for use in their home country are exposed to currency risk. Essentially, a stronger dollar increases their net borrowing costs as they have to convert to dollars at a higher rate to pay interest and principal. As such, a strong dollar tightens liquidity for the rest of the world and will inhibit global economic growth if the dollar continues upwards. The graph below shows the dollar index is up over 7% year to date.
Defining “Prolonged” and “Substantially Exceeds”
The Fed recently informally updated its price stability policy. Under the new inflation averaging regime, they will allow inflation to run higher than 2% for short periods, to compensate for periods when it was below average. The graph below shows the three-year average inflation rate is now 2.7%. Further, the annual inflation rate is 6.2%. Fed members are increasingly getting nervous that inflation is running hot for a prolonged period and the current rate substantially exceeds the Fed’s target on both a short-term and longer-term averaging basis. We expect to see various Fed members discussing their thoughts on how to adjust monetary policy to better manage inflation.
November 24, 2021
**The stock and bond markets will be closed tomorrow. Trading volumes should be light this afternoon.
The Team at RIAPro wishes you and yours a very happy Thanksgiving holiday.
A Plethora of Economic Data
Jobless Claims fell to 199k in the latest week, marking a low going back to November 1969. Keep in mind that the population is 65% larger today than in 1969, so today’s number is off the charts on a population-adjusted basis. This is yet another piece of data that affirms the labor market is robust. Having an inflation problem and strong labor market is more evidence the Fed needs to speed up tapering QE and start contemplating rate hikes.
Durable Goods fell 0.5% versus expectations for a 0.3% gain and a prior month reading of -0.4%. Excluding transportation, the number was positive at 0.5%. Accounting for the difference is the auto sector, which struggles to produce cars due to the chip shortage.
Wholesale inventories rose 2.2% versus 1.4% last month. This is a positive sign that supply line problems and shortages are abating. However, Retail Inventories only increased by 0.1% versus falling 0.2% last month. Either retailers are not fully stocking up on goods to help justify higher prices, or trucking problems are making it difficult to deliver goods. It is likely a combination of both factors.
Are Junk Bonds Sending Us A Warning?
The graph below shows the strong correlation between JNK and the S&P 500. JNK is a popular junk bond ETF. JNK just hit lows going back to July, while the S&P is nearly 10% above its July levels. JNK is also back to its 200dma, something the S&P hasn’t done since it broke through the 200dma in June 2020. Higher yields for junk bond issuers can lead to financial hardship and bankruptcy in some cases as they tend to be overleveraged. Are inflation and the possibility of the Fed raising rates finally concerning JNK investors? Maybe the better question is, is the recent price action of JNK foreshadowing problems for the equity markets?
More Details on the SPR Oil Release
Of the 50 million barrels being released from the Strategic Petroleum Reserve, 32 million will be under the exchange program. Companies that successfully bid to receive oil under the program must pay it back and with interest, so to speak. The winning bidders can take delivery starting December 16th from one of four sites. They will then have to return the oil plus a premium in the future. Each site has a different premium and date range requirement regarding the return of the oil. For example, Bryan Mound will offer 10 million barrels. The oil has three return dates, with the first starting January 2023. If the oil is returned at that time, the winning bidder must return an additional 3.9% of oil. The premium increases to 5.3% and 8.6% if they choose the second or third delivery dates, respectively. In the short run, the release will add supply to the market but reduce it starting in July of 2022.
The graph below, courtesy of Bianco Research, provides context for the size of the SPR and recent withdrawals from the reserves.
President Biden is ordering the Department of Energy to release 50 million barrels of oil from the Strategic Petroleum Reserve. The action is in unison with China, India, Japan, Korea, and the U.K. Per the announcement:
“The President stands ready to take additional action, if needed, and is prepared to use his full authorities working in coordination with the rest of the world to maintain adequate supply as we exit the pandemic.”
What’s Wrong With Gold?
A reader asked us why gold fell over $40 an ounce on Monday. While some media outlets ascribe it to Powell’s nomination, the real answer lies in the two charts below. The first chart, from our article The Fed’s Ever Growing Footprint, shows the strong correlation between the price of gold and real interest rates (nominal interest rates less the implied inflation rate). Gold prices often rise when real rates fall and vice versa. The second graph, courtesy of Zero Hedge, shows real rates (green) have risen about 20bps (from -1.20% to -1.00%) from midday Friday through Monday. The sharp increase is due to the 10-year break-even inflation rate (red) falling and bond yields rising.
Will Bond Bears Be Proven Wrong, Again?
Short interest in bond futures is currently at or near record highs. Given the inflation outlook and the Fed’s lethargic response to combatting inflation, shorting bonds may seem like a nice trade. It may be, but context is valuable in this case. The graph below from Jim Bianco shows that professional forecasters have been consistently wrong in predicting the path of bond yields since 2002. Those short bond futures better hope this time is different.
Reminiscent of 1999
We stumbled upon the table below highlighting market performance by sector in the months leading to the Tech crash in 2000. It looks awfully familiar to the poor breadth of the last few days of trading.
November 22, 2021
Rivian Is Out of Favor
Last week’s favorite EV automobile company, Rivian (RIVN), is taking it on the chin. Today shares are down more than 10% as plans to develop cars jointly with Ford (F) have been canceled. The stock has lost a third of its value in the last few days, yet is still up 10% since its November 11th IPO. Ford is up over 5% on the news. Also helping Ford are rumors they may break off their electric car division.
U.S. Federal Reserve Chair Jerome Powell is being renominated by President Biden for a second four-year term. The runner-up for the seat, Lael Brainard, is the new Vice-Chair. The initial reaction from the stock futures market is bullish. The asset markets and betting markets had high odds for his renomination.
As we write below, the use of leverage by retail investors is up sharply. Similar behaviors are occurring by many institutional investors, including the more conservative types. The following comes from David Robertson and Almost Daily Grant’s
“Facing a high bar to generate necessary returns within the confines of public markets, the largest pension fund in the United States tweaks its own strategy in the opposite direction. The California Public Employees Retirement System (Calpers) voted in a board meeting yesterday to upsize its allocation to private equity holdings to 13% from 8% and bump private credit holdings to 5% from less than 1%, while adding $25 billion in leverage (equivalent to just over 5% of assets) to help juice returns. Without those changes, Calpers estimates that its portfolio would generate a 20-year return of 6.2% annually, lagging the 6.8% annual bogey established this summer, which was itself lowered from 7%.”
David’s summation- “To sum up, the largest pension fund in the country is not only increasing allocations to the riskiest assets at the most expensive valuations in history, but it is also taking on debt to boost returns even more.”
Leverage Galore
The graph from Top Down Charts below shows that investors’ participation in leveraged long ETFs has tripled since the pandemic. Due to zero interest rates, the cost of leverage has never been cheaper for the ETF managers and ultimately the investors. However, if the Fed gets closer to raising interest rates the cost of leverage will rise in anticipation. This may be a fly in the bull market’s ointment, but likely a story for next year, not this year.
The Week Ahead
Despite the Thanksgiving holiday, it will be a busy week for economic data releases. Of note are Existing and New Home Sales, PMI Manufacturing Survey, Durable Goods, GDP Price Index, and Personal Income and Spending. The Fed will also release the minutes from its November meeting on Wednesday.
November 19, 2021
More Bad Breadth
The graph below shows that despite the NASDAQ hitting new highs, the number of new lows is now the highest since March of 2020.
Faster Taper
The more hawkish Fed members are finally expressing their views and it seems they want to speed up tapering. For instance, Fed President Chris Waller said “The rapid improvement in the labor market and the deteriorating inflation data have pushed me towards favoring a faster pace of tapering and a more rapid removal of accommodation in 2022.” A “more rapid removal of accommodation” implies raising interest rates. He also mentions the Fed should consider “contracting its balance sheet“, aka selling bonds.
What’s Ailing Europe?
As we note below, Covid infections are on the rise in Europe and we are now learning Austria is going on a full lockdown. We suspect other European nations may follow their lead. The Euro has traded poorly over the last week, in part due to the rising number of infections and their economic implications. As we show below, the Euro/USD is down about 4% since the start of the month. More importantly, it has fallen about 10% versus the dollar since early June. Europe’s economy is not rebounding as strongly as the U.S. which helps explain part of the underperformance. As a result, the ECB has been more dovish (if that’s possible) than the Fed.
This morning ECB President Christine Lagarde essentially ruled out rate hikes in 2022. Per her speech- “conditions to raise rates are very unlikely to be satisfied next year.” Currently, the Fed’s “dot plots” call for one rate hike next year, and the markets see as many as three hikes.
The Bloomberg graph below shows that the stocks spending the most on buybacks (orange) are outperforming the S&P 500 (white). The chart also shows that companies investing the most in R&D and Capex are considerably lagging the market. Investors should be concerned that the companies investing the most into their future are essentially being punished. Slowing productivity growth is a big factor limiting future economic growth. This chart highlights the personal incentive for most executives with equity-based salaries to buy back stock instead of engaging in productive investments.
Covid Infections are Spiking Again in Europe
The graph below from Longview Economics shows that Covid infections in many European countries are rising rapidly and in some cases at the highest levels since the pandemic began. The sharply increasing number of cases will likely result in lockdowns in Europe, which will stunt economic activity in Europe and to a much lesser degree worldwide. The big question for U.S. investors is will the high rate of infections spread across the Atlantic? Further, the euro versus the dollar has been declining rapidly. If the high rate of infections continues and European economic growth suffers, will the dollar continue to appreciate versus the euro?
November 18, 2021
NVIDIA (NVDA) Earnings
NVDA reported third-quarter earnings yesterday after the close. GAAP EPS of $0.97 easily topped the consensus estimate of $0.86, thanks to strong demand and favorable product mix. Gross margin increased +2.6% YoY to reach 65.2% in the third quarter. Revenue of $7.1B (+50.1% YoY) modestly beat expectations of $6.8B, driven by record sales in the Gaming (+42% YoY) and Data Center (+55% YoY) segments.
Management set guidance for Q4 revenue at $7.4B plus or minus 2%, which sits above expectations of $6.9B. In addition, they guided for gross margin to remain steady at 65.3% plus or minus 50 bps. The positive momentum and strong guidance are being well received by the market, as the stock is trading +10% this morning. We hold a 1.75% position in the Equity Model.
Higher Prices in Philly
The Philadelphia Fed Economic Survey, showing current economic conditions in the mid-Atlantic, points to robust activity. The index rose to 39, its highest level since April. Prices also continue to rise with the prices paid index rising to 80, just a hair below 80.7 in June, which was a 42 year high. A score of 80 means that 80% of those surveyed witnessed higher prices in November than October. Price received rose as well to its highest reading since 1974. The bottom line is companies are paying more for input goods but are able to pass the higher costs to consumers.
The most important part of this survey is this month’s special question. Per the Fed: In this month’s special questions, the firms were asked to forecast the changes in the prices of their own products and for U.S. consumers over the next four quarters. The results, as shown below, are clear that firms are bracing for more inflation in the prices of goods they sell as well as higher wage expenses. More telling, their longer-term inflation forecast rose by half a percent to 3.5%.
The chart below from the Leuthold Group shows that stocks are extremely expensive by all measures except those that compare valuations to interest rates. The Fed model and the two equity risk premium valuations are relatively cheap because interest rates are so low. The problem we have with those models is that interest rates are so low in part because future economic growth and therefore earnings growth are also trending lower.
Infrastructure Spending Forecasts
The graph below from Moody’s shows net spending from the recently passed infrastructure bill and the current proposal for the social infrastructure bill. Currently, nominal GDP is over $23 trillion. If we assume the social bill passes, as it is currently written, additional government spending from both bills will peak in 2025 at about $150 billion. That amount would add approximately .60% to GDP. While somewhat meaningful, we must also consider net government spending from the two bills in aggregate decline in the years 2028 and beyond.
November 17, 2021
The Next Big Shock
Fed’s Mester Says Improving Treasury-Market Resilience Is Top Priority
Fed’s Williams says: “We Must Think About How To Shore Up The Treasury Market So It Can Better Endure The Next Big Shock “
The two comments/headlines came out on the same day. The Fed owns 25% of all U.S. Treasury securities outstanding and north of 50% of the available float. Despite their holdings, and the significant effect it has on yields, they appeared worried that volatility could destabilize the bond markets. Do they see an event on the horizon that could significantly shock interest rates much higher or lower? The only obvious events we can think of are a quickened pace of tapering or the coming debt ceiling debate in Congress.
Powell or Brainard?
President Biden says he will choose the next Fed Chair in the coming days. The market is betting that Powell gets renominated, but some believe Lael Brainard has a chance. “Who Will Be The Next Fed Chair?” a Baron’s article, compares and contrasts the two candidates. While they certainly have differences, Brainard is likely to be equally as dovish as Powell if she were to get the nomination. However, from the market’s perspective change may be viewed poorly. To wit, Danielle DiMartino Booth is quoted in the article as follows:
“Moreover, a shift away from the continuity at the Fed that Powell represents would like roil the markets, which is the last thing Biden needs now, she adds in an interview.”
Mark Hulbert from MarketWatch shares a little-known secret about earning 7% yields in U.S. Treasury securities. In his article, Hidden In Plain Sight Is A U.S. Treasury Yielding More Than 7%, Mark walks through Treasury I bonds and the benefits of owning them in a higher inflation environment such as today. With the 6.2% inflation CPI print last week, the new coupon rate on I-bonds is set at 7.12% for the next six months. Because I-bonds reflect the current inflation rate, they are a viable alternative to TIPs for investors looking to retain their purchasing power. As a comparison, the real yield (nominal yield less expected inflation rates) on the 5-year Treasury note is -1.66%. The graph below compares nominal yields for I-bonds versus the Treasury curve.
Job Quitters are Driving Up Wages
The Job Quit rate is up to 3%, the highest level since they started tracking it twenty years ago. People typically “quit” or voluntarily leave jobs in search of higher-paying jobs. The graph below confirms a strong correlation between the quit rate and wages for those switching jobs. Given the record number of job quitters, we suspect wages will continue higher, putting further pressure on corporate profit margins and, more importantly, increasing the risk of a wage-price inflation spiral.
November 16, 2021
Stronger Than Expected Retail Sales
Despite weakening confidence, consumers spent a lot of money last month. Retail Sales rose 1.7%, up from 0.7% last month and well above the 1.0% consensus. While the number was great, there are a couple of factors that may be overstating it. First, Retail Sales is nominal, meaning it doesn’t capture inflation. As such, consumers may be buying a similar number of goods but paying more for them. Second, we believe many people are ordering Christmas gifts early due to concerns about supply lines and shortages. If this is the case, sales for November and especially December may end up being weaker than expectations. One last point, Hanukah starts on the Sunday after Thanksgiving this year, which is also driving earlier than normal demand.
As the first graph shows Bitcoin is down about 11% over the last few days. While a double-digit percentage move is quite often significant for most assets, it is fairly commonplace for Bitcoin. In fact, the five-day average price range using the high and the low for each five-day period since 2014, is 11.65%. The second graph circles the recent five-day range, highlighting just how average it is.
Lofty Earnings Expectations
“The attractive P/E to LTG ratio, or ‘PEG ratio’, of the S&P 500 is due to lofty growth expectations, not low valuations… LTG rates are better contrary than positive indicators… today’s level would suggest losses of -20% over the next 12 months” – BofA
Bottom line- implied long-term earnings growth of nearly 20% is well above any level witnessed since 1986, including 1999. It’s also more than double any actual growth rate over the period. Now consider, profit margins will be under pressure due to rising prices and wages, the Fed is removing accommodations, and economic growth will normalize. Given these headwinds, the implied growth forecast seems like pie in the sky. An adjustment of growth expectations is likely to make investing much more difficult in 2022 than this year.
Diversification Ain’t What it Used to Be
The graph below, courtesy of Jim Bianco, shows the diversification benefits of a passive portfolio are rapidly fading as the five largest stocks now garner nearly 25% of the contribution to the S&P 500. While many investors may think they are diversified because they indirectly own 500+ stocks, such is not mathematically accurate. Yes, they own a piece of 500+ stocks, but the returns are heavily based on five stocks.
November 15, 2021
Lofty Expectations for Interest Rate Hikes
The graph below shows the implied Fed Funds rate based on Fed Funds futures pricing. The blue bars represent the expected dates at which a 100% chance of a rate increase will occur. For example, the market assigns a 100% chance of a rate increase by August 2022 and a 100% chance of a second increase by November 2022. As we show, the market expects the Fed to increase rates five times to 1.25%, by the end of 2023.
There is definitely not a shortage of turkeys on Wall Street, but if you are planning on serving turkey for Thanksgiving you may want to buy one soon. As the graph shows, the volume of birds in storage is running at about half the normal rate for this time of the year.
Slumping Confidence and Political Ramifications
Last week we reported the University of Michigan Consumer Sentiment Survey fell more than expected and now sits at 10-year lows. After digging deeper into the report we discovered something interesting that will likely gain importance as we near next year’s mid-term elections. First, the divide in sentiment between Democrats and Republicans is massive at 90.8 and 53.1 respectively. More telling, confidence among those considering themselves independents fell sharply to 69.2. It is likely independents, along with moderate Democrats and Republicans that will decide the balance of power in the House and Senate. If the confidence of independents continues to fall, the Democrats are more likely to lose the House, Senate, or possibly both.
The Week Ahead
The economic calendar starts in earnest on Tuesday with Retail Sales and Industrial Production. Given the recent drop in consumer confidence, we would expect retail consumption to slump. However, retail sales do not account for inflation, thus forecasts are for an increase of 0.5%. The week will be relatively quiet on the economic front after Tuesday.
We expect to see numerous Fed speakers this week. With the recent barrage of employment and inflation data, a few speakers may call on the Fed to increase the pace of tapering and move up the timeline for interest rate increases.
Options expiration is on Thursday. As David Robertson points out below, options market volume has been extreme. Such high volumes and open interest along with generally low stock volume can lead to large price swings.
Retail is extremely active, and they love punting options. Below are a few stunning facts via Goldman’s Scott Rubner:
1. single stock option notional (140%) now exceeds single stock shares notional
2. over 70% of options traded have an expiry of two weeks or less (more in the 2,3,4 day range)
3. $904bn (Thursday stock option notional). This is largest single stock option notional traded of all time.
November 12, 2021
It’s Transitory They Say
Consumer Sentiment and JOLTs
The University of Michigan Consumer Sentiment Survey fell more than expected to 62.8. The one-year inflation expectation ticked up from 4.8% to 4.9%. The report states: “Consumer sentiment fell in early November to its lowest level in a decade due to an escalating inflation rate and the growing belief among consumers that no effective policies have yet been developed to reduce the damage from surging inflation.”
The BLS reports there are now 10.438 million job openings, slightly better than forecasts of 10.30 million. The two graphs below show the extreme imbalance between the number of job openings and the unemployment rate. The ratio of the two in the bottom graph is at 20-year highs. The “quits” rate rose from 2.9% to 3%, another sign of a robust labor market. Our latest article, What a Rate Hike in 2022 Might Mean for “Stonks“, discusses how the labor market is much healthier than the Fed believes.
Rivian vs Ford and Gm
Rivian (RIVN) is the latest company to benefit from the electric vehicle stock craze. Its stock went public on Wednesday and now has a market cap of over $100 billion. We thought it would be helpful to compare RIVN to Ford and GM for proper context. Keep in mind, both Ford and GM, have numerous electric vehicles already being distributed and more models in the pipeline.
Ford has a market cap of approximately $80 billion and GM is at $90 billion.
Rivian has revenue that is expected to range between zero and $1 million this quarter. Ford and GM have revenue of approximately $135 billion each.
Ford has EBITDA of over $12 billion for the last 12 months and GM is nearly double Ford at $23.8 billion. RIVN lost over $1.5 billion.
Speculative investors are putting the cart well ahead of the horse. They appear enamored with new entrants without contemplating established automakers with extensive financial and manufacturing means competitive electric vehicles for sale.
JNJ is Splitting Into Two
JNJ will split into two companies, separating consumer health goods from its medical devices and prescription drug businesses. The split is expected to occur within the next two years. Shares of JNJ are up about 5% on the news. We currently hold a 1.5% of JNJ in the Equity Model.
The chart below, courtesy of Charlie Bilello, compares IBM’s market cap to its buybacks and declining shares outstanding. Over the last 20 years, IBM has repurchased $132 billion worth of its shares. Its current market cap is now only $113 billion. Simply, they threw away a lot of money. Imagine what its market cap would be had they invested the $132 billion into other companies or projects that would boost earnings?
Yield Curves Are Starting to Invert
An inversion in the 2-year/10-year U.S. Treasury yield curve is frequently a precursor for a recession and accordingly well followed by investors. Other parts of the yield curve are not followed as closely but can give us hints about the future shape of the 2-year/10-year curve. For instance, the graph below shows the 20-year/30-year yield curve. It is currently inverted by about five basis points, having flattened by nearly 30bps in the last year. While not a precursor for a recession necessarily, it does warn the entire curve is flattening. The last time the 20-year/30-year curve was inverted was in the period leading up to and during the financial crisis.
November 11, 2021
Are Semiconductor Sales Peaking?
Semiconductor stocks have been on a tear lately as chip demand is incredibly strong. At the same, semiconductor manufacturers can’t produce enough chips which give them significant pricing power. SMH, a well-followed semiconductor ETF, is up 17% over the last month and 51% for the last year. The graph below warns the exuberance for the industry may be overstated. As shown, courtesy of Stouff Capital, semiconductor sales have a strong correlation with credit growth in China. Given China produces a large number of goods using chips, the relationship makes sense. Recently, China has clamped down on credit creation resulting in negative credit growth and, not surprisingly, weak economic growth. If the semi-credit relationship holds up, the graph portends semiconductor sales may appreciably underperform sales estimates for 2022. That said, the shortage of chips and demand for products using chips, such as cars, provides a decent base of demand for future sales.
Inflation, Inflation, and More Inflation!
The Dollar and Commodities Are Not Behaving Like Normal
The first graph below charts the dollar in orange and the CRB commodities index in blue. Typically a strong dollar results in weak commodity prices and vice versa. Throughout 2021, commodity prices and the dollar have a positive correlation, as circled. The second graph highlights the abnormal correlation a little better. In the Bloomberg graph, the dollar index (white) is plotted on an inverse scale to the left and Bloomberg’s commodity index to the right. The positive correlation is likely because commodity prices are increasing due to supply line factors and not traditional economic factors.
More CPI Worries
The graph below foreshadows that inflation may continue rising. It tracks the median CPI, measuring the breadth of inflation. As discussed in recent articles and commentary, the headline CPI figure everyone follows can be swayed by a few items. For instance, “shelter” represents nearly 30% of CPI. The median figure helps assess how the prices of many goods are behaving. As the graph shows, median CPI is now at highs last seen in 2008. More problematic, the 3-month change is running at levels more significant than any seen since at least 1984.
November 10, 2021
Ugly Bond Auction
Stocks and bond markets are under pressure as the Treasury Department’s 30-year auction went poorly. In the minutes prior to the auction, the bonds were trading at a yield of 1.888%. The auction went off at 1.940%, over .05% higher than expected. It appears the CPI data spooked traders causing them to back up their bids.
The Fixed Income Derivative Markets Imply Persistent Inflation
The graph below courtesy of Arbor Research shows the derivatives markets are increasingly pricing greater odds that inflation runs 3% or greater. Currently, the market implies odds of 88% that inflation will persist above 3% for two years. Even longer time periods, such as five and ten-year terms, have good odds of greater than 3% inflation for those respective periods.
CPI ran much higher than expectations as shown below. The 6.2% annual rate of inflation is the highest since October 1990. The core rate, excluding food and energy, is also higher than expected. The Fed favors, excluding volatile food and energy prices when assessing inflation. CPI, and yesterday’s PPI, will add to the pressure on the Fed to speed up the pace of taper and raise rates. Some of the pressure may come from the White House which is increasingly vocal about inflation.
PPI
Yesterday the BLS reported PPI is running at 8.6%, insinuating the prices of goods used to produce final products are rising rapidly. PPI data from China confirms the data, showing inflation for manufacturers is running hot. Since China is a massive exporter of goods, they are likely to pass some of the inflation our way. China’s PPI rose 13.5% year over year, the highest pace in over 25 years.
Is Gold a Buy?
The Fidelity graph below shows the strong correlation between real interest rates and the price of gold. 5 and 10-year real rates (inflation-adjusted) are on the bottom with an inverse y-axis on the right side. Per Jurrien Timmer (Director of Global Macro- Fidelity) -“If the Fed is ultimately forced to accept higher inflation as the cost of financial repression, then real rates could fall further, much like they did during the 1940s. This creates an opportunity for gold and silver, not to mention Bitcoin.”
Party Like Its 1999
The graph below, courtesy of the Leuthold Group, shows there are many stocks trading at extreme valuations. At 73 S&P 500 stocks, there are almost twice as many companies trading at greater than 10x sales than in 1999. The current median price to sales ratio is 3.5x versus 2x in 1999. By almost all historical valuation standards 1999 is considered the peak. Recently more and more valuation measures have been surpassing those levels.
November 9, 2021
PPI- Inflation
PPI rose 0.6% in October, rising to 8.6% year over year. Both readings met expectations. Over half of the gain came from energy prices. As shown below, PPI is running at over 3x the pre-pandemic rate. From an investment perspective, the question we face is whether or not companies can pass the rising costs on to consumers. So far, it appears they have been able to, but as stimulus dries up, and savings revert to normal, it seems less likely going forward, barring higher wages.
The NFIB small business optimism index fell to 98.2, the lowest level since March. More concerning is the forward outlook of those surveyed, in the second table below. Per the NFIB: “The NFIB Uncertainty Index decreased 7 points to 67. Owners expecting better business conditions over the next six months decreased 4 points to a net negative 37 percent. Owners have grown pessimistic about future economic conditions as this indicator has declined 17 points over the past three months to its lowest reading since November 2012.”
The survey acknowledges there is still a shortage of workers, but the survey results “hint at an easing of conditions in the labor market.” In regards to inflation, “price raising activity has reached levels not seen since the early 1980s, when prices were rising at double-digit rates.”
The first table below shows economic conditions and the political climate are primarily responsible for the poor outlook among small business owners. Per the SBA, small businesses account for nearly 65% of the private sector workforce, making this survey an essential part of our economic outlook.
Bond Auctions Today and Tomorrow
The U.S. Treasury will auction $39 billion of ten-year notes this afternoon, followed by $25 billion of 30-year bonds tomorrow. Dealers tend to be net sellers/hedgers of bonds going into auctions. As such, the prices of longer maturity bonds may be under pressure until Wednesday’s auction.
Baltic Dry is Plummeting
As shown below, the Baltic Dry Index is down 12 days in a row. The decline in the shipping price index of dry bulk ocean vessels is hopefully a harbinger that supply line disruptions are abating.
Powell Pressured to Act
Chairman Powell is up for renomination, and it does not appear to be a slam dunk as other Chairs were in the past. Rick Scott, a senator from Florida, penned a letter to Powell pressuring him to significantly change monetary policy if he wants the senator’s renomination vote. We suspect congressional pressure for the Fed to fight inflation will become more vocal as the 2022 Congressional elections near.
“Without a significant and demonstrable change in course, I will not be able to support your continued service as Chair of the Board of Governors of the Federal Reserve System beyond your current term ending February 2022. American families cannot continue down this dangerous path of rising inflation, broken supply chains, and continued workforce challenges.”
November 8, 2021
AMD Lands Meta Platforms Chip Deal
Shares of AMD are up roughly 11% in mid-day trading after announcing that Meta Platforms (Facebook) will use AMD’s Epyc processors in its data centers. According to Bloomberg, “The addition of Meta, the world’s largest social media company, to AMD’s customer list means it now supplies all the top operators of the giant computing networks that run the internet.” In addition, AMD announced its MI200 Instinct processor that will provide better competition against NVDA as AMD aims to gain market share in graphics processors. We hold a 2% position in AMD in the Equity Model.
Richard Clarida Speaks
Fed Vice Chair Richard Clarida largely mimicked Powell’s comments from last week. In regards to raising interest rates, he states: “While we are clearly a ways away from considering raising interest rates, if outlooks for inflation & unemployment turn out to be the actual outcomes… then I believe that these 3 necessary conditions for raising fed funds rate will have been met by year-end 2022″
His comments were generally dovish as widely expected. Jerome Powell spoke today but not on the topic of monetary policy. The Fed speaker schedule will be packed this week and we anticipate a wide range of thoughts on how to advance monetary policy in the near future. Some of these speakers will discuss raising rates much sooner than year-end 2022.
The graph below from Bank of America shows earnings growth is likely to decline quickly in the coming quarters. Given valuations, this is an important topic which we have been discussing. To wit, in 2022 Earnings Estimates Still Too Bullish we wrote:
“The “sugar high” of economic growth seen in the first two quarters of 2021 resulted from a massive deficit spending surge. While those activities create the “illusion” of growth by pulling forward “future” consumption, it isn’t sustainable, and profit margins will follow suit quickly.
The point here is simple, before falling victim to the “buy the market because it’s cheap based on forward-estimates” line, make sure you understand the “what” you are paying for.
Wall Street analysts are always exuberant, hoping for a continued surge in earnings in the months ahead. But such has always been the case.”
Valuations Are Soaring
As shown below, the Shiller PE ratio is now above 40, a milestone only seen for a few months in late 1999. The prior high was witnessed during the speculative markets leading to the crash of 1929. From a fundamental perspective, the risks are palatable but cash continues to flow into markets driving prices higher. Close attention to technical analysis is warranted to help establish proper risk strategies.
The Week Ahead
With the self-imposed public speaking blackout over, we look forward to hearing the thoughts of Fed members. Many members are more hawkish than Chairman Powell. As such, we expect some of them to voice concern over inflationary pressures and discuss their desire to speed up tapering and possibly start to raise rates. The strong employment report last Friday will further encourage some members to disagree with Powell regarding the timing of rate hikes. Chairman Powell will be speaking on Monday and Tuesday. We do not expect to hear anything new from him.
The market gets its next dose of inflation information, with PPI on Tuesday and CPI Wednesday. A consensus of economists expects CPI to uptick another 0.4% to 5.8% annually. JOLTS – job openings data comes out on Friday. The forecast is for a slight decline, but still at levels well above historical norms. Bond markets will be closed on Thursday for the Veterans Day Holiday.
DUK reported third-quarter earnings yesterday before the open. GAAP EPS of $1.79 was in line with expectations, while revenue of $6.95B (+3.4% YoY) missed the consensus of $7.46B. Management reported that the results were driven by continued strength in the Electric Utilities and Infrastructure segment. Leadership narrowed its FY21 adjusted EPS guidance to $5.15-$5.30, which compares favorably to the consensus of $5.21. In addition, it maintained guidance for a long-term adjusted EPS growth rate of 5%-7% through 2025. The market’s reaction is quiet so far; the stock has lost 0.5% since Wednesday’s close. We hold a 2% position in the Equity Model.
Trading COVID
Pfizer (PFE) stock is surging on news its experimental anti-viral pill for COVID reduces the odds of hospitalization or death by 89% for adults in a trial. The results are better than Merck’s new anti-viral pill. Assuming these new medications prove effective, the use of vaccines will diminish rapidly. Moderna (MRNA) is paying the price down over 20% on today’s news and 30% on the week.
The BLS Employment Report
As foreshadowed by Wednesday’s ADP report, the BLS payrolls report was strong. 531k jobs were added in October, bringing the unemployment rate down to 4.6% from 4.8%. The prior two months were revised higher by 235k jobs. Monthly average hourly earnings slipped from +0.6% to +.04%, but year-over-year earnings rose 4.9% versus 4.6%. The average workweek declined by a tenth of an hour, which is surprising given the strong demand for labor. Jerome Powell’s key figure, the labor participation rate, was unchanged from last month despite the strong job growth. During his post FOMC press conference, he mentioned on numerous occasions that he would like to see the participation rate rise before entertaining rate hikes.
The graph below shows October’s employment gains or losses by industry. As shown, leisure and hospitality added 164k jobs to the economy, accounting for almost a third of the new jobs. The government sector was the only sector to lose jobs.
As shown below, the S&P 500 has only been down in 2 of the last 17 days, a feat only accomplished one other time since 2000. If the market closes green today, it will mark the only time in 20 years it has gone 18 days with only two losing days.
Ripples In Still Water
On the surface yesterday, the most followed stock indexes gave the appearance of just another healthy market rise. The S&P was up 20 points and the NASDAQ up 1.25%. The tech sector carried the weight with semiconductor stocks, notably being the best performers. Beneath the surface, there are ripples. The heat map below shows over half the stocks in the S&P 500 were down on the day. Also of concern, the VIX volatility index rose 5%, bond yields fell sharply, and gold was up 1.75%. Divergences and poor breadth bear watching as they can signal a change in direction. Our models are alerting us to overbought conditions, so a drawdown would not be surprising.
ALB reported third-quarter earnings yesterday after the close. Adjusted EPS of $1.05 smashed expectations of $0.77, but GAAP EPS of -$3.36 missed the consensus of $0.75. Revenue of $830.6M (+11.2% YoY) beat the consensus of $764.6M, driven by a 35% YoY increase in lithium sales. The GAAP EPS miss was related to a $657.4M charge from an arbitration decision in a dispute that ALB inherited in 2015 when it acquired Rockwood Holdings. ALB plans to appeal the decision.
Management guided to FY21 revenue of $3.3B-$3.4B, well above the consensus of $3.24B, noting that it expects higher lithium pricing because of tightening market conditions. In addition, ALB raised FY21 adjusted EPS guidance to $3.85-$4.15 versus analyst expectations of $3.61. The stock is trading 4.9% higher mid-day following the strong guidance. We hold a 3% position in the Equity Model.
Profit Margin Pressure Ahead
Worker productivity fell 5%, well below estimates for a 1.5% annual decline and the largest decline since 1981. The surprising move is largely the result of sharply increasing unit labor costs which rose 8.3% annually. This data set bodes poorly for corporate profit margins unless companies can continue to pass on higher input costs and wages to their end consumers. Large declines in labor productivity often result in more inflation and vice versa. This is certainly occurring today.
OPEC Is Ignoring Biden
Despite President Biden’s request to increase oil production, OPEC will not abide. OPEC will stick to its original plan and increase production by 400k barrels a day in December. According to Bloomberg, the administration was asking for an increase of up to 800k barrels a day. The price of oil initially rose on the news but has since given back a big chunk of the gains.
The options market and necessary options hedging by dealers are driving stocks like Tesla much higher than warranted by recent news or fundamentals. Essentially, dealers that write options must purchase the underlying stock to hedge their position. The combination of aggressive call purchases, and higher prices, adds fuel to the fire as dealers must buy more and more stock to hedge.
The graph below from Sentimentrader shows net long options exposure is about 15% of total NYSE volume. Net options volume is now about 5-7x the norm before 2020. Per Sentimentrader: “Last week, the smallest traders spent 51% of their volume on buying call options to open. The largest traders tend to be more conservative, but even they focused 43% of their volume on call buying. Both are in the top 2% of all weeks since the year 2000.”
Why Are Yields Blind to Inflation?
Some investors are questioning why bond yields are not higher given inflation is running hot. The graph below, courtesy of the Leuthold Group, shows that it is quite frequent to have yields remain relatively constant with rising inflation. Inflation rates have spiked on numerous occasions, and in most cases, those instances proved transitory. The oddball is the 1970s and 1980s, where greater than 4% inflation rates were the norm.
November 3, 2021
Jerome Powell’s Press Conference
Below are some key points from Powell’s press conference-
*POWELL: FOCUS AT MEETING WAS TAPERING, NOT RAISING RATES
“Our focus is not on raising rates at this time.” He essentially danced around questions regarding future rate hikes.
Fed members see something different from traders but are flexible to adapt & change course if incoming data challenge their thesis
“The inflation that we’re seeing is really not due to tight labor markets. It’s due to bottlenecks.” He is pushing back on the idea that wage pressures are driving inflation.
Powell acknowledges language shift around “transitory” was intentional because they’re basically less sure it will be transitory
“The level of inflation we have right now is not at all consistent with price stability“
In a nutshell, the press conference was dovish. Powell will delay raising rates solely due to the employment picture. He is willing to overlook high inflation and the Fed’s “price stability” mandate to keep policy easy to meet their full employment mandate.
FOMC Statement – Taper has Begun
As is widely expected the Fed will begin to taper asset purchases this month to the tune of $15 billion a month. LINK to the statement. The redlined statement below shows the changes made to the last FOMC statement. Of note, in the second paragraph, they appear to be fading their transitory inflation point of view. They changed transitory factors to factors that are expected to be transitory. There were no Fed members dissenting support of the statement.
CVS reported third-quarter earnings this morning before the open. GAAP EPS of $1.20 missed the mark versus expectations of $1.40, but adjusted EPS of $1.97 beat expectations of $1.79. Revenue of $73.8B (+10% YoY) beat the consensus of $70.5B on the back of growth across all segments.
Leadership raised FY21 adjusted EPS guidance from the prior range of $7.70-$7.80 to $7.90-$8.00, which compares to analyst expectations of $7.79. However, they revised FY21 GAAP EPS guidance lower to $6.13-$6.23 from its prior range of $6.35-$6.45. In addition, CVS boosted FY21 revenue guidance to $286.5B-$290.3B as it noted that management expects recent strength to continue throughout the fourth quarter. The stock is up 5.6% in mid-day trading, seemingly in response to the updated guidance. We hold a 3.5% position in the Equity Model.
The Service Sector is on Fire
The ISM services survey rose to 66.7, the high water market dating back to at least the late 90s, as shown below. Prices rose to 82.9, which is also the highest level in over 20 years. The only negative in the report is the employment sub-component fell from 53 to 51.6. The graph on the right shows the recent disconnect between the index and the employment component.
Per ADP, 571k jobs were added last month, similar to the 523k added in September. The Fed has continually noted that weakness in the labor is the primary reason they are waiting to taper QE. It seems that is no longer the case. With inflation running hot and the jobs market seemingly back to normal, we suspect the Fed might be more hawkish than expected today.
Atlanta Fed Q4 Forecast
Despite a minimal amount of data, the Atlanta Fed’s fourth-quarter GDPNow forecast is out. Currently, they expect growth of 8.2%, well above last quarter’s 2% growth. We caution the prediction is based solely on limited data for the quarter and not estimates of upcoming data points. The forecast will most likely come down over the next few weeks as October data is released. Wall Street’s 4.7% consensus forecast is lower, albeit high, compared to last quarter.
Watch out for the Whales
The graph below shows one risk of holding Bitcoin or Etherium. Less than one percent of the investors own over 90% of the respective crypto coins available. If one of these “whales” were to aggressively sell, they would potentially affect the price meaningfully. However, some of the addresses in the largest 1% are holding on behalf of many individuals or entities.
November 2, 2021
Hertz and Avis Follow Tesla
Joining the surge higher in Tesla are Hertz (HTZZ) and Avis (CAR). As of noon on Tuesday, Avis is up nearly 100% on the day. Prior to Tuesday, it was already up 50% since October 1, 2021. Hertz, who is supposedly buying Tesla’s cars has doubled since late September. We say “supposedly” because of the tweet from Elon Musk below. It is worth noting two things in his tweet. First, there is no contract yet between Hertz and Tesla. Second, Hertz will be paying retail prices for the cars, not discounted prices as is customary.
PSAreported third-quarter earnings yesterday after the close. Funds From Operations (FFO) of $3.42 beat expectations of $3.22 thanks to a 20.8% YoY increase in net operating income. Revenue of $894.9M (+21.8% YoY) also beat the consensus of $858.8M. A 14% increase in same-store sales combined with a 6.2% decrease in same-store direct operating costs drove the positive results.
PSA entered an agreement during the quarter to purchase an All Storage portfolio for $1.5B. Of 56 properties acquired, 52 are in the high-growth Dallas-Fort Worth market. Management expects the acquisition to be immediately accretive to FFO/share with acceleration through 2025. The stock is trading 2% higher today following the upbeat earnings announcement. We hold a 2% position in the Equity Model.
The LPL graph below shows, thus far in 2021, the S&P 500 hit a new record high each month. If it can register another high in December it will join 2014, as the only year since at least 1928 to have all 12 months set a record high.
Bullish Bears
The market is so bullish that even the bears are bullish. The graph and commentary below show that, per the NAAIM survey of active investment professionals, bearish managers have about 50% exposure to stocks on average. That figure is tied for the largest allocation since the pandemic started.
Manufacturing and Yields
The graph below, courtesy of Brett Freeze, shows the nominal adjusted ISM manufacturing index is highly correlated with the change in 10-year Treasury yields. The ISM index tends to oscillate, portending yields are likely to fall from current levels when the ISM index trends lower. That said, if inflationary pressures remain persistent, the nominal index may stay elevated even if the ISM index declines. If so, yields are likely to stay at current levels.
November 1, 2021
Manufacturing Growth Slowing
The ISM and Markit’s PMI Manufacturing surveys fell slightly as manufacturing growth continues to moderate. The more followed ISM index, shows price pressures continue, with the prices sub-index rising from 81.2 to 85.7. Inventories rose while new orders dropped considerably from 66.7 to 59.8, in a sign that output is set to slow in the months ahead. Along the same lines, ISM output expectations are now at a 12 month low. PMI notes, “the pace of new order growth is the slowest for ten months.” In regards to inflation, they state “the latest increase was the fastest since data collection began in May 2007.”
The graph below courtesy of Nordea Markets highlights that the drop in new orders and increase in inventories portends ISM could turn below 50, signaling that a contraction in the manufacturing sector might occur in the next few months.
The yield curve is starting to invert, albeit not in a well-followed part of the curve. Currently, the 30-year yield is 1.98%, below that of the 20-year yield (2.015%). Historically, as shown below, an inversion between the 2yr and 10yr maturities (blue line is negative) signals a recession is coming in the next six months to a year. The current 20-yr/30-yr inversion is only a start. We will watch to see if more well-followed curve inversions start occurring. The most followed, 2-yr/10-yr curve still has over 100 bps before it inverts.
The event of the week will be the Fed’s FOMC policy meeting on Wednesday. It is widely expected the Fed will announce a $15 billion reduction in its schedule of asset purchases. Assuming they follow through, the market will be intently focused to see if continued inflationary pressures are moving them to speed up the taper schedule and/or begin discussions on raising interest rates sooner than expected. A taper reduction of greater than $15 billion per month will be a surprise for the markets.
The ISM manufacturing survey on Monday and Markit PMI survey on Wednesday will provide further light on manufacturing sentiment. In addition to the headline numbers, traders will be focused on the inflation, deliveries, inventories, and employment subcomponents of the surveys. On Wednesday, ADP will release their employment report followed on Friday by the BLS. While still important data, employment may now be taking a back seat to inflation in regards to the path of monetary policy.
Europe May Have To Tighten Too
Euro-area inflation rose to 4.1% the highest level in ten years, and above estimates for a gain of 3.7%. This comes as ECB President, Christine Lagarde, stated that she did not think the ECB would have to raise rates next year. Traders seem to feel differently as they are now pricing in a rate increase for later next year. Per Bloomberg: “Based on market pricing, investors are expecting the ECB to raise borrowing costs for the first time in more than a decade to bring the deposit rate to minus 0.3% within a year.” Keep in mind, rates are negative and still will be even after a rate hike.
ABBVreported third-quarter earnings this morning before the open. GAAP EPS of $1.78 came in below expectations of $2.00, but adjusted EPS of $3.33 beat expectations of $3.22. Revenue of $14.34B (+11.2% YoY) inched above expectations of $14.30B, driven by strength across the board.
Management raised FY21 GAAP EPS guidance to $6.29-$6.33 from a previous range of $6.04-$6.14. Management also raised guidance for adjusted EPS to $12.63-$12.67, which tops the consensus of $12.57. Finally, ABBV raised its quarterly dividend by 8.5% to $1.41/share, implying a forward yield of 5.14%. The stock is trading +4.1% higher mid-morning following the release. We hold a 4% position in the Equity Model.
XOMreported third-quarter earnings this morning before the open. GAAP EPS came in above estimates at $1.57 versus the consensus of $1.50. Revenue of $73.8B (+59% YoY) also beat the consensus estimate of $72.1B thanks to surging oil & gas prices.
Management expects future capital investments of $20B-$25B annually with a four-fold increase in low-carbon spending. In addition, the board authorized a share repurchase plan to start in 2022 with a ceiling of $10B in buybacks over the next one to two years. The market’s reaction is muted amidst a slight pullback in crude prices, as XOM is trading 0.6% higher mid-morning. We hold a 2% position in the Equity Model.
Consumers are in an Inflationary Bind
The quarterly Employment Cost Index rose 1.3% versus expectations for a gain of 0.9%. On a year-over-year basis, the index is up 3.7%. While the data is a little old, it points to profit margin pressures for corporations.
Personal Income fell 1% in September. Personal Consumption Expenditures rose 0.6%. It appears expenditures are rising because of inflation, not because consumers are buying more goods. This data also helps explain the recent uptick in credit card spending.
The Fed’s preferred method for gauging inflation, the PCE Price Index, rose 4.4% over the last year, the highest rate of inflation since the early 90s.
The graph below courtesy of Eric Basmajian, shows Real Disposable Income per Capita is back below the 1.8% trendline growth of 2009-2020. Simply, the stimulus is gone.
The Bank of Canada (BOC) surprised markets by ending QE abruptly and predicting they might increase interest rates as soon as April. LINK to the press release. Further, they expect a total of four rate hikes next year. Their rationale appears to be a concern that price pressures “now appear to be stronger and more persistent than expected.”
Since the announcement, Canada’s 2-year notes are up 20bps, while its 10-year notes are slightly lower in yield. The Canadian 2/10 yield curve is now 50bps, down from nearly 100bps a month ago. The BOC’s actions and large effect on its yields and yield curves seem to be partially responsible for similar trading with U.S. Treasury yields and curves. On October 8th, the UST 2/10 yield curve was 130bps. Today it stands at 108bps. Both the U.S. and Canadian yield curves appear to be warning the respective central banks may be tightening policy right into an economic slowdown. With the Fed meeting next week, equities investors should be prepared for a statement that is more hawkish than expected. This may include a quicker taper timetable and or a more specific discussion on raising rates.
House Price Increases Are Slowing
According to Case-Shiller Home Price Index, the surge in house prices may finally be slowing down. As shown below, the monthly gain in the index was only 0.08%. That compares to the last 12 months which saw gains of around 1% or higher each month. The annual gain in the index is 19.8%.
October 28, 2021
Starbucks (SBUX) Earnings
SBUX reported its fiscal fourth-quarter earnings today after the close. GAAP EPS of $1.49 beat the consensus of $0.98; however, revenue of $8.15B (+31.5% YoY) fell short of expectations of $8.2B. Global comparable store sales increased 17% versus expectations of 19%, driven mainly by the North American region where comparable sales increased 22%. International comparable sales increased 3%, but China comparable sales fell by 7% during the quarter. The stock is trading 2.9% lower in the after-hours session. We hold a 1% position in the Equity Model.
Apple (AAPL) Earnings
AAPL reported its fiscal fourth-quarter earnings today after the close. GAAP EPS of $1.24 arrived in-line with expectations, while revenue of $83.4B (+28.9% YoY) missed expectations of $84.99B. Products revenue of $65.1B missed the consensus of $68.7B, largely due to iPhone sales of $38.9B versus expectations of $41.6B. The CEO told CNBC that supply constraints would likely intensify in its fiscal first quarter, but he expects “very solid” revenue growth. The stock is down -3.9% in the after-hours trading session. We hold a 3.5% position in the Equity Model.
Amazon (AMZN) Earnings
AMZN reported third-quarter earnings today after the close. GAAP EPS of $6.12 came in well below the consensus estimate of $8.93. Revenue of $110.8B (+15.3% YoY) also missed expectations of $111.66B, with AWS sales of $11.6B missing expectations of $15.4B. In addition, operating income decreased to $4.9B versus $6.2B in the third quarter of 2020.
Management guided to sales between $130B-$140B and operating income between $0-$3B in the fourth quarter. This stacks up against operating income of $6.9B in the fourth quarter of 2020. The CEO, Andy Jassy, warned that AMZN expects to incur several billion dollars of additional costs throughout the holiday season. “It’ll be expensive for us in the short term, but it’s the right prioritization for our customers and partners”. The stock is down -4.5% in the after-hours session. We hold a 3% position in the Equity Model.
Earnings Yield Warning
The graph below, courtesy of Nautilus Capital, shows that earnings yields on the S&P 500 are at the lowest levels since the early 1980s. The lower graph and table break historical readings of the earnings yield into quadrants. As the table shows, the lowest quadrant produces minimal positive returns versus double-digit returns for the other three quadrants.
Ford (F) Earnings
F reported earnings for the third quarter of 2021 yesterday after the close. GAAP EPS of $0.45 smashed the consensus estimate of $0.21, driven by “significant increases in semiconductor availability and wholesale vehicle shipments from Q2”. Automotive revenue came in slightly above consensus at $33.2B (-4.3% YoY) versus expectations of $32.8B. Notably, F saw its North America EBIT margin improve to 10.1% from 7.6% in 3Q20.
Management increased guidance for FY21 adjusted EBIT to a range of $10.5B-$11.5B from the previous $9B-$10B. FY21 adjusted free cash flow guidance remains unchanged at $4B-$5B. F also announced that it reinstated its quarterly dividend at $0.10/share after suspending it in 2020, implying a forward yield of roughly 2.5%. The stock is trading 8.7% higher this morning following the upbeat earnings. We hold a 3% position in the Equity Model.
GDP
The good news is Q3 GDP, at 2%, is much higher than the Atlanta Fed’s 0.2% forecast. The bad news, it is decently below the consensus of economists forecast of 2.7%. Of concern, inventories added 2.1% growth to GDP. Without inventories, which in the long run contribute zero growth to GDP, GDP was flat. GDP was boosted by personal consumption expenditures (PCE) which rose 1.6%. We suspect GDP will be revised lower as PCE is likely overstating consumer economic activity. Durable goods and auto sales weighed heavily on GDP, primarily due to shortages and transportation problems. As these problems resolve themselves, GDP should benefit.
An Odd Divergence
Economists have been racking their brains for the last nine months trying to pinpoint why there are still shortages of many goods. Yesterday’s inventory data and the graph below provide a clue. Retailer inventories fell 0.2% while wholesaler inventories jumped 1.1%. The graph shows this is not just a one-month divergence but a trend existing for over a year. The most logical explanation is there are not enough truckers to deliver the goods from the wholesalers to the retailers. If this is the case we should expect wholesale inventories to stabilize, resulting in fewer orders to manufacturers. The other explanation is that retailers are purposely ordering less, keeping shelves semi-stocked, thus allowing them to charge more and pass higher costs and wages on to consumers.
Q3 GDP Report Warning From the Atlanta Fed
A consensus of Wall Street economists expects today’s third-quarter GDP to increase by +2.7%. The Atlanta Fed’s most recent forecast is well shy of that at +0.2%. One of the main reasons for the Atlanta Fed’s weak forecast is Real Final Sales. The Atlanta Fed expects this large contributor to GDP to drop 1.6%. As the graph shows, every time Real Final Sales has fallen below zero since the early 1950s, a recession has occurred.
October 27, 2021
Visa (V) Earnings
V reported its fiscal fourth-quarter earnings yesterday after the close. GAAP EPS of $1.65 easily beat the consensus of $1.55. Revenue of $6.56B (+28.6% YoY) came in slightly above the consensus of $6.51B. Payments volume growth also topped estimates, coming in at +17% YoY versus expectations of +15% YoY. Cross-border payments volume rose +38% YoY versus expectations of +31.7% YoY; however, management’s outlook is not as rosy.
The CFO noted that revenue growth significantly depends on the pace of cross-border travel recovery, and V does not expect cross-border travel to reach 2019 levels until mid-2023. The outlook is weighing on performance as the stock is down 5.2% in mid-day trading. We hold a 1% position in the Equity Model.
Advanced Micro Devices (AMD) Earnings
AMD reported third-quarter earnings yesterday after the close. GAAP EPS of $0.75 beat the consensus of $0.61. Revenue also came in above consensus at $4.3B (+53.9% YoY) compared to expectations of $4.1B. According to the CEO, the growth is being driven by server chips, with data center sales more than doubling YoY.
Guidance for Q4 revenue was set to $4.4B-$4.6B, which blows analyst forecasts out of the water. As a result, management increased guidance for FY21 revenue growth to 65% from 60%. The stock is up 1.2% in mid-day trading. We hold a 2% position in the Equity Model.
The Yield Curve is Flattening
The table below shows the mid-day change in U.S. Treasury yields. Note the distinct flattening of the yield curve as short-term yields rise while long-term yields fall. For instance, 30-year bonds are down nearly 7 bps, while the 3-year note is up 3.5bps. Bond traders are pricing in future Fed rate hikes, while at the same time understanding that tapering QE and rate hikes will slow growth and inflation, to the benefit of longer maturity bonds. The 20/30 year curve will most likely be the first part of the curve to invert. The yield difference between those two maturities is only 1.7bps.
Microsoft (MSFT) Earnings
MSFT reported its fiscal first-quarter earnings yesterday after the close. GAAP EPS was $2.71, which beat the consensus of $2.07. Revenue also came in above consensus, at $45.3B (+21.8% YoY) versus an expected $44B. The beat was driven by a 50% YoY increase in Azure and other cloud revenue.
Management offered guidance for Q2 revenue above the consensus at $50.15B-$51.05B versus estimates of $48.92B. The stock is trading 1.7% higher in the pre-market session following the results. We hold a 2.5% position in the Equity Model.
Google (GOOG) Earnings
GOOG reported third-quarter earnings yesterday after the close. GAAP EPS of $27.99 topped the consensus of $23.32. Revenue of $65.1B (+41% YoY) also beat estimates of $63.2B thanks to impressive advertising revenues. This was GOOG’s largest quarterly revenue gain in 14 years, and the growth led to an operating margin increase of 8%.
Management included a caveat with the impressive results, noting: “Given the gradual recovery in results through the back half of 2020, the benefit from lapping prior year performance diminished in Q3 versus Q2 and will diminish further in Q4”. The market’s reaction to the release is muted thus far. We hold a 2.5% position in the Equity Model.
Labor Market Tightness
Per Goldman Sachs: The Conference Board’s labor differential — the “difference between the percent of respondents saying jobs are plentiful and those saying jobs are hard to get— increased by 1.5pt to 45.0, the highest level since 2000.”
This data provides even more evidence there are more job openings than those looking for jobs. Again, another sign of a healthy labor market. A shortage of candidates provides employees leverage to demand higher wages. This doesn’t bode well for the profit margins of companies that rely on large labor forces.
XLE is Neglected
The commentary and graphs below show that both ESG investors and traditional investors are underweighting the energy sector. Since January, XLE (energy) is up 58%, almost triple the S&P 500 which is up 21%. If such outperformance continues, we suspect investors will eventually gravitate toward the energy sector and try to capture the outperformance. The graph and commentary is courtesy of Callum Thomas and @mikezaccardi
October 26, 2021
Waste Management (WM) Earnings
WM reported third quarter GAAP EPS just short of the consensus at $1.28 versus an expected $1.33. Revenue of $4.7B (+21% YoY) topped expectations of $4.55B, driven by volume growth and increased yield. Management raised guidance for FY21 revenue growth to 17%-17.5% from 15.5%-16% previously. The new guidance is above the consensus of 16% YoY. Accelerating cost inflation was mentioned as a headwind, but the company remains on track to meet its full year targets according to the CEO. The stock is down 1.7% this morning following the release. We hold a 1% position in the Equity Model.
Raytheon Technologies (RTX) Earnings
RTX reported third quarter GAAP EPS of $0.93, which inched above the consensus of $0.91. Revenue of $16.2B (+8.1% YoY) came in short of expectations of $16.36B. Guidance for FY21 revenue was set at $64.5B from a prior range of $64.4B-$65.4B. This is slightly below the consensus of $65.2B. Guidance for FY21 adjusted EPS was raised to $4.10-$4.20 from $3.85-$4.00 previously; the consensus is $4.06. Management commented that a rebound in air travel was the impetus for raising earnings guidance. Despite the upbeat guidance, the stock is trading 2.5% lower this morning due to gloomy forecasts from its competitor, Lockheed Martin (LMT). We hold a 1.5% position in the Equity Model.
More Tesla
Yesterday we noted that Tesla’s market cap increased by approximately $100 billion. To put the gain in context, consider yesterday’s increase in market cap is worth about 1.5x the total value of Ford and about half of the entire domestic auto industry. Also interesting, Elon Musk added nearly $30 billion of personal wealth yesterday. He is now supposedly worth more than Exxon.
The graph below shows Tesla is valued at 42% of the entire auto industry despite having a very small fraction of total sales/revenue. Ford and GM recently reported annual sales of $137 and $139 billion respectively. Tesla’s latest report shows $46 billion in sales. Simply, the market is betting heavily that TSLA will be the dominant leader in auto sales over the next five to ten years. Anything short of 50% market share will likely be a disappointment for shareholders. If you do not buy into the prospects we offer caution. Tesla is one of the hottest stocks in the market, so selling or shorting the company may be painful in the short run.
Consumers Are Fretting
The Langer Consumer Comfort Index is a high-frequency confidence index. While lesser followed than the University of Michigan survey or the Conference Board’s consumer survey, it provides another data set to assess consumer attitudes. Given personal consumption traditionally accounts for two-thirds of economic growth, this measure is essential to follow.
In its most recent October 21st report, Langer notes: “Consumer sentiment continued down this week, dropping to nearly a seven-month low as Americans’ assessments of their personal finances and the buying climate extended their largest declines since early in the coronavirus pandemic.”
At 49.7, the Index is well above its March 2020 lows of 35 but a ways off its pre-pandemic highs near 70. For context, the Langer Index looks similar to the Conference Board Survey, sitting between post-pandemic highs and lows. On the other hand, the University of Michigan Sentiment Index is now at its lowest level since the pandemic and the lowest level in ten years. The importance of consumer confidence is not just economic. As their graph below shows, there is a strong correlation between the changes in stocks prices and consumers’ sentiment. Recently, stocks have soared despite weakening confidence.
October 25, 2021
*** There will be no Three Minutes on Markets Videos this week as we are refurbishing our recording studio. We expect to be back next Monday.
Tesla Surpassing Facebook
Tesla, rising over 10% this morning, overtook Facebook, becoming the ninth-largest company by market cap. The news propelling it to a market cap of just under $1 trillion is that hertz will buy 100k cars. The order is worth over $4 billion. Tesla’s market cap is up approximately $60 billion on the order. To put that in context, Ford’s market cap is $63 billion.
What If Inflation Isn’t Transitory?
It seems over the past few weeks more and more in the media are asking what happens if inflation becomes isn’t transitory. What if it is persistent. Mohamed El-Erian has been among the most outspoken on the topic. This morning he writes a concerning editorial in Bloomberg warning that underestimating inflation carries dire risks. To wit: “The longer this persists, the greater the risk of a historic policy error whose negative implications could last for years and extend well beyond the U.S.”
Oil In Backwardation
The table below shows the CME futures prices for crude oil. Typically the future contract prices of oil increase over time. Such a price curve is called contango. Currently, the front contract December is trading at $84.81 and the prices decline through next year. This somewhat unique circumstance for oil is called backwardation. It is a signal that there is strong demand for crude oil today but traders do not expect demand to be as heavy in the future. This indicator portends the supply/demand imbalance for crude oil will normalize over the next six to nine months.
A host of regional manufacturing indexes this week provide a first look at economic activity in October. Also of interest will be Thursday’s GDP report. Current estimates are for 2.5% growth in the third quarter. As we noted earlier this week, the Atlanta Fed forecasts 0.5% growth. Also on Thursday will be PCE prices, the Fed’s favorite gauge of inflation expectations.
The Fed meets on Tuesday and Wednesday of next week. Accordingly, they should be relatively quiet this week as they enter their self-imposed media blackout period.
Earnings will continue to dominate the news wires. As the first table below, from RIAPro, shows, ten of the companies we hold in the Equity model report earnings this week.
Less Stimulus, More Borrowing
The graph below, courtesy of Arbor Research, shows that consumer interest in borrowing is increasing. Some of the interest is likely from borrowers needing extra funds to replace the multiple stimulus programs from the last year and a half. It is also worth noting that consumers are also likely being pinched by higher prices and some are needing to borrow to make ends meet.
In a speech this morning, Jerome Powell said “its time to taper” but not raise rates. He expects to complete tapering by mid-2022. Powell now views “higher inflation” as the biggest risk. Equity markets are trading weaker as he finally acknowledges inflation is more persistent than “transitory.” Bond yields are falling as he implies the Fed should be more hawkish if inflation does not abate.
Flattening Yield Curve
5-year implied inflation expectations are up over 40 basis points (bps) since October 1st. They now stand at a 15+ year high of 2.94%. While inflation expectations rise, the yield curve is flattening. In this case, short maturity bonds are rising in yield much more than longer maturity bonds. The graphs below show what has happened to bond yields since the inflation expectations last peaked on May 18th. As we show the 30-year bond is 26 bps lower since then, while the 2-year note is 26 bps higher. As a result, the 2/30 yield curve has flattened 52 bps over the period.
Our portfolios are set up for the yield curve flattening. The portfolio’s largest bond holding is TLT with a duration of 20 years. The benchmark, AGG, has a duration of 8 years. The models are also not fully vested in the fixed income sleeves to further protect against higher yields.
The graph below, courtesy of Bank of America, shows a recent uptick in credit card spending among those making $50,000 a year or less. It appears consumers, especially those at the lower end of the income scale, are increasingly relying on credit to make ends meet as inflation rises quicker than earnings.
Quantifying The Cost of BITO
Yesterday we pointed out the new Bitcoin ETF, $BITO must roll futures contracts from month to month. We estimate the annual cost based on the current roll from October to November is 15% or even greater. The problem with our estimate is that it does not take into account how the futures curve may change. The graph below, courtesy of J.P. Morgan, provides some historical context to assess the roll cost. It shows the annual cost of rolling the first month to the second-month contract, as well as the second month to the fourth month. As the graph shows the average cost is around 10% annualized, but as the curve shifts the cost or benefit can vary significantly. The cost of rolling futures, ultimately paid by the ETF holder, is not a reason to avoid BITO, but it is a factor worth considering especially if you are planning to hold it for a long period.
Powell Speaks
Fed Chairman Jerome Powell is expected to speak at 11:00 am ET today. He has been quiet on the topic of tapering QE so it will be interesting to see if he uses the opportunity to lay out his thoughts on the topic. In particular, will he affirm the $15bln/month pace of reduction that was laid out in the recent FOMC minutes, or push for something either more aggressive or conservative? Also, will he discuss the possibility of increasing interest rates next year?
October 21, 2021
Federal Reserve Trading Policy
With the cat out of the bag, and many high-ranking Fed officials caught actively trading the markets with inside knowledge of what the Fed would say and/or do, the Fed is finally taking action. Per the press release below, Fed members are now subject to a number of strict rules that will greatly limit their ability to trade markets.
Philly Fed
The Philadelphia Fed Manufacturing index came in below expectations at 23.8 down from 30.7 in October. That said, the details were not as bad as the headline. Employment, new orders, and the 6-month outlook for capital spending all rose.
The index is composed of indicators that tend to lag economic activity and ones that lead economic activity. The graph below, courtesy of Nordea, shows how the difference between the leading and lagging indicators leads the broader index by about 10 months. As shown, the leading-lagging differential portends the index will fall back into economic contraction in the coming months. This chart affirms the sharp deceleration in growth currently being forecasted by the Atlanta Fed GDPNow.
A few subscribers have asked our thoughts on trading the new Bitcoin ETF (BITO) as a substitute for Bitcoin. The biggest drawback in our opinion is the cost structure of the ETF is not as friendly as owning Bitcoin for two reasons. First, the ETF’s management fee is 0.95%. Second, and this is a flaw with many commodity ETFs, holders pay to “roll” contracts. BITO is currently fully invested in the October Bitcoin futures contract priced at 67,500. At some point soon they will have to buy the November contract and sell October. Currently, the November contract is trading at a premium of 1.27% to the October price. If the futures curve remains steep, holders of BITO will pay 15% or more over the course of the year to roll contracts. Including the management fee, BITO could underperform Bitcoin by nearly 20%. Obviously, that estimate will change based on the shape of the futures curve. Click HERE for Bitcoin futures prices for current and out months.
Oil CAPEX Declining
On Tuesday we shared a WSJ article that discusses the lack of investment in energy exploration (capex). We just stumbled upon the graph below which shows the problem has been brewing for about five years. Political and economic incentives favor green energy, leading us to believe that unless oil prices stay at current levels or higher and can sustain such levels, there is little reason to expect investment to pick up.
October 20, 2021
Verizon (VZ) Earnings
VZ reported third-quarter GAAP EPS well above consensus at $1.55 versus expectations of $1.35. Revenue was $32.9B (+4.4% YoY), which missed estimates of $33.2B. Wireless retail net adds surprised to the upside with 699K net adds versus 566K expected.
Guidance for FY21 adjusted EPS was raised to $5.35-$5.40 from $5.25-$5.35. The new range is well above the consensus estimate of $5.29. Management also narrowed FY21 guidance to a 4% increase in total wireless revenue from the previous range of 3.5%-4%. VZ is trading 2.1% higher this morning following the results. We hold a 1.5% position in the Equity Model.
NextEra Energy (NEE) Earnings
NEE reported third-quarter GAAP EPS of $0.23, which missed analyst estimates of $0.71. Adjusted EPS did beat estimates, however, at $0.71 versus expectations of $0.67. Revenue came in short of consensus at $4.4B (-8.8% YoY) versus expectations of $5.4B.
Guidance for FY21 adjusted EPS remains unchanged at $2.40-$2.54, with the mid-point slightly below the consensus of $2.52. NEE expects adjusted EPS growth of 6%-8% from FY21 in 2022 and 2023. NEE is trading 2.3% higher this morning after the release. We hold a 2% position in the Equity Model.
Abbott Labs (ABT) Earnings
ABT reported third-quarter GAAP EPS of $1.17, which beat analyst estimates of $0.67. Revenue of $10.9B (+22.8% YoY) also beat the consensus of $9.56B. Revenue growth was driven, in part, by strong results in COVID-19 testing products. Excluding COVID-19 related testing products, organic sales grew 11.7% versus the third quarter of 2019.
Guidance for FY21 GAAP EPS was set to $3.55-$3.65, while FY21 adjusted EPS guidance was boosted to $5.00-$5.10 from a prior range of $4.30-$4.50. This compares to a consensus estimate of $4.45. Following the positive results and guidance, the stock is trading 3.9% higher this morning. We hold a 2% position in the Equity Model.
The Atlanta Fed GDPNow forecast for Q3 economic growth was revised lower to 0.5%, down from 1.2%. The chart below shows how each major subcomponent contributed to the forecast. Increasing private inventories, adding 2.1%, is keeping the GDP forecast above zero. Typically accounting for two-thirds of GDP, Consumer Spending is only contributing 0.31% to the forecast, well off the 2.70% rate in August.
Industrial Production
In Monday’s Industrial Production report, Industrial Production fell 1.3%, and the lesser followed capacity utilization fell from 76.4% to 75.2%. The data is a little surprising given the shortage of goods available to the public. At first blush, one would think factories would be running at maximum capacity and production rising rapidly. Unfortunately, manufacturers face the same problem as their consumers, a shortage of goods needed to produce products. For example, it is well documented most auto manufacturers are cutting production due to a chip shortage. The graph below shows capacity utilization for the auto industry is at recession levels of 55%. It was running between 70-80% before the pandemic and had prior peaks over 90%. Auto manufacturing contributes about 3% to GDP.
October 19, 2021
Netflix (NFLX) Earnings
NFLX reported third quarter earnings today after the close. GAAP EPS came in above consensus at $3.19 versus $2.56 expected. Revenue of $7.5B (+16.1% YoY) was in line with expectations. Global streaming paid net additions blew management expectations out of the water, coming in at 4.38M versus guidance of 1.54M.
Management offered guidance for 4Q21 revenue of $7.71B, slightly above the consensus of $7.68B. Guidance for EPS was less positive, however, at $0.80 versus expectations of $1.13. Finally, management offered above-consensus guidance for Q4 global streaming paid net additions of 8.5M versus 8.3M expected. We hold a 2% position in the Equity Model.
Johnson & Johnson (JNJ) Earnings
JNJ reported third quarter earnings today before the open. GAAP EPS of $1.37 missed the consensus estimate of $2.17. However, non-GAAP EPS of $2.60 beat expectations of $2.35. Revenue of $23.3B (+10.7% YoY) missed the consensus of $23.7B. According to the CFO, the revenue miss was just a matter of timing of shipments in the COVID vaccine and medical devices businesses. That revenue should be made up for in Q4 results.
JNJ increased guidance for FY21 revenue at the low end to a range of $92.8B-$93.3B from $92.5B-$93.3B, but guidance remains below the consensus estimate of $93.97B. Guidance was also boosted for FY21 adjusted EPS to $9.77-$9.82 from $9.50-$9.60 previously. This is well above the consensus estimate of $9.64. The stock is trading 2.6% higher on the results. We hold a 1.5% position in the Equity Model.
Proctor & Gamble (PG) Earnings
PG reported third quarter earnings this morning before the open. GAAP EPS came in slightly above expectations, at $1.61 (-1% YoY) versus the consensus of $1.59. Revenue of $20.3B (+5.3% YoY) also beat expectations of $19.9B. Organic sales growth of +4% YoY was driven by increased volume (+2%), increased pricing (+1%), and positive sales mix (+1%). Gross margin, however, decreased by 3.7% YoY due to increased commodity and transportation costs as well as less profitable sales mix.
PG is planning to raise prices on certain beauty, oral care, and grooming products to offset increasing costs. According to the Wall Street Journal, “‘We do not anticipate any easing of costs,’ P&G Finance Chief Andre Schulten said in an interview. ‘We continue to see increases week after week, though at a slower pace’”. The article continues, “Despite the higher expenses, P&G maintained its sales and profit outlooks for the year, saying increased revenue and cost reductions will enable the company to stay on track”. The stock is trading roughly 2% lower this morning in light of the margin concerns. We hold a 2% position in the Equity Model.
For more on how cost pressures are affecting PG and many other companies, check out this article from the Washington Post.
“Despite varying perceptions, there were clear fundamental and technical warnings preceding the crash that were detected by a few investors. For the rest, the market euphoria raging at the time blinded them to what in hindsight seemed obvious.”
The quote comes from an article we wrote on the stock market crash of 1987. Today, being the 34th anniversary of the crash of 1987, we revisit some important lessons from that era. Read The Article.
Will Higher Oil Prices Become The Norm?
The Wall Street Journal ran an article discussing a growing investment deficiency into traditional and renewable energy sources. As a result oil prices may stay high until the industry closes the gap.
Per the article:
“Global oil and gas exploration spending, excluding shale, averaged about $100 billion a year from 2010 to 2015, but dropped to an average of around $50 billion in the years that followed after a crash in crude prices, according to Rystad Energy. Total global oil and gas investment this year will be down about 26% from pre-pandemic levels to $356 billion, the IEA said Wednesday.”
Green investments are not growing quickly enough to offset reduced CAPEX in the energy industry. Per the article:
To meet global energy demand, as well as climate aspirations, investments in clean energy would need to grow from around $1.1 trillion this year to $3.4 trillion a year until 2030, the Paris-based agency found. Investment would advance technology, transmission, and storage, among other things.
The bottom line: “The world isn’t investing enough to meet its future energy needs, and uncertainties over policies and demand trajectories create a strong risk of a volatile period ahead for energy markets,” the IEA report said.
Equity Model Earnings Announcements
Q3 earnings announcements for the RIA Pro equity model start this morning and continue on Wednesday as follows:
Tuesday (October 19th)
JNJ – Before Open
NFLX – After Close
PG – Before Open
Wednesday (October 20th)
ABT – Before Open
NEE – Before Open
VZ – Before Open
Labor Market
Over the last six months, the Fed has been dragging its feet and delaying the inevitable tapering of QE due to perceived weakness in the labor market. The graph below shows the unemployment rate less those labeled “quitters” is near 20-year lows. Quitters are those that left their jobs voluntarily and, in theory, are in search of better or higher-paying jobs. The current quit rate at 2.9% is the highest in its 20-year history. A high quit rate is a signal of labor market strength. Between 5.4% inflation and the graph below, is it any wonder the market is starting to think the Fed is behind the eight ball in tightening?
As shown below China’s economic growth rate for the third quarter was negligible at +0.2%, bringing the annual growth rate to just 4.9%. While still high, the annual rate is down from 7.9% last quarter. China’s economic slowdown bears watching as they are the marginal driver of global economic growth.
Equities are recently showing a little hesitation as investors gear up for QE in November. The bond market has been a lot more vocal about more hawkish Fed policy and the implications for growth. Over the last 5 months, as shown below, the Treasury yield curve (30yr-5yr) has collapsed by three-quarters of a percent. Over the last week or two, the rate of flattening picked up markedly.
A yield curve flattening trade should not be surprising. In Taper is Coming, Got Bonds? we wrote: “The yield curve and yield graphs look similar. Short-term yields were relatively constant during QE while long-term yields rose. In all three QE examples, the yield curve quickly flattened after QE ended.” The graph below, from the article, shows how the 10yr-2yr yield curve fell rapidly after the three prior episodes of QE ended.
The Week Ahead
We take a bit of a break this week after last week’s full calendar of important economic data. On the docket is Industrial Production on Monday, Housing and Building Permits on Tuesday, and Jobless Claims on Thursday.
More important for the markets this week will be Fed speeches and earnings. Recently Fed members have become increasingly vocal about their concern for the recent rise in inflation overstaying its welcome. Last week Bostic led the charge saying “inflation is broadening, not transitory.” If others use similar rhetoric, we will see the market continue to price in a quicker pace of QE tapering and rate hikes coming sooner than previously expected.
This is will be the first of a few important weeks for corporate earnings as shown below.
Vacant Offices
The graph below, courtesy of Jim Bianco, shows that a majority of employees in eight major cities are still not going back to their offices. While the number of employees going back to their offices will rise we think it’s likely the number falls well short of pre-pandemic levels. Per Jim Bianco “What a year at home did was open our eyes to what we are were capable of outside the office and what it was really like in the office. Few were ready to do this pre-pandemic.”
GS reported earnings for the third quarter of 2021 this morning. GAAP EPS of $14.93 (+66% YoY) easily topped the consensus of $10.04, driven by impressive revenue growth across segments. Revenue came in well above consensus at $13.6B (+26.3% YoY) versus expectations of $11.6B for the quarter. The stock is up +2.6% mid-day on the back of the strong results. We hold a 2% position in the Equity Model.
Inflation Concerns Weigh on Sentiment
The October University of Michigan consumer sentiment survey came in weak at 71.4 versus a consensus estimate of 74. The result, which fell from 72.8 in September, registered as the second-lowest outcome since 2011. The chart below, courtesy of Bloomberg, shows year-ahead inflation expectations based on the survey have risen to 4.8%, their highest point in 2021.
Retail Sales Surprise
September retail sales surprised to the upside this morning at +0.7% MoM versus estimates of -0.1%. Retail sales ex-vehicles grew +0.8% MoM versus +0.4% expected, and ex-vehicles and gas rose in line with expectations of +0.7%.
Incorporating Wednesday’s September CPI release, real growth in retail sales for September was only +0.3% MoM. Thus, over half of the nominal growth in September came from rising prices. Treasury yields are moving higher following the release, reflecting the market’s increasing expectations for taper.
On a monthly basis, the Cleveland Fed puts out the 16% trimmed mean inflation rate. Their modified inflation rate trims price change outliers, both high and low, from CPI. Currently, as shown below, the index is just short of the 2008 highs. At that time oil was nearly $150 a barrel and up well over 100% from where it was a year earlier. Take away that short burst higher and the trimmed measure is at its highest level since the late ’80s. The takeaway from this inflation gauge is that the number of goods driving higher inflation is broadening and not just confined anymore to a few extremes like used cars and gasoline.
EPS and Returns
The graph below, courtesy of Fidelity, shows the correlation between S&P earnings growth (EPS – X-axis) and price performance on the Y-axis. The EPS data is broken into 8 tiers and color-coded. Each color, or specific range of EPS, has a trend line drawn through it. In general returns and EPS are positively correlated as should be expected. There are exceptions. In particular, there seems to be no correlation when EPS is very strong -on the right side of the graph. This is likely due to strong but unsustainable earnings growth coming out of recessions. Conversely, the red circles on the far left are likely periods at market bottoms where prices rose in expectations of a rebound in EPS.
October 14, 2021
Economic Data
Initial Jobless Claims had another nice decline and now sits at +293k, the lowest level since the Pandemic began. The last two weekly claims reports bode well for the upcoming unemployment report. Unlike CPI, PPI was generally weaker than expectations. The headline number rose 0.5% versus +.07% last month. However, the year-over-year number was +8.6%, lower than expectations for +8.7% but above last month’s +8.3%. Core PPI, excluding food and energy, rose 6.8% on an annual basis.
The latest Fed minutes show that tapering of QE purchases is likely to begin in November. It appears they will reduce purchases by $15 billion a month which should eliminate this round of QE by July 2022. $15 billion now serves as a benchmark. Any changes to that amount will help us gauge if they are becoming more aggressive or conservative. There are some members that prefer a faster pace. Per the minutes- “Several participants indicated that they preferred to proceed with a more rapid moderation of purchases than described in the illustrative examples.”
#FedGrammarMatters
We often note how the Fed uses language at times to complicate matters and put an understanding of their policies and forecasts beyond the reach of many non-economics or finance professionals. Fed members also use vague terminology, allowing them to be technically correct through a wide range of outcomes. In our latest article, What Causes “Transitory” Inflation to Become “Persistent”? we write: “Transitory is a vague term. It can mean minutes or hours or infer years or even decades. 400+ economics Ph. D.s are not dumb. They likely chose the word because it has no clear-cut definition.”
The Fed itself supports our notion of the high-level language they use. In a recent article, the Fed states: “Hernández-Murillo and Shell (2014) showed that the complexity of the language used in the FOMC statement increased towards the end of Bernanke’s tenure to a reading grade level of 20 to 21, equivalent to a least a doctoral degree level of education. The circles in Figure 2 illustrate that since then the Flesch-Kincaid grade level for the FOMC statement language gradually declined under Yellen and has averaged between grades 16-17 thus far under Chair Powell, equivalent to a bachelor’s or master’s degree level of education.“
The following graph accompanies the article. In short, Fed communications remain technical. Unless you hold a college degree or possibly a master’s, Fed communication may be going over your head. In normal times this may not matter. With inflation running hot and the word stagflation being used regularly, the Fed may want to simplify their language or risk creating even more confusion, fear, and behaviors that can foster even more inflation.
October 13, 2021
JPM Earnings
JPM reported earnings for the third quarter of 2021 this morning. GAAP EPS of $3.74 came in well above the consensus of $3.00, boosted by a $2.1B release of loan loss reserves. Revenue of $29.6B (+1.7% YoY) was in line with estimates, and guidance FY21 for interest income was unchanged at $52.5B. Average loans fell 2% YoY in the Consumer & Community Banking segment and 7% YoY in the Commercial Banking segment; however, they rose 5% YoY on a firm-wide basis, driven by the Assets & Wealth Management segment. The stock is trading 1.7% lower this morning following the earnings release. We hold a 2% position in the Equity Model.
The Market Thinks They Will Raise Rates Sooner
Over the last few weeks, Fed Funds futures have been pricing in greater odds of a rate hike coming sooner than was previously expected. For instance, the June 2022 contract now implies about a 25% chance of a tightening by June. The odds were near zero in mid-September. The December 2022 contract implies a 100% chance of a 25bps rate hike and a 50% chance of a second hike by the end of the year.
CPI came in slightly higher than expectations. The monthly rate of price increases was 0.4%, 0.1% higher than last month. The year-over-year rate, at 5.4%, is also a tad above expectations. The core monthly and annual rates, excluding food and energy, were in line with consensus.
It is important to note that some inflation is the result of deflation or lower prices this time last year. While “base effects” are rapidly lessening, they are still in play. Per Ben Casselman of the N.Y. Times- “Base effects” — the impact of the drop in prices earlier in the pandemic — are still playing some role in lifting year-over-year inflation. If prices had kept rising at their pre-Covid rate last year, September inflation would have been 5% instead of 5.4%.”
Chaikin is Providing a Warning
The graph below shows the S&P 500 with the Chaikin Money Flow indicator below it. The indicator looks back over 20 days and multiplies the daily volume with where the market closes within each day’s trading range. The multiplier is positive when the S&P closes in the upper half of a day’s trading range. Where the market closes in relation to the high or low is multiplied by the volume. High volume and a close at the high or low for the day will produce a strong signal.
Technical analysts use the indicator to help determine if institutions are accumulating or distributing. A green reading (above zero) signals accumulation as it is believed institutions tend to buy late in days. The strength of the recent string of red days signals early strength is followed by late-day weakness. This is a sign of institutional distribution (selling). The Chaikin indicator has not been this deeply negative since 2018.
“Broadening, Not Transitory”
Atlanta Fed President Bostic went where no Fed member has gone since the Pandemic. He stated, “U.S. inflation is broadening, not transitory.” This appears to be the first time a Fed member is voicing concern that higher inflation is no longer transitory. If other Fed members join him in this view, it might speed up the tapering process and bring forward the date of the first rate hike.
Humorously, he started his speech with disdain for the use of “transitory” to describe the recent bout of inflation. To wit: “You’ll notice I brought a prop to the lectern. It’s a jar with the word “transitory” written on it. This has become a swear word to my staff and me over the past few months. Say “transitory” and you have to put a dollar in the jar.”
October 12, 2021
JOLTs
Per the JOLTs report, the number of job openings fell for the first time since April. The number of openings in August was 10.43 million versus expectations of over 11 million. This may be a signal the labor market is getting better, or at least less bad, at matching workers with openings. The quits rate rose to a record 2.9% of the workforce. Typically workers quit jobs when they have confidence in finding a better, higher-paying job. Prior to Covid, the quit rate was around 2.2%.
As shown below the number of openings is still well above normal levels. The second graph below, the Beveridge Curve, highlights the anomaly. At the current unemployment rate of 5.2%, we should expect a job openings rate of about half of what it is. The million-dollar question is whether employers truly have as many job openings as advertised or are there too many unemployed workers either not trained for certain jobs or not willing to accept offered wages.
As we show below circled in red, the 50dma is turning lower for only the second time since the market rebounded in April of 2020. In late October and early November of last year, the 50dma turned lower for six days on a relatively steep 7.5% decline. The current market decline causing the 50dma to fall is only a 4% decline but its duration is almost twice as long as the prior one.
Used Car Prices En Fuego
After a brief rest bit, used car prices rose again in September back to all-time highs as shown in the Manheim Used Vehicle Value Index below. The accompanying report notes: “According to Cox Automotive estimates, total used vehicle sales were down 13% year-over-year in September.” Prices rising with sales falling clearly points to a lack of supply.
Per the report: “Using a rolling seven-day estimate of used retail days’ supply based on vAuto data, we see that used retail supply peaked at 114 days on April 8, 2020. Normal used retail supply is about 44 days’ supply. It ended September at 37 days, which is below normal levels. We estimate that wholesale supply peaked at 149 days on April 9, 2020, when normal supply is 23. It ended September at 18 days.”
October 11, 2021
Staples Getting Historically Cheap
In last Friday’s Technical Value Scorecard in RIA Pro we discussed how cheap the consumer staples sector was getting. To wit: “However, staples are nearly three standard deviations below its 50dma, arguing for a bounce in the coming days.”
SentimentTrader follows up our work with a much longer-term view. As shown below, staples, at about 6% of the S&P 500, have the lowest weighting in the S&P 500 since the tech boom in late 1999. In the year 2000 when that bubble popped, staples (XLP) ended the year up 42%. The S&P was down 10% and the technology sector (XLK) was down over 40%.
Buckle up! This is a big week for key economic data. The JOLTs report on Tuesday will provide more color on the labor market and specifically if job openings continue to at record levels. Wednesday features CPI and the Fed minutes from their September meeting. Given the importance of inflation to the Fed, CPI will help them further hone in on how to taper QE, in regards to amounts and timing. More inflation data follows Thursday with PPI. Retail Sales and the University of Michigan Consumer Sentiment Survey come out on Friday.
Also on tap are the 10 and 30-year Treasury auctions on Tuesday and Wednesday respectively. It will be interesting to see if demand is strong given the recent backup in yields.
If you crave more information, have no fear, earnings for the major banks start on Wednesday with JPM. Many of the largest banks follow them on Thursday. Most other companies will release earnings over the coming six weeks. Beyond earnings and revenues, investors will be paying close attention to forward guidance, in particular how inflation is affecting their bottom line.
Dividends over Oil Production
Last Friday we wrote how oil rig counts were rising slower than is typical considering the current price of oil. Another consideration is the transition to cleaner forms of energy. As Reuters writes below, companies like Occidental are not clamoring to increase production.
(Reuters) – U.S. oil and gas producer Occidental (OXY.N) wants to raise margins and re-establish dividend payments for its shareholders rather than focus on growing its production volumes, Chief Executive Vicki A. Hollub said on Thursday.
Oil companies can best contribute to the energy transition by producing just enough oil to meet demand in a way that is more efficient and produces fewer emissions, the CEO said.
“We don’t see that in 2022 and beyond that we need to grow significantly,” Hollub said at an online event by the Energy Intelligence Forum.
“Our growth in the period, and maybe over the next ten years, will more be to reestablish dividend and grow that dividend”.
Risk/Reward Measures show Energy and Financials stretched.
October 8, 2021
Payrolls Report
The BLS Jobs report was weaker than expected, with job growth of 194k. Expectations were for a gain of between 475k and 500k jobs. The BLS revised the prior month higher to 366k from 235k. The unemployment rate did fall from 5.1 to 4.8%, however, it was in part due to people dropping out of the workforce. 183k people left the workforce causing the participation rate to fall from 61.7 to 61.6%. With the number of job openings so high and jobless benefits ending we find it surprising people are leaving the workforce. Also interesting was temporary help fell slightly. With so many job openings one would expect many companies to hire temporary workers to fill gaps until they can hire permanent workers. The graph below from True Insights shows payroll growth is starting to fall back in line with pre-pandemic rates of 150-200k per month.
Bill Dudley, President of the New York Fed from 2009 to 2018, in a Bloomberg editorial, voices concern the Fed is too worried about deflation, or as he says, the “last war.” He argues the Fed should be concerned inflationary pressures are more than transitory. He prefers the Fed take on a more hawkish tack sooner rather than later. Per Dudley: “This dovishness increases the risk of a major policy error. If the economic outlook evolves in unexpected ways, Fed officials will almost certainly be slow to respond…” “Hence, if inflation proves more persistent than anticipated and even accelerates as the economy pushes beyond full employment, they’ll have to tighten much more aggressively than they expect.” Further, “A faster pace of tightening would come as a shock for financial markets and could risk tipping the economy back into recession. That’s the danger of fighting the wrong war.”
Oil Prices and Rig Counts
The graph below compares oil prices to rig counts. After falling to recent lows, rig counts are rising. However, they are still well less than should be expected given current oil prices. Why are oil producers not adding rigs and producing more oil to take advantage of higher prices? There are a few reasons. First, OPEC is increasing production and will get more aggressive if prices keep rising. Second, oil producers realize the current economic boom and spike in economic activity, and demand for oil is temporary. It is the result of short-term fiscal stimulus and economic normalization. Lastly, President Biden is threatening to release oil from the strategic oil reserves. If the government indiscriminately caps the price of oil via rhetoric and action, the incentive to produce and add rigs is lessened.
October 7, 2021
“Inflation” Coming Next Week
The graph below, courtesy of the Market Ear, shows how mentions of inflation are a hot topic for earnings calls. As we gear up for another round of earnings releases starting in earnest next week, there is little doubt the number of “inflation” mentions will increase further. The question facing shareholders is how well can companies deal with inflation? Can they take advantage of higher prices or will they negatively impact profit margins? Each company and industry has different factors to consider that will help answer those questions.
From a macro perspective, we will also learn a good deal about expectations for continued inflation in the coming quarters. The Fed speaks with executives at many large companies, so this information will also help us better assess our outlook on the potential pace at which the Fed tapers QE.
Jobless Claims
Following yesterday’s strong ADP report, the labor market showed more improvement. Weekly Initial Jobless Claims fell back toward a post-covid low of 326K. This was below expectations of 348k and well below last week’s 364k.
St. Louis Fed Expects an Ugly Jobs Report While JPM is Optimistic
Per Market News (MNI), the St. Louis Federal Reserve expects to see an 818k decline in tomorrow’s BLS payrolls report. St. Louis Fed economist Max Dvorkin states: “There’s still “a lot of uncertainty around these figures,” but the model has tracked actual CPS employment “quite well” through the summer, he said.” He blames the recent uptick in Covid cases and the impact on global supply lines. The current forecast is for a gain of 410k jobs. If the Fed’s forecast is proven correct the Fed might delay what appears to be a tapering announcement in early November.
On the other hand, JP Morgan is optimistic “we are looking for a 575,000 gain in jobs and a drop in the US unemployment rate to 5%. The driver for an above-consensus forecast is the expected rebound in the leisure and hospitality sectors.”
Retail Inventories are Low
Price pressures, especially on retail goods, will likely continue into the holiday season. The graph below shows the ratio of Retailers’ inventories to sales is at a 25+ year low and well below pre-pandemic levels. Given there appears to be little let-up in supply line problems, it’s becoming increasingly probably that many retailers will not be able to fully stock their shelves to meet the heavy demand for Christmas presents. With, the limited inventory we suspect many stores, both online and brick and mortar, will be able to raise prices over the next few months.
October 6, 2021
Delaying the Debt Cap Limit
Senator McConnell has supposedly told a closed-door meeting of Senate Republicans that he would offer a short-term debt ceiling extension today. Stocks recovered from their morning losses on the rumor.
ADP Jobs Report
The ADP Employment report shows strength in the jobs market during September. Per ADP, there was a net pick-up of 568k jobs in September versus 374k in August. The services sector accounted for about 80% of the gains with leisure/hospitality accounting for 226k jobs.
“Leisure and hospitality remain one of the biggest beneficiaries to the recovery, yet hiring is still heavily impacted by the trajectory of the pandemic, especially for small firms. Current bottlenecks in hiring should fade as the health conditions tied to the COVID-19 variant continue to improve, setting the stage for solid job gains in the coming months.” – Nela Richardson, chief economist, ADP.
The Atlanta Fed’s forecast for Q3 GDP growth fell again from 2.3% to 1.3%. The forecast was over 5% in early September. The worsening trade deficit and weaker than expected ISM Services Index are to blame for the latest revision.
Volatility Is Not Living Up To Hype
Watch a few minutes of CNBC and you would think recent daily market gyrations are extreme. In prior commentaries, we note that volatility and the put/call ratio are not signaling much concern. The reason is that the roller coaster the market has been on over the last week or two or is not that daunting. Dare we say it’s a kiddie ride. The graph below charts the absolute daily price change of the S&P 500. As circled, daily changes are running above 1% a day. While above-average, there is nothing too unusual about it.
Utilities vs. Energy
The bar chart below, courtesy of Charles Schwab, shows 100% of energy stocks in the S&P Energy sector are above their 50dma. Conversely, not one utility is above its 50dma. XLU, the utility sector ETF, is sitting on its 200dma while XLE (energy) is about 15% above its 200dma. The second graph shows XLU is resting on important support in both the 200dma (red) and a support line (lime) going back to June 2020. We added utilities to both RIA Pro portfolios over the last week, as we believe support will hold and a bounce is probable. However, caution is warranted as higher natural gas and coal prices may weigh on the sector, forcing it to break support.
October 5, 2021
ISM Services Weakening
The services sector is not showing nearly as much strength as manufacturing. Last week we noted the ISM Manufacturing Index rose to 61.1, which, while off recent highs, is still at levels commensurate with prior peaks over the last 20 years. ISM Services on the other hand fell to 54.9 today and is 15 points below recent highs of 5 months ago. It is now normalized with pre-pandemic levels.
Put/Call Ratio is not Fearful
In Monday’s commentary, we showed the VIX is higher but not rocketing to levels that would cause more concern. The put/call ratio, another indicator of investor stress, is elevated, but like the VIX, not at concerning levels. As shown, the ratio is still below levels seen in prior 2-5% declines over the last year. The current instance pales in comparison to the surge in March 2020.
The graph below, courtesy of Bianco Research, helps put the recent 7% sell-off in the NASDAQ into perspective. As shown, there have been four other declines which have been greater than the current one in just the last year. While recent price action may be concerning, the markets have not done anything overly concerning. That said, valuations are sky high and the Fed is about to embark on tapering QE, so we want to manage our risk closely.
Energy Defying the Market
Despite the S&P 500 falling by about 1.50% yesterday, the energy sector (XLE) rose by a similar 1.50%. As we have shown previously, crude oil ($77.70) is bumping up against long-time resistance of $76-78. A break above resistance could lead to a substantial rise in oil prices. Crude was up over 2% yesterday as rumors spread that OPEC will follow its plan and increase production by 400,000 barrels in November. Some traders were expecting a larger increase in an attempt to limit higher oil prices. Further helping many of the oil companies is a surge in the price of natural gas. Yesterday it rose over 2% to $5.75, more than double its price from spring.
Gamma Matters
In yesterday’s Gamma Band Update Erik Lytikainen wrote: “There have been three straight weeks that the SPX has failed to overtake the Gamma Flip level, which is currently near 4,440. Our risk-avoiding model currently has an allocation of 30% to SPX and 70% cash. If the market closes below what we call the “lower gamma level” (currently near 4,285), the model will reduce the SPX allocation to zero.”
Erik’s model is reducing exposure because options gamma has flipped negative. Simply, it is at a point where further moves lower in the S&P 500 result in increasingly more selling by options dealers. When prices are above the gamma flip traders need to buy to hedge their books. The graph below confirms his analysis, showing the Gamma Flip level just north of 4400. Given how large options volume has become this year and general market illiquidity, options hedging is a significant cause of price change and may result in more volatility.
October 4, 2021
Market Update
We are about midway through the trading day and the equity markets are lower. The NASDAQ is leading the way down nearly 2%. The Dow is only down 1%, supported by energy stocks which are up over 2% today. Despite the decline, the VIX is not increasing as much as might be expected. As shown, the VIX is in the same range it has been for the past four days and below levels from the first leg lower on August 20th. A break out to higher highs in the VIX, in conjunction with lower prices, might force short volatility traders to cover, which would add further to downside pressure in the markets.
The graph below shows how well the 50DMA has supported the market since the swoon of March 2020. The bottom graph shows the difference between the S&P and the moving average. As highlighted it is currently 2-3% below the moving average, similar to dips in October and November of 2020. While the decline may not feel great, it has yet to show us something different from what we have witnessed over the past year and a half. A further breakdown, especially below the 100dma would be concerning. Conversely, if the S&P 500 re-takes the 50dma, it may likely head back to record highs. As we have been saying over the last few weeks, all eyes are on the 50dma.
This will be a quiet week for economic data, yet one of the most important of the month. ADP comes out Wednesday with expectations for a gain of 415k new jobs added. The BLS will release its payrolls report on Friday. Economists expect 475k new jobs versus a weak 235k last month in that report. If both data points come near or better than estimates we should assume the Fed will announce tapering QE at their next FOMC meeting (11/03).
Speaking of the Fed we expect they will remain quite vocal this week. As we saw last week, we expect them to continue to reflect concern about inflation and promoting taper soon. Vice-Chair Clarida joins other Fed members in being exposed for personal trading prior to important Fed statements. We suspect, as a result, Powell will not be renominated.
Earnings season kicks off this week but there are not any major companies set to report. The banks will effectively lead off Q3 reporting next week.
Banks Are Not Lending
The graph below from Brett Freeze is a very powerful summary showing why monetary velocity is not rising. As we have written, inflation is a function of money supply and monetary velocity. Fading velocity has offset a large chunk of the surge in the money supply. As his graph below shows, banks are investing in secondary securities, mainly U.S. Treasuries instead of lending money. The tradeoff between the two is normal but the current levels are somewhat extreme.
Today’s release of the Atlanta Fed’s GDP forecast took another big tick lower. As shown below, it now stands at 2.3% for the third quarter, down from 3.2%.
Farrell’s Rule #5 Continued
Yesterday we shared Bob Farrell’s rule #5- “The public buys the most at the top and the least at the bottom.”
Today we follow it up with evidence from Jim Colquitt at Armor Index ETFs. Jim’s graph below compares the average investor allocation to equities to S&P 500 future 10-year returns. As we see, the data is very well correlated lending credence to rule #5. Note the correlation statistics at the top left of the graph.
More importantly, current allocations to equities are more than two standard deviations above the norm. Per Jim- “Since 1952, we’ve only had 4 quarterly observations above the two standard deviation line. Each of which resulted in negative returns (CAGR) for the subsequent 10 years. We now have a 5th.”
Daily Market Commentary
Subscribe Today to get our daily market commentary in your email every morning. Follow the link and click Subscribe Today.
ISM Better Than Expected
The ISM national manufacturing survey was better than expected despite declines in many regional surveys. ISM Manufacturing rose to 61.1 versus estimates of 59.5 and 59.9 in the prior month. Employment bounced back into economic expansionary territory and inventories rose, hopefully signaling the supply side shortfalls may be getting better. Prices continue to reside at very high levels. The prices subcomponent is 81.2, up from 79.4.
Higher Prices, Weaker Income, and Strong Consumption
Today’s Personal Income and Outlays report was not welcome news for consumers. Personal Income only rose 0.2% versus 1.1% last month. Personal Consumption Expenditures (PCE) a direct feed to GDP was +0.8%, much better than last month’s revised -0.1%. Also, the price index and core price index were 0.1% above expectations and in line with last month. The PCE price index rising to 4.3% is the largest annual change since 1991. The PCE price index serves as the price deflator to calculate real GDP. The Fed’s term “Transitory” to describe the recent surge in inflation is starting to get long in the tooth!
The chart below, from MacroMarkets Daily, shows there are now 8 of 35 central banks increasing interest rates.
Bill Farrell Rule #5
The graph below, courtesy of the Daily Shot, serves as a good reminder of Bill Farrell’s rule #5. “The public buys the most at the top and the least at the bottom.”
Inflation Greater than 3%
The graph below, courtesy of Brett Freeze, shows the Minneapolis Federal Reserve’s implied probability for inflation running greater than 3% for the next five years. The probability is derived from derivative markets. Currently, the Fed puts the odds at approximately a one-third chance inflation runs at 3% or greater. The Fed’s long-term goal is 2%. Interestingly the President of the Minneapolis Fed, Neel Kashkari, remains the most dovish member on the board. Based on comments he expects inflation to run well below 3%.
September 30, 2021
QE is in the Budget Fray
As if the Democrats did not have enough trouble passing a budget deal, they have a new hurdle per the headline below. Fed independence continues to weaken as it is now a pawn in the budget battle.
MANCHIN TOLD SCHUMER HE WANTED THE FED TO END QE AS A CONDITION FOR A BUDGET DEAL
Chip Shortage for Autos
Want to know why production at most major auto manufacturers is being sharply reduced? The Bloomberg illustration below shows the average car uses 1,400 chips. Some estimates claim the chip shortage may not be fully resolved until 2023.
Lost Productivity
Yesterday we published China Plays The Long Game While The U.S. Blows Bubbles. The article discusses recent actions China is taking to boost productivity. Also in the article, we criticize the U.S. and other capitalistic countries for failing to prioritize productivity. For example: “For the better part of the last five years, S&P 500 companies have given back to investors via dividends and buybacks about 100% of their earnings. Why not? Executives are paid handsomely to boost share prices today, not to be more productive and profitable in the future.”
To further emphasize the point we share the Fidelity graph below which breaks down buybacks by industry. Since 2004, U.S. companies have spent $11 trillion to buy back their own shares. Instead, imagine if they invested $11 trillion into productive ventures. Corporate earnings, economic growth, and wages would certainly be higher today and more sustainable.
Initial Jobless Claims rose for a third week in a row to 362k. We are not overly concerned with the recent increase as there are seasonal aspects and hurricane Ida affecting hiring/firing patterns. However, we do not want to see the recovery in claims stop at this relatively high level. Prior to the pandemic, initial claims ran in the low 200k range.
Dollar Breakout?
The dollar was up over .60 cents yesterday and is now hitting formidable resistance as we show below. The dollar appears to be forming a head and shoulder bottom. Based on the pattern, a breakout above the red resistance line (neckline) might likely result in the dollar index moving up another $5. Commodities and possibly equities are at risk if that occurs.
Stocks and Bonds Travelling Together
Bonds typically fall in yield during measurable declines in the stock market, making them a great diversifier. The graph below shows that in each “sell-off” over the last ten years, except one, Treasuries had positive returns. That standout is occurring now. It’s early to claim bonds will not diversify equities if the decline continues but it bears watching.
September 29, 2021
Housing is Red Hot
Pending Home Sales rose 8.5% in August after two straight monthly declines. The change in year-over-year sales is still negative but the monthly trend is clearly on the rise again as shown below. Per the National Association of Realtors President, Lawrence Yun, “rising inventory and moderating price conditions are bringing buyers back to the market.”
His comment about moderating price conditions is debatable. Yesterday, the Case-Shiller 20-City Home Price Index rose another 1.5% monthly and is now up nearly 20% annually. Prior to the pandemic, the index rose approximately 3-6% a year. At the housing market’s peak in 2006, the Case-Shiller Index rose 15% annually.
Defense is not Working
As we discuss in our 3 Minutes on Markets video, bonds did not rally to help offset losses in stocks yesterday. While bonds and gold tend to historically provide diversification to an equity portfolio, such is not always the case. In fact, days like yesterday are recently becoming a little more common. The last 3 times the S&P fell by 2% or more in a day, the 10-year Treasury price, gold, and bitcoin also fell on the same day.
Extreme stock and bond market valuations are largely predicated on the Fed’s ability to provide excessive liquidity via low rates and QE. Given confidence in the Fed is paramount to valuations we offer some concern at recent disclosures implicating Fed members. In particular, are those of Dallas President Robert Kaplan. The quote below is from Wall Street On Parade.
Each of Kaplan’s financial disclosures forms dating back to when he first became Dallas Fed President on September 8, 2015 (which we obtained directly from the Dallas Fed), show that Kaplan was trading in and out of S&P 500 futures, a highly speculative form of trading used by hedge funds and day traders.
Given Kaplan had access to non-public information, including transcripts of potential market-moving speeches yet to be released from Fed Chairs, the allegations are serious. Over the coming days and weeks, we need to ascertain if investors care and further if Congress will take any action that might inhibit the Fed’s policy thought process.
Another consideration is whether or not the disclosures provide President Biden a reason to nominate Lael Brainard instead of granting Powell a second term. The graph below shows the odds favor Powell, but they have come down in recent days.
Will Yields Surprise To The Upside?
The graph below, courtesy of Ed Yardeni, shows the strong correlation between the Citi Economic Suprise Index and ten-year UST yield changes. The Citi index measures economic data estimates versus actual readings. Over time the index oscillates as economists move back and forth from overestimating economic activity to underestimating it. As shown below in red, economists have been over-optimistic recently but given this data series in the past, it is likely reaching a point where economists start under forecasting economic data. If this proves true, yields are likely to rise over the coming weeks.
September 28, 2021
Richmond Fed Goes Negative
The Richmond Fed Manufacturing Index now points to economic contraction at -3 versus estimates of 10 and a prior month reading of 9. The regional index is at its lowest level since May 2020. While most sub-indexes fell, the good news is that employment is still expanding. Yesterday, the Dallas Manufacturing Index fell from 9 to 4.6 but remains in expansion mode. The ISM National Manufacturing Index will be released on Friday. Expectations are for a minor decline but keeping it well within an expansionary mode.
Per CNBC: “Ford (F) – Ford is accelerating its push into electric vehicles, with plans for a new U.S. assembly plant and three battery factories. Ford and South Korean partner SK Innovation will invest more than $11 billion in the project. Ford shares rose 3.3% in premarket trading.” We hold a 3% in F in the 60/40 Equity Model.
Hawks are Fleeing The Fed
Dallas Fed President Kaplan is following Boston Fed’s Rosengren in retiring from the Fed. The announcements come in the wake of disclosures about their active trading activity. Both members were hawkish and outspoken about their desire to taper QE and ultimately raise rates.
Dow or NASDAQ?
In the aftermath of the last Fed meeting, value and cyclical stocks are edging out growth stocks. Given the recent jump in yields and outperformance of energy, materials, and industrials, the market may be voicing concern the Fed is late to stop inflation. We recently boosted allocations to cyclical and value sectors as their respective technical setups are enticing and the possible reflation rotation may be back on. To help us track a reflation rotation we can use the ratio of the more value-centric Dow Jones to the growth-led NASDAQ. The graph below shows the recent uptick in Dow versus the NASDAQ. Also, note that the MACD of the ratio is turning up and the RSI is above 50. If the reflation trade is on again, the relative upside of the Dow and value/cyclical sectors can be very rewarding. From February to June of 2021, during the last inflation scare, the Dow beat the NASDAQ by about 15%.
Inflation on the Mind
The graph below from Teddy Vallee shows that inflation concerns are top of mind in corporate earnings outlooks. In a couple of weeks, corporations will start announcing quarterly earnings. We suspect many companies will highlight how they are handling margin pressures due to higher wages and input costs. For companies that can push through said costs to consumers, the outlook should be better than for those that can’t.
September 27, 2021
Atlanta Fed GDPNow
The Atlanta Fed GDPNow forecast for Q3 GDP continues to fall. It now stands at 3.2%, down from 3.7% a week ago, and is now almost half of what it was in mid-August. As shown, the delayed forecast from economists is at 5% but following the GDPNow trend lower.
Northwestern University quantifies the effect of higher oil prices on a President’s approval rating. Per the Financial Times: “A study by researchers at Northwestern University in 2016 found that for every 10-cent rise in petrol prices, the approval rating of the incumbent president dropped by 0.6 percentage points, after controlling for other factors.”
With the mid-term elections a year away and oil prices on the verge of a breakout higher we may start to see the administration pressuring Chairman Powell to better control inflation. Powell is up for renomination as his term expires in February. Will political expediency push the Fed to tighten more aggressively than they might have otherwise?
Critical Technical Resistance For Crude
As we show below, crude oil is sitting just under $77 a barrel. Over the last ten years, that price has marked significant support and more recently resistance. A decent break above $77 and there is little resistance before possibly seeing triple-digit prices. Shortages in Britain are providing a tailwind to the price. Goldman Sachs is optimistic, raising their price target on Brent Crude oil to $90 for year-end.
The Week Ahead
This week will mark a quarter-end so expect a little more volatility as traders do a little window dressing.
There are a decent number of economic data points this week. We lead off today with Durable Goods Orders and the Dallas Fed Manufacturing Index. Later this week the Richmond Fed, ISM, and Chicago PMI will provide more updates on the state of manufacturing. Given heightened concerns over inflation, the reports’ prices sub-index and related comments will be important. On that same thought, the PCE price index for August will be released on Friday. The Fed prefers PCE over CPI. Current expectations are for a gain of 0.3% versus 0.4% last month.
There will be plenty of Fed speakers this week. Many of them will further clarify their thoughts and outlooks for monetary policy going forward. Keep an ear out for any comments on Evergrande and China, and their implications for economic growth and ultimately policy.
August new home sales came in above expectations at 740k (+1.5% MoM) versus a consensus of 708k. The median new home sales price grew to $390,900, which represents a massive increase of +20.1% YoY.
China Crackdown Continues
Cryptocurrencies are selling off following news that the PBOC has declared all cryptocurrency transactions illegal. According to ZeroHedge, “In a statement the People’s Bank of China said the latest notice was to further prevent the risks surrounding crypto trading and to maintain national security and social stability.” Prices have previously dipped and recovered from attempts by the CCP to squash digital currencies. Will this time be different?
COST reported earnings for its fourth fiscal quarter yesterday after the close. GAAP EPS of $3.76 comfortably beat expectations of $3.58. Fourth quarter revenue came in at $62.7B (+17.4% YoY) versus the consensus estimate of $61.5B. Sales growth was primarily driven by comparable store growth of 15.5% YoY, with double digit growth in all operating segments. We hold a 1.5% position in the Equity Model.
Bonds Get Routed
Bond yields rose significantly yesterday, following a decent performance after the Fed policy statement on Wednesday. While too early to tell if yesterday’s move is just technical, it may be an early warning from bond investors that the Fed is behind the curve in tapering. Market implied five-year inflation expectations rose from 2.41% to 2.48%, supporting our concern.
Today bonds are being punished further, with the 10-Y yield pushed up 4 bps to 1.45% by mid-morning. If the 10-Y yield remains elevated through the close, it will have reached its highest point quarter-to-date.
Did Ending Jobless Benefits Help?
The Wall Street Journal helps answer our question. Per their article, States That Cut Unemployment Benefits Saw Limited Impact on Job Growth, “States that ended enhanced federal unemployment benefits early have so far seen about the same job growth as states that continued offering the pandemic-related extra aid, according to a Wall Street Journal analysis and economists.” The graph below shows there is no discernable difference in job growth between states that ended benefits during the summer and the states in which they just expired.
Fed Speakers
Starting today and through next week, Fed members will make their thoughts known through a plethora of speaking engagements.
September 23, 2021
PMI
The PMI composite index fell slightly as growth is “hampered by severe supply chain hold-ups and capacity shortages.” Both manufacturing and services sectors continue to signal solid economic expansion. Inflation however remains a concern. The following paragraph from the report leads to concern the recent stabilization in headline inflation data may not be lasting: ”
On the price front, input costs rose at a sharper pace during September. The rate of cost inflation was the quickest for four months, and the second-highest on record, as supply chain disruptions and material shortages pushed prices and transportation costs up. Meanwhile, output charges continued to increase markedly, continuing to rise at a pace far outstripping anything seen in the survey’s history prior to May, as firms sought to pass on higher costs to clients where possible.
The Evergrande Saga
Evergrande is required to pay $83 million of interest on a dollar-denominated bond today. Per Newsquawk, they have a 30-day grace period as part of an existing agreement before the debt is classified as a default. It appears as if Evergrande may give a preference to paying off Yuan-denominated debt and obligations over foreign-held dollar-denominated debt. They have another $47.5 million dollar-denominated interest payment due next week.
The two graphs below are the “dot plots” from the Federal Reserve showing Fed member expectations for where the Fed Funds rate will be in the coming years. The graph on top is the set of projections from June. At the time only 5 members thought they would raise rates four times or more by the end of 2023. As shown on the bottom graph, with yesterday’s projections, that number stands at 9. There are also 2 more Fed members that think the Fed will hike rates in 2022 compared to three months ago.
June
September
All Ears on the Fed
With the Fed meeting behind us, Fed members can now speak publicly. We expect a deluge of speeches and interviews over the coming days as members try to clarify the Fed’s views as well as their personal opinions. We are on the lookout for dissension in the ranks by the members that are overly concerned with higher inflation. While Powell clearly set out a time frame for taper, the Fed might get cold feet if the equity markets turn lower. If that were to happen some of the hawks may become even more vocal about the need to taper and ultimately raise rates. In The Fed Speaks Loudly and Carries a Feather, we decompose the Fed members by their voting status and degree of influence. The chart below and the article provides some context for their latest thoughts on the economy and policy.
September 22, 2021
Powell Q&A Session: A More Hawkish Picture
Following a vague reference to taper in the FOMC statement, Jerome Powell made some hawkish comments during his press conference:
With respect to progress towards taper, Powell commented, “In my own thinking, the test is all but met”.
“I think if the economy continues to progress broadly in line with expectations and the overall situation is appropriate for this, we could easily move ahead [with taper] by next meeting, or not…”
Again, with respect to a decision for November taper, “I don’t need to see a good employment report next month; I just need to see a decent employment report”. Powell is clearly signaling that Fed is likely to announce taper in November barring an unexpected deterioration in economic conditions.
Powell commented that it may be appropriate for taper to conclude by mid-2022.
As expected, Powell is leaving a back door open in case taper doesn’t go over well. “If necessary, we can accelerate or decelerate the taper”.
Taper Talk Continues
Changes to the FOMC statement are highlighted below. Of note, the Fed signaled taper could be around the corner, but did not drop any hints in the statement with respect to timing. “Since then, the economy has made progress towards these goals, and if progress continues broadly as expected, the Committee judges that a moderation in the pace of asset purchases may soon be warranted”. However, in the FOMC press conference Q&A session, Powell noted that taper could come “as soon as the next meeting”.
The Fed reduced their projection for 2021 real GDP growth to 5.9% from 7%. Further, the Fed raised their core PCE inflation forecast for 2021 to 3.7% from 3.0%. The “dot plot” graph on the left shows the level of Fed Funds that each Fed member expects by year. There are now 9 FOMC members that think the Fed will hike rates as soon as next year, compared to only 7 in June. This represents an even split between members that see liftoff in 2022 and those who don’t, and could have implications for the pace of taper once initiated.
ADBE reported earnings for the 3rd quarter yesterday after the close. GAAP EPS of $2.52 easily beat the consensus estimate of $2.29. Similarly, revenue of $3.94B (+22% YoY) beat expectations of $3.54B, driven by a 24% increase in subscription revenue. Management guided to Q4 revenue of $4.07B- slightly above the consensus of $4.05B. Guidance for non-GAAP EPS is also above consensus, at $3.18 vs. an expected $3.09. ADBE is down ~4% in pre-market trading despite beating expectations across the board and guiding above consensus for Q4. We hold a 1.5% position in the Equity Model.
FedEx is Raising Prices
Federal Express announced that effective January 2022, FedEx Express, FedEx Ground, and FedEx Home Delivery shipping rates will increase by an average of 5.9%. FedEx Freight rates will increase by an average of 5.9% to 7.9%. We suspect UPS and other carriers will take similar action. Given a large number of goods are now ordered online, the increase in shipping costs will inevitably work its way into higher prices next year.
Cash on the Sidelines
The graph below from Sentimentrader compares the amount of cash in money market funds to corporate equity issuance. Per Sentimentrader:
“During the pandemic panic, the ratio neared 30 and was the highest in 30 years. In other words, there was 28 times more cash available than shares offered in supply. There are ways to quibble with the technicals, but it’s simply meant as a reflection of sentiment.
Over the past year, the ratio has declined steadily as supply ramped up. Corporations are “feeding the ducks,” as the saying goes. Even though money market assets haven’t been drained much, the skyrocketing supply has caused the ratio to drop below 10 for the first time since the year 2000.”
Declining Earnings Confidence
The graph below, courtesy of the Market Ear, shows declining sentiment towards earnings expectations. Each line representing the four major global equity markets shows the number of earnings upgrades less the number of downgrades, divided by the total number of estimates. Each line is approaching zero but still above it, denoting net confidence remains positive but if falling.
Employment and inflation tend to get the headlines as far as rationales for the Fed to take action. As we consider what the Fed may do tomorrow, we should also consider lending standards. The graph below shows the lending standards for large banks’ credit card customers are as easy as they have been in 20 years. On its own, very easy lending standards, as we have, push the Fed toward a more hawkish stance. Easy borrowing conditions incentivize personal consumption. More consumer activity, especially given current supply line problems, is likely to further agitate inflationary conditions.
Trading Game Plan for the S&P 500
The markets are trading well in overnight trading following yesterday’s late-day bounce. The sizeable bounce provides us with another set of levels, in addition to the 50, 100, and 200-dmas, to guide our trading. The graph below shows the Fibonacci retracements from the recent high to low. If this rally proves to be a bull trap, it is likely to give up between the 38% retracement (4395) and the 62% retracement (4451). There is also a gap between 4400 and 4430. It is common for such gaps to fill and then reverse direction. If the market surges higher through the gap and retracement levels, the outlook becomes more bullish. A rally above the 4451 retracement level and well through the 50dma (4436) will likely lead to new highs. Conversely, the 50 dma (4436) may prove to be resistance. The first line of support is yesterday’s lows and the 100dma (4328). A break of the recent low leaves a target of 4106, the 200dma.
Will They or Won’t They?
In addition to concerns with China, Evergrande, and possible contagion, the markets are also grappling with Wednesday’s Fed meeting. In what was likely a purposeful leak last week, the WSJ laid the groundwork for a taper announcement Wednesday and the reduction in asset purchases in November. With the U.S. and foreign markets skidding yesterday some are asking how the Fed might react. In a Bloomberg interview, ex-New York Fed President, Bill Dudley, warns “They’re not going to react to small market moves and defer the tapering on that basis. They have to change their economic forecast,” he said Monday during an interview on Bloomberg Television with Lisa Abramowicz, Tom Keene and Jonathan Ferro. “At this point, it’s really premature to reach that conclusion.”
There is a lot more to the failure of China’s Evergrande company than meets the eye. At $16 billion, (China’s GDP) is no longer that far from that of the U.S. ($22 billion) and nearly three times Japan, the world’s third-largest economy. What China does and how they do it matters a lot, not just to China but for the global economy. To help keep you better informed, we share a must-read commentary of the situation from @INArteCarloDoss.
With the S&P trading poorly this morning, we share an important graph to help you manage risk. As we show, the 50dma in blue has proven great support. However, the market is now trading more than 1% through that support this morning. The next level to watch is the 100dma, which was supportive in the fall of 2020. Breaking the 100dma may likely lead us to the 200dma at just over 4100.
60 Minutes Warned Us
In a memorable show, which aired eight years ago, 60 Minutes reported on China’s property bubble and ghost cities. The Evergrande Company, on the verge of default and mentioned in the clip, is just the tip of the iceberg. If you want to better understand the imploding bubble China faces watch the dated but poignant short episode- LINK.
The Week Ahead
The Fed’s FOMC meets on Tuesday and Wednesday. Investors will focus on the policy statement and press conference at 2:00 and 2:30 pm ET respectively. Some sort of taper announcement is widely expected with tapering likely to begin in November. The market will need to digest the pace at which they plan on tapering and what events or economic data may cause them to speed it up or slow it down. If they do not announce tapering, there is another factor that few investors are considering. As we wrote in The Fed Speaks Loudly and Carries a Big Feather, there is the possibility of dissension from some voting members. Per the article: Will they dissent? One or two dissents, while not frequent, are not uncommon either. The market reaction might be muted to a bit of friction. Where we offer caution is if the number of dissenting voters totals four or five or even more.”
The economic calendar is relatively light this week with a slew of housing data. Of interest will be the Thursday PMI survey. This will be the first national survey of manufacturing conditions for September. Recent regional manufacturing surveys have been better than expected over the last week, leading us to believe PMI may as well.
After last month’s plunge, the University of Michigan Consumer Survey was stable at 71.0, up slightly from last month. The index is well off the 110-120 rate it was running at for most of 2018 and 2019. Of focus, one year expected inflation seems to be stabilizing albeit at a high 4.7% rate. Longer-term 5-10 year expectations are 2.9%. Per the survey, inflation concerns are spreading to a broader chunk of the population. Consider the following quote: “over the past few months, complaints about rising prices have increased among younger, richer, and more educated households”
Excess Cash No More
On many occasions this year we noted how the Treasury is carrying excessive levels of cash. The graph below shows the spike in cash due to the massive pandemic-related debt issuance and slow-to-follow spending. Federal spending has caught up, and cash balances are back to normal. The result will be an increase in the supply of Treasury debt. This dynamic is occurring at the same time the Fed is contemplating buying fewer bonds. Over the last six months, Treasury supply has not been a concern for the market due to large Fed purchases and reduced issuance. The supply/demand equation will change in the months ahead possibly pressuring yields higher.
Shipping Costs Soar
Is it Time to Buy the Dow?
The ratio of the Dow Jones Industrial Average to the NASDAQ is approaching levels last seen at the peak of the Tech Bubble. Favoring the Dow over the NASDAQ paid handsome dividends from 2000 to 2003. Are we nearing a similar opportunity? The composition of the Dow has changed over the last 20 years. Unlike, the late 90s the Dow now has more tech exposure, like Microsoft at 5.7% of the index and SalesForce at 4.8%. It also holds Apple, albeit at a lesser weight. The Dow’s three top holdings, accounting for a fifth of the index, are UNH, GS, and HD. That compares to the NASDAQ’s top three holdings AAPL, MSFT, and AMZN account for nearly a third of the index. While the Dow has MSFT and other tech companies, a bet on the Dow is a bet against the world’s largest technology companies. Currently, the FAANG stocks driving the NASDAQ’s outperformance are considered both high growth and safety stocks. That narrative must change before the Dow has a fighting chance.
September 16, 2021
Junk Bonds in China
The graph below continues our discussion of Evergrande. Yields in China’s junk bond market have doubled since late May. The problems facing its property markets and economy, in general, are widespread. China’s junk bond yields are back to levels when COVID first roiled markets. As a comparison, BofA’s B-rated U.S. junk index is 4.41%, well below 12.50% from March 2020.
Retail Sales on Fire
U.S. Retail Sales unexpectedly rose 0.7% in August versus an expected .8% decline. However, last month’s data was revised from -1.1% to -1.8%. Excluding gas and autos, sales rose 2.0%. While the data is economically positive, the markets may not like it as it bolsters the rationale for tapering.
Jobless Claims rose last week to 332k. Louisiana reports the biggest increase in large part to Hurricane Ida. This is the first report after the federal pandemic unemployment benefits were rescinded on September 6th.
China’s largest real estate developer, Evergrande, is suspending trading in its bonds today but intends to resume trading tomorrow. The rumor is they will not pay interest or repay principal on any of its debt this week. Evergrande, with over $300 billion in debt, poses risks to the Chinese banking system and many foreign creditors. It is unclear whether the Chinese government will bail out its shareholders. With its stocks and bonds trading down significantly, investors are betting against it.
The table below, courtesy of Goldman Sachs, shows the sensitivity of each sector to rising labor costs. Industrials, which are typically labor-intensive businesses are not surprisingly, the most affected sector. It’s also worth noting, as shown at the bottom of the table, smaller companies have twice the EPS sensitivity to labor costs as larger companies.
Ferrari’s are Cheap
We finally found a valuation technique that claims stocks are cheap. The graph below compares the earnings yield of the S&P 500 to junk bond yields. To put this technique into context, it is like saying a Ferrari is cheap when compared to a Lamborghini. Junk bonds have never been more expensive. Currently, the B-rated, Bank Americal junk bond index yield is 4.44%, about 2% below its average from 2016-2019. It’s also worth noting this measure deems stocks as expensive at the market lows of 2001, 2009, and recently in March of 2020.
September 15, 2021
Trouble in China?
Stringent lockdowns in response to a delta variant outbreak are showing up in China’s economic data. YoY growth in retail sales fell to 2.5% in August versus the estimate of 7% from a Bloomberg survey of economists. Furthermore, construction investment is down 3.2% YTD following China’s new property restrictions, which is impacting global demand for commodities. For example, Chinese steel output reached a 17-month low in August according to Bloomberg. China’s government has avoided broad stimulus to support economic recovery, but some economists believe conditions will ease on the margin moving forward due to slowing growth.
You are probably asking why I should care about the prices of materials I have never heard of. These largely unknown metals and other are worsening supply delays and causing inflation in many popular technology goods. “Tech industry braces for skyrocketing rare earth prices” by NikkeiAsia, discusses why the prices of many rare earth materials are surging and the effect it’s having on tech manufacturers.
Per the article:“Praseodymium and neodymium belong to a category of metals known as rare-earth elements and are used to make neodymium-iron-boron (NdFeB) magnets. These permanent magnets, as they are known, are essential to a swath of tech gear — everything from speakers and electric vehicle motors to medical devices and precision munitions.”
Peaking Natural Gas Prices?
On Monday we pointed out natural gas prices are broaching the upper band of its ten-year range. Forex Live has interesting commentary arguing there may be more gains to come. They cite the TD Securities graph below showing that gas storage as compared to demand is at record lows (outside of the green band) and well below the recent five-year average. They think many analysts are focused on the supply of gas but not on increased demand. Per the article, demand has picked up for the following reasons: “What that ignores is that demand for natural gas has grown considerably in the past five years. The construction of many LNG facilities, the conversion of coal-fired power plants to natural gas and pipelines to Mexico all mean that larger inventories are needed.” Further: “What’s especially worrisome is that there are no signs of increased drilling.”
Peaking Delta?
The Delta variant is mentioned by quite a few Fed members as a reason they should delay tapering. John Hussman’s model below expects fatalities from Delta to peak in the coming weeks. Assuming his model holds up, as it has, the number of fatalities should hopefully drop significantly into November and December and alleviate concerns from some Fed members.
September 14, 2021
Median CPI
While the CPI data was lower than expected, the breadth of the data was not as friendly. As shown below, the median CPI rose .33% month over month and, unlike CPI, is up for three months in a row.
CPI came in weaker than expected across the board. Of most importance to the Fed, the core CPI (excluding food and energy) only rose 0.1% for the month. As a result, the annual core rate fell from 4.3% to 4.0%. Accounting for about 30% of CPI, Shelter costs continue to rise. Owners Equivalent Rent (OER) is up .25% on the month, while rent rose .31%. Given their large contribution and sharply higher rental prices, it’s way too early to claim inflation has been tamed.
Is the Sell-off Over?
Yesterday we shared the recent dependable market pattern. The S&P declines for a few days mid-month with upward-sloping movement before and after the decline. Similarly, the graph below also shows a reliable pattern for the VIX. The VIX spikes with each mid-month decline. Each of the recent spikes has been above its Bollinger Band. The current upper band is 21.46 and VIX is at 19.37, after coming close to touching the band. A similar spike, as we have seen, implies a run to the 24-25 area.
Market Drawdowns
The table below from The Market Ear shows the lack of any substantial drawdown this year. Through three quarters of the year, the largest drawdown is only 4.2%. Of the 94 instances in the table, only three years (2017, 1995, and 1964) have seen smaller intra-year drawdowns.
Value In Washed-out Japan?
David Robertson, an author for Real Investment Advice, shares interesting thoughts on potential value in Japanese stocks. He cites a Bloomberg article in which John Authers reviews how beaten up Japanese stocks are versus those in the U.S.
“John Authers provides some good background on Japan and its struggles over the years. After so many people have been burned so many times, it’s hard to seriously entertain the idea of investing in Japan. Perhaps that is exactly the type of washed-out situation that presents a value opportunity, however. Further, Japan’s epic underperformance started from the top of an epic bubble. What if the tables are turning? In a world of precious few cheap stocks or sectors, Japan is interesting.”
September 13, 2021
Nat Gas is on Fire!
As we show below, the price of Natural Gas is up sharply over the last few months sitting at the upper bound of its 10-year range. Will it break higher or fall back as it did in 2014 and late 2018 when it was at similar levels?
Inflation and Confidence
The New York Fed, via their latest Consumer Expectations Survey, shows the role that rising inflation expectations are having in declining confidence. The graph below shows expected inflation is now over 5% and rising. At the same time expected wage growth is 2.5% stable/falling. As a result, consumers expect to lose 2.64% (red line) in purchasing power over the next year.
Will the Market Bottom on September 21st?
The graph below shows the incredible regularity of the market over the last four months. As shown, every 20 days the S&P 500 tends to decline for a few days, bottom, and then rally back to prior highs. If the cycle plays out again this month we should expect a market bottom on 9/21. Monthly options expirations, which fall around the market troughs, are largely responsible. Liquidity is lacking, so options-related trades are driving direction on the days surrounding expirations.
CPI on Tuesday is the big market event of the week. Given the Fed is making substantial progress toward its employment goal, inflation concerns are moving front and center. While the Fed laid out a timeframe for taper in the WSJ last week, high CPI could speed that schedule up. Expectations for the monthly rate are 0.4%, slightly less than last month’s 0.5%. Also of importance this week is Thursday’s Retail Sales report. Will the recent plunge in confidence be felt by retailers? Speaking of confidence, the University of Michigan Consumer Survey will come out on Friday.
Next Tuesday and Wednesday is the next Fed meeting. Later this week most Fed members will enter the media blackout period.
Rental Inflation
30% of the CPI index is based on “Shelter” cost, i.e. real and imputed rental prices. The graph below should provide a warning that tomorrow’s CPI report can run hotter than expected. Luckily, the BLS uses questionable means to calculate rent. In BLS’ Housing Inflation Measure is Hypothetical Bull*** we analyze “Shelter” costs. Our conclusion: “If either OER or Rental prices show some correlation to reality, CPI could not only continue to run hot but could rise from elevated levels. That said, looking at historical BLS data, it appears Shelter prices will not change markedly from current levels.”
In the ongoing legal case between AAPL and Epic Games regarding app store payments, this morning a Federal Judge said that AAPL violated California’s laws against unfair competition. The judge ordered that AAPL can no longer require developers to use its payment system within their apps. The ruling could prove painful for AAPL’s top and bottom line if upheld, as AAPL currently receives commissions of up to 30% on some app sales, according to the New York Times. The order is set to take effect in 90 days, although appeals are expected from AAPL in the meantime. AAPL’s stock is down nearly 2.5% on the news.
The Fed Has Spoken
Often the Fed leaks policy changes or sends trial balloons via the media. They tend to have their favorite media outlets and authors in which to do it. Nick Timiraos from the Wall Street Journal is a current favorite. His latest article, Fed Officials Prepare For November Reduction in Bond Buying, lays out a timeline for the Fed to taper QE. While the article is not an official declaration, it will become the market assumption until we learn more at the September 22nd Fed meeting.
Per the article:
While they are unlikely to do so at their meeting on Sept. 21-22, Fed Chairman Jerome Powell could use that gathering to signal they are likely to start the process at their following session, on Nov. 2-3.
Under the plans taking shape, officials could reduce those purchases at a pace that allows them to conclude asset buying by the middle of next year.
PPI
The producer price index (PPI) is slightly higher than expectations. PPI, while not as well followed as PCE or CPI provides unique insights. First, PPI tends to lead CPI. Higher or lower input prices often eventually make their way to changes in the prices of goods companies sell, i.e. CPI. Second, other than labor, input costs are often the second largest expense for companies. Given rising wages and PPI, producers and other companies dependent on labor and commodities are likely to feel margin pressure.
Dow Theory, a once-popular way of evaluating the market, is well over 100 years. The theory follows that transportation stocks lead the broader markets. Per Business Insider: “The general idea is that both averages, over time, should move in tandem, given that the transportation average represents companies responsible for the movement of goods across the country. For that reason, it should serve as a leading indicator.” Many question the value of the theory today due to the tremendous technological progress. However, the fact of the matter is we still consume goods that must be shipped.
The graph below shows the Dow Transportation Index is down nearly 10% since May. At the same time, the broad market S&P 500 has steadily risen by 10%. For those following Dow Theory, this is a warning.
Will They Taper?
The chart below, courtesy of InTouch Capital Markets, breaks down the Federal Reserve Board by the degree to which they are policy hawks or doves. The graph also shows their respective voting eligibility by year. There are about twice as many hawks as doves, but three of the four most influential voters are dovish (Powell, Williams, and Brainard). The other, Vice-Chair, Richard Clarida, is neutral. Five of the six doves vote in 2021, while only four of the ten hawks vote in 2021. Despite the hawkish overtone from many Fed speakers, this chart points to a more dovish policy stance going forward. We will have much more on this graph and its implications in our next article this coming Wednesday.
September 9, 2021
Another Strong Auction
On the heels of yesterdays’ strong 10-yr auction, 30yr bonds were very well bid. The 1.91% yield on the bonds is nearly 2bps below where it was trading before the auction and the lowest auction yield in nine months. 30-year bond yields are down 10bps since peaking at 2% on Tuesday. Per Zero Hedge: “Dealers were left holding on to 13.1% of the auction, the lowest Dealer takedown on record!” Given there is little need for dealers to distribute what they own, selling pressure may be minimal in the days ahead. The bond is trading about 3bps lower in yield post-auction.
Fed’s Beige Book- Labor Shortages
The Fed’s Beige Book is a summary of economic conditions in the 12 Federal Reserve Districts. Before delving into each district’s report, the document starts with a one-paragraph highlight from each district. As shown below, all of the summaries include a statement on labor shortages and or wage pressures. The topic is clearly top of mind at the Fed, as it should be. If there are widespread job shortages and strong pressure to hire, as seen in the record number of job openings, wages may continue to rise and foster more inflation. Is it any wonder many Fed members are increasingly growing concerned with inflation?
Boston: “inability to get supplies and to hire workers.”
New York: “businesses reporting widespread labor shortages.”
Philadelphia: “while labor shortages and supply chain disruptions continued apace.”
Initial jobless claims fell to 310,000, a decline of 35,000 from last week. This is the lowest level for initial claims since March 14, 2020, when it was 256,000. In 2018 and 2019 jobless claims were steady in the low 200,000’s.
Inflation Expectations
The graph below shows inflation expectations have stabilized after rising sharply in 2020. Expectations are probably more important than actual inflation figures like PCE, CPI, and PPI as the Fed tends to believe inflation follows expectations. Given the unprecedented supply line pressures along with pent-up demand, and massive fiscal stimulus, the Fed’s reliance on the markets might be a trap this time.
The equity markets are affirming stable inflation expectations. Cyclical sectors, that traditionally benefit from higher prices and strong economic growth, are lagging while more conservative, less economically sensitive sectors are leading the way. The sector performance map below points shows where money is flowing to and from. It appears investors are seeking shelter in more conservative, lower beta sectors like utilities, healthcare, and REITs. Large-cap technology and communication, like Apple, Microsoft, Facebook, and Google, have also done well as their earnings are thought to be minimally affected by slowing economic growth. The cyclical sectors like energy, materials and industrials are lagging as growth prospects decline.
September 8, 2021
Strong Auction
The Treasury Department’s 10-year auction was met with strong demand for the second month in a row. The recent backup in yields seems to be eliciting demand. Today’s auction has a bid to cover ratio of 2.59, meaning there are 2.59 bids for every bond offered. That was the second-highest bid to cover in over a year. The highest was last month’s auction. 30-year bonds will be auctioned on Thursday.
Jobs Jobs Jobs!
The BLS JOLTs report shows the number of job openings surged from 10.2 million to 10.9 million, blowing away estimates of 10 million. There are now over 2 million more job openings than the 8+ million the BLS says are unemployed. The data is for July when over 7 million were still receiving unemployment claims. It is widely expected the number of openings will fall in the coming months as the pandemic-related jobless benefits expired last week.
Rule #5
Bob Farrell’s rule #5 states: “The public buys the most at the top and least at the bottom.” The graph below from Longview Economics speaks volumes for where the equity markets are in the investment cycle based on Bob’s logic.
Goldman Joins, Morgan Stanley, and the Atlanta Fed
Last week we noted that Morgan Stanley and the Atlanta Fed sharply reduced their estimates for Q3 GDP. Goldman Sachs is now joining them. Per Goldman: “.. we have long highlighted that the fiscal impulse will fade sharply .. it might take a while for spending to recover in still-depressed categories .. we have lowered our forecast for 2021Q4 consumption growth by 2.5pp to 3.5% … We now expect GDP growth of 3.5% in Q3″
In mid-August Goldman Sachs was expecting Q3 GDP growth of over 8%! The effects of 7+million losing unemployment benefits and the removal of the moratorium on evictions have yet to be felt. Both actions will likely further complicate forecasting going forward and weigh on economic growth.
Volatile Auto Sales
The graph below shows the recent volatility in auto sales over the past year and a half. After plummeting to 40-year lows at the onset of the pandemic, auto sales roared back to 15-year highs. Since then they have fallen nearly 30%, sitting at levels consistent with previous recessions. There are a few factors wreaking havoc on this data including pent-up demand, massive fiscal stimulus, and car/truck shortages. It is being said chip shortages for auto could last well into 2022 and possibly 2023. Given the shocks to demand and supply of autos, we caution not to read too much into this chart. That said, the industry is important as it accounts for about 3-3.5% of GDP and about 4.5% of jobs.
September 7, 2021
Ready for a SnapBack?
Michael Queenan (@mjqueenan) provides yet another reminder the S&P 500 is extremely stretched from its trend. Per his tweet: “For anyone tracking, this is now the second-longest the $SPX has gone without touching the daily 200 EMA. April 1958 to June 1959 (289 bars) is the longest. We are currently up to 213 bars.”
Bond yields are about 4-5 bps higher this morning despite little market news or movement in the equity markets. Some of the sell-off may be attributable to dealers setting up for the upcoming 10 and 30-year Treasury auctions. Tomorrow the U.S. Treasury will auction $38 billion 10-year notes. They will follow it up on Thursday with $24 billion in 30-year bonds. Since Wall Street banks and brokers are the prime distributors of the auctions, they tend to sell or short bonds in the day(s) preceding auctions and buy them back at auction. This can work to their advantage as bond prices often weaken prior to auctions allowing them to purchase bonds at lower prices than they sold them. While the pattern doesn’t always play out as described, some investors seeking to make some trading profits will mimic dealer behaviors.
According to Bank of America, with $3.2 trillion of assets held by private clients, allocations to bonds are at an all-time low of 17.7%. At the same time, stock holdings are at an all-time high of 65.2%. Assuming the data is representative of most individual accounts throughout the banking /brokerage system, which seems plausible, there is a lot of fodder for a bond rally at the expense of stock prices.
Week Ahead
This holiday-shortened week will be light on economic data. On the heels of the employment report, the BLS JOLTs report on Wednesday will tell us if the record number of job openings continues to increase to new records or are they starting to get filled. With over 7 million people losing benefits we suspect the demand for jobs will increase. Of importance, on Friday the BLS will release Producer Prices (PPI). We believe the market and many Fed members are increasingly worried inflationary pressures are overstaying their “transitory” welcome. PPI will also shed light on rising input costs for manufacturers. CPI will be released a week from today.
So, was the gain of 235k jobs normal? The graph below compares the monthly change in jobs as a percentage of the workforce to the median percentage over the last 70 years. As we highlight below, 235k job growth is perfectly normal.
Taxing Stock Buybacks
An idea floating around Democrat circles in Washington is taxing stock buybacks or treating them as taxable dividends. Is it likely? Probably not, given the massive lobbying efforts of corporate America. However, if they are able to pass such legislation, a key driver of stock prices may have a limited effect going forward. While we think the odds of passage are low, this bears watching closely.
Underwhelming Jobs Report
The BLS Employment Report fell short of expectations with only 235k jobs added versus estimates of 750k. Despite the relatively minimal number of jobs added, the unemployment rate fell from 5.4% to 5.2%. The participation rate is unchanged at 61.7%. Hourly earnings were higher than expected at +0.6% versus +.04% last month. While positive for employees, higher wages, if sustained, will pressure corporate earnings and can put further upward pressure on prices.
So what does this report mean for the prospects of tapering? Chair Powell has repeatedly said taper will come with significant improvement in the jobs market. While the August number was well below expectations, the unemployment rate fell by 0.2%. Further, the average gain for the last three months, including today’s data, is +750k. That is about 3x the rate of pre-pandemic levels. We should also keep in mind, there are a lot of seasonal factors in August. In an odd year like this one, the seasonal adjustments can wreak havoc on the data. Today’s report may cause Powell to pause, but we suspect many other Fed members are concerned about inflation. The strong wage growth will only further their concern that inflation may be more than transitory.
Our guess is the market will push out expectations for tapering QE to a November-January time frame. Despite the poor data, bonds are trading poorly this morning which affirms our taper forecast.
The chart below from the BLS provides some context for the pace of jobs recovery by industry.
The graph of the VIX (volatility) below highlights a fairly reliable pattern that has been occurring mid-month for the last year. As shown, VIX tends to decline into the middle part of most months, rally sharply for a few days, and head lower again. The pattern has been especially pronounced the last three months. One likely cause is the combination of mid-month options expiration and low volumes. The volume of trades needed to cover and roll options contracts may be enough to push volatility higher at these times.
September is thus far looking to repeat the pattern. A nice short-term trade may again occur if VIX approaches the 16.00-16.50 range later next week. 16 has been the recent floor so if you do get long the VIX and try to take advantage of the pattern, keep risk targets in place below 16.
Deteriorating Optimism
Shown below, courtesy of the Daily Shot, the Citi Economic Surprise Index continues to decline. Any reading below zero denotes economists’ forecasts are too optimistic. The recent string of weaker economic data has caught them off guard. Despite the implications of weakening economic growth, the positive correlation between the graph and stock prices has significantly deteriorated over the last year.
September 2, 2021
GDP Guesstimates Falling Rapidly
The Atlanta Fed’s estimate of third-quarter economic growth fell sharply for the second time in a week. To blame were Factory Orders coming in at +0.4% versus +1.5% last month and a change in real net exports. As shown below, their estimate is now at 3.7%, down from over 6% about a week ago. The consensus remains at 6.5%.
It appears Morgan Stanley is in agreement with the Atlanta Fed. Per Zero Hedge: But if Goldman was a surprise, what Morgan Stanley did this morning – when the bank slashed its Q3 GDP from 6.5% to just 2.9% – was shocking.
“Tightness in the US natural gas market is beginning to manifest itself in low inventory levels. After having started the year at a 200 bcf surplus to the five-year seasonal average, US inventories now stand at nearly a 200 bcf deficit. Given the current trajectory, our models suggest we could end the injection season at 3.2 tcf of gas representing a 400 bcf deficit, or 700 bn cubic feet lower than the same time last year. If we are correct, inventories run the risk of starting the withdrawal season at the second-lowest level in fifteen years. At that point, any bout of cold weather this coming winter would likely lead to a price spike.”
As shown below, the price of Natural gas is up significantly in recent months. Assuming the deficit of gas persists, a colder winter might briefly push its price to the highs of 2019, 2014, or possibly higher. It’s worth noting the price of natural gas doesn’t always rise in the winter. Of the 10 years shown, over half saw stable or falling prices during the winter months.
Valuation Re-examined
In Valuations Are Extreme Even With Rose Tinted Glasses, we take a new approach to calculating stock valuations. We forget history and assume “this time is different” has merit. Accordingly, we throw out scary graphs like the first three below which compare current valuations to past periods. Instead, we only compare valuations to valuations in the same ten-year period. The math is different, but the overvaluation story is not. The last graph shows that even with rose-tinted comparisons this time is not different. Valuations are extreme no matter your logic.
September 1, 2021
ISM Bucks The Trend
Unlike weakening manufacturing surveys from other countries and various regional surveys within the U.S., the ISM manufacturing survey is slightly higher versus last month (59.9 vs 59.5). In a sign shortages are abating, inventories rose to their highest level since 2018. The only concern in the report is employment fell back to contractionary levels at 49. The broad ISM index, while off the peak from earlier this year, is still near the highs of the last 20+ years. The lesser followed PMI Manufacturing survey is slightly higher than ISM, but lower versus last month (61.1 vs 63.4).
The ADP report is well short of expectations at +374k jobs versus expectations for over +600k. The coming BLS report and ADP have not been well correlated over the last year, so do not read too much into this report. However, the timetable for taper hinges in part on continued substantial improvement in the labor market. A corresponding weak number in the Friday BLS data will likely push back market expectations for the start of tapering QE.
TIPS
Over the last year, we have gotten a lot of questions on TIPS. In particular, readers want to better understand how they can protect themselves from inflation. Lyn Alden has an excellent paper describing how TIPS work as well as their pros and cons. CLICK HERE to read it.
In the article, she stresses that while TIPS can provide some protection when inflation is greater than expectations for inflation, they are still likely to result in a decline in purchasing power. One reason is the BLS CPI Index does not accurately capture inflation. Two, the yields on all TIPS are now negative. Negative carry offsets some of the bond’s inflationary benefits.
Negative Real Yields In Germany
The graph below compares the German central bank main rate (similar to Fed Funds) versus year-over-year inflation. Like the U.S., its lending rate is at zero and CPI is soaring. The last time their CPI was at its current level in the early 1990s, the lending rate was about 6%. Not shown, German 10-year bonds yield -0.40%, resulting in a real yield of -4.40%. Absurdly low-interest rates and rising inflation is a global phenomenon and one that could prove dangerous if the recent rise in inflation is not transitory.
August 31, 2021
Plunging Confidence
Consumer Confidence affirms the University of Michigan survey that consumer confidence is falling quickly. The Conference Board’s Confidence reading was 113.8 versus expectations of 123, and a prior reading of 129.1. Both the present situation and expectations components fell by approximately 10 points. The clue as to why confidence is fading lies in the survey’s inflation expectations reading. One year inflation expectations rose from 6.6% to 6.8%. also in the report, the number of consumers saying jobs are plentiful fell slightly. Those answering jobs are hard to get rose slightly.
Another Weak Survey With Inflationary Implications
Over the last week, regional manufacturing surveys have been weaker than expectations. Today, the most followed of the regional surveys, Chicago PMI, fell to 66.8 from 73.4. Unlike China, the deterioration in these indexes appears supply-related. Order backlogs, for instance, have the largest increase. In fact, it is at its highest level since 1951! At the same time, production has the largest decline. The good news is inventories rose, but at 48.8 they still signal contraction. Prices paid rose to 93.9 a 40+ year high. New orders fell which is potentially a signal that demand is weakening from its torrid pace. Overall the report leads us to believe inflationary pressures are continuing.
The report has an interesting question as follows: “With enhanced Unemployment Insurance benefits set to expire in September, are you forecasting an increase in your staffing levels?” The answer: “The majority said they were not.”
Markets Extend Winning Record
Worrisome Signs From China
China continues to show signs of slower economic growth ahead. Its PMI Manufacturing Survey is clinging to expansionary territory at 50.1 vs expectations of 50.2. Both the Non-Manufacturing (47.5) and the Composite Survey (48.8) fell below 50, signaling economic contraction. In addition to the negative effect of Delta variant, China is also to blame for the weaker surveys as they are steadily imposing new regulatory laws limiting certain types of businesses and activities. The actions are meant to improve their economy in the long run, but in the short run, they will come at a cost. The latest round of legislation imposes more control over private equity funds and limits public stock offerings from these funds. Other recent laws including limiting the time children can play video games, curbing capital expansion in entertainment, and more closely enforcing IP violations.
Inflationary Headlines are Fading
Despite the highest inflation rates in decades, the scary “Brace For Inflation” headlines are fading. The interesting graph below, courtesy of Arbor Research, compares the ratio of articles saying inflation will rise versus it falling.
August 30, 2021
More Divergence
In the aftermath of Powell’s speech last Friday, investors are clearly favoring large-cap growth. The S&P and NASDAQ closed up by .44% and 1.13% respectively, while the Dow is slightly lower and Russell 2000 off by .50%. Given Powell’s dovish tone, we wrongly suspected cyclical sectors and small caps would trade better. Market breadth remains poor as the generals are leading the way higher. Apple is up 3% and Facebook and Amazon are up over 2%. There were more declining stocks on the NYSE than advancers.
Atlanta Fed-GDP Now
The Atlanta Fed revised its GDP-Now forecast from 5.7% to 5.1% in large part due to slowing personal consumption. The Delta variant is resulting in weaker dining and hotel spending but that is not the only problem. The recent torrid pace of spending is unsustainable and normalization is inevitable. The economic headwinds in addition to Delta, in our opinion, are as follows:
The graph below from Tavi Costa, charts the ratio of earnings over price. As he shows, investors are paying quite a premium for earnings. Most likely in the future, either earnings grow sharply or prices correct. As Tavi shows, the last four instances with similar yields were not market-friendly. Maybe this time will be different?
Watching The Paint Dry
Normally those Wall Street traders not sunning in the Hamptons watch the paint dry in trading rooms during the week preceding labor day. With the Fed providing more clarity on taper, that should be the case this year as well. However, the ADP and BLS employment reports come out Wednesday and Friday respectively. Given many Fed speakers are making it clear continued improvement in employment is the key to start tapering, we might see some fireworks this week. After a relatively weak report last month, ADP is expected to rise from 330k to 500k. Economists expect the BLS to show 650k more jobs in the workforce. With many unemployed people losing federal and state unemployment benefits, the incentive to find a job is higher which may lead to larger than expected additions to the workforce.
Also of interest this week will be the reaction of Fed speakers to Powell’s vague comments involving a taper timetable. We suspect dissension in the ranks will become more vocal over the coming weeks.
August 27, 2021
Ambiguity
Investors were fretting the Jackson Hole symposium would result in a firm timetable for an aggressive tightening campaign beginning as early as September. As seen in Powell’s comments below, what it got was more ambiguity around timing and amounts. After Powell’s speech, Fed Governor Harker continued on with vagueness around taper as follows: “The Fed has reached an agreement that tapering will begin this year.”
The Oracle Speaks
Chairman Powell’s much-awaited speech is being met with optimism in the markets. In particular, the following line is assuring investors the Fed will not be aggressive with tapering QE. In regards to premature tightening he says: “Today, with substantial slack remaining in the labor market and the pandemic continuing, such a mistake could be particularly harmful.”
Below are two key segments from his speech:
We have said that we would continue our asset purchases at the current pace until we see substantial further progress toward our maximum employment and price stability goals, measured since last December, when we first articulated this guidance. My view is that the “substantial further progress” test has been met for inflation. There has also been clear progress toward maximum employment. At the FOMC’s recent July meeting, I was of the view, as were most participants, that if the economy evolved broadly as anticipated, it could be appropriate to start reducing the pace of asset purchases this year. The intervening month has brought more progress in the form of a strong employment report for July, but also the further spread of the Delta variant. We will be carefully assessing incoming data and the evolving risks. Even after our asset purchases end, our elevated holdings of longer-term securities will continue to support accommodative financial conditions.
The timing and pace of the coming reduction in asset purchases will not be intended to carry a direct signal regarding the timing of interest rate liftoff, for which we have articulated a different and substantially more stringent test. We have said that we will continue to hold the target range for the federal funds rate at its current level until the economy reaches conditions consistent with maximum employment, and inflation has reached 2 percent and is on track to moderately exceed 2 percent for some time.
PCE
The Fed’s preferred inflation index, PCE, met expectations rising 0.4% in July. The level was 0.1% below the June reading. The year-over-year rate is 4.2%, which is more than double the Fed’s 2% inflation target.
The Fed is somewhat complacent on fighting inflation as they believe it’s transitory. They factor in the temporary impediments to the production and shipping of goods but think these problems will resolve relatively quickly. Bloomberg has an interesting article out which leads one to believe the supply problems may last longer than the Fed believes: The World Economy’s Supply Chain Problem Keeps Getting Worse. Here are a few noteworthy lines and a graph:
China’s determination to stamp out Covid has meant even a small number of cases can cause major disruptions to trade. This month the government temporarily closed part of the world’s third-busiest container port at Ningbo for two weeks after a single dockworker was found to have the delta variant.
“Port congestion and a shortage of container shipping capacity may last into the fourth quarter or even mid-2022,” said Hsieh Huey-chuan, president of Taiwan-based Evergreen Marine Corp., the world’s seventh-biggest container liner, at an investor briefing on Aug. 20. “If the pandemic cannot be effectively contained, port congestion may become a new normal.”
The cost of sending a container from Asia to Europe is about 10 times higher than in May 2020, while the cost from Shanghai to Los Angeles has grown more than sixfold, according to the Drewry World Container Index.
August 26, 2021
How Much Confidence Should We Have In Confidence Readings?
The graph below, courtesy of Rennassacience Macro Research presents quite the quandary. As we discussed last week, the widely followed Uof M Consumer Confidence fell sharply to levels below any seen in 2020. The lesser followed Langer confidence index continues upward. It’s difficult to fully understand why they are diverging, but we should note Langer rose steadily in 2019 and 2020 while the UofM indicator was flat. Other than that period preceding the pandemic, the two indicators are well correlated, including periods before the financial crisis and tech crash.
A day before Powell kicks off the Jackson Hole Conference, the host of the symposium, Esther George of the Kansas City Fed, is clear she wants to start tapering soon. Per her interview on CNBC:
“The U.S. economy has hit the necessary benchmark of “substantial” progress needed to start to slow down its $120 billion per month of asset purchases”
“My own view on that is that we have made substantial further progress and we can begin to talk to talk about backing off some of that accommodation”
“I would be ready to talk about tapering sooner rather than later”
She alludes that the timetable and amount of tapering will be on the agenda at the upcoming September 21-22 FOMC meeting.
Rinse Wash Repeat
The graph below from Northman Trader shows the predictable pattern the S&P 500 has fallen into over the last several months. The market grinds higher, hits an air pocket around the 15th of each month, and then sharply recovers and grinds higher again. The dips and surges all occur between the 14th and 19th of each month, corresponding with options expiration dates. Liquidity is poor as witnessed by light trading volumes, so heavier than usual options-related trade activity is driving price action on those days.
Bad Market Breadth
The Tweet below from Bespoke Investment provides yet more evidence the market is increasingly being driven higher by fewer stocks. Bad breadth is often an indicator of a coming market retracement.
August 25, 2021
Fading Delta
When the Fed announced the coming Jackson Hole Conference would be virtual markets jumped. The assumption being the Fed is worried about the variant and therefore likely to downplay taper given new vulnerabilities to the economy. The reality is that new Delta cases appear to be falling. The graphs below from IHME/University of Washington show confirmed infections are stabilizing or declining and IHME’s estimates are also moving lower.
The graph below, highlighting President Biden’s declining approval rating, is an important macro factor emerging on the horizon. There are two points in regards to his ratings worth keeping an eye on.
First, Biden will try to improve his ratings. Will he push legislation for even more fiscal stimulus or other economic boosting measures to win approval? In a similar vein, will he back off on tax increases?
Second, will some Democratic Senators and Representatives, especially those facing tight reelection campaigns in a year, start to shy away from the President? If so, winning their votes for infrastructure, the budget, or anything else will become tougher.
Savings Rate Normalizing
The savings rate spiked early in the pandemic due to the abundance of fiscal stimulus sent directly to individuals along with less consumption as important segments of the retail economy were shut down. Since then, additional savings and further rounds of stimulus boosted consumption and nominal economic growth to levels last seen in the 1950s. Both sources of economic activity are coming to an end which helps partially explain why consumer confidence fell sharply last month and retail sales have been weak. The economy is slowly but surely being left to stand on its own legs. Will the Fed hold of tapering QE as economic reality emerges?
Which ‘Flation?
The graph below from Arbor Research provides a clue for the recent decline in consumer confidence. Based on Google search data, the term stagflation is now the leading ‘flation search word. Stagflation entails weak economic activity coupled with inflation. Stagflation results in higher unemployment and negative real wage growth.
August 24, 2021
More Pressure on Powell
Add Bloomberg to the list of people and groups asking Powell to taper sooner rather than later. The powerful message from Bloomberg’s editorial board states the following:
He ought to nudge expectations in the direction suggested lately by some other top Fed officials. Short of making a formal announcement, he should say he’d prefer tapering to start soon and be completed by the spring.
It isn’t the right tool for current conditions, and leaving the program in place serves to narrow the Fed’s options as conditions change.
Asset prices have surged and the risk of bubbles and financial instability is growing. All this suggests it’s past time to start dialing back the Fed’s commitment to maximum stimulus.
2000 Redux
It is not just equity valuations that are near or have already exceeded levels from 2000. The graph below, courtesy of the Daily Shot, shows that investor willingness to bet against the market is also at levels last seen 20 years ago.
Richmond Fed
While a lesser followed manufacturing survey, the Richmond Fed confirms the slowdown that other similar surveys are relaying. Per the Richmond Fed: “The composite index declined from 27 in July to 9 in August but remained in expansionary territory, as all three component indexes — shipments, new orders, and employment — decreased but remained positive. However, several manufacturers reported deteriorating local business conditions.” There was some good news. The wage index hit a record high which should help those workers offset inflation and possibly boost consumption down the road.
As Market Ear’s graph below shows, the season of higher volatility is upon us. Their seasonality graph jibes well with others that show markets tend to have their worst few months of the year during September and October.
A Bigger Short
It has been revealed that Michael Burry, portrayed in the book and movie The Big Short, has a large short position in U.S. Treasury bonds. His stance is not surprising given he has been vocal about inflationary concerns. Burry’s expectations are largely in line with Wall Street. Per a Bloomberg article on this topic: The median forecast in a Bloomberg survey is for the 10-year yield to end the year at 1.60%…”
Bill Farrell rule #9- “When all the experts and forecasts agree — something else is going to happen”
Office Space Trouble?
The graph below, courtesy of Jim Bianco and Kastle, shows that well over half of the office space in major cities is being underutilized. Per Kastle’s data, nationwide only a third of office space is being used and no major city is above 50%. If the trends do not revert to normal over the coming year or two, the amount of vacant office space will become problematic, especially in the larger cities.
IPO Frenzy
The following graph and commentary from GMO, show that over the last year corporations have been taking advantage of higher share prices. Interestingly, IPO issuance is currently running at the same pace as the market peak in 2000. Massive issuance from existing stocks is largely responsible for the big difference between total issuance today versus 2000.
August 23, 2021
The heat map below, from the RIA Pro Dashboard, is a good way to monitor the breadth of the market. Despite the Nasdaq rising nearly 1.50% and the S&P .85%, the map shows there were a good number of stocks lower in the more conservative, lower beta sectors such as utilities, healthcare, consumer goods, real estate, and consumer cyclical sectors. Despite weakness in the aforementioned sectors bonds were flat on the day.
The August PMI Flash Composite Economic Survey fell to 55.4 from 59.9, an eight-month low. The bulk of the decline was attributable to the services industry. Many other nations and regions saw declines in their PMI reports. Australia was the most pronounced, falling from 56.9 to 51.7. The combination of weaker growth from China and Covid related lockdowns is weighing on their economy. Japan fell deeper into contraction (below 50) with a composite reading of 45.9 versus 48.8 in July. Europe held up well, only falling to 59.5 from 60.2.
Unlike the PMI reading, the Chicago Fed’s National Activity Index rose to +.53 from +.09. As the graph below shows, it continues to oscillate around trend.
The big event this week is Chairman Powell’s speech at the Fed’s Jackson Hole conference on Friday at 10 am. Investors will be looking for any signs Powell is moving closer toward tapering in the coming months. It is possible he shares little, instead preferring to wait until the September 22 FOMC meeting. At that point, the Fed will have another round of employment and inflation data in hand.
On the economic calendar existing and new home sales will be released on Monday and Tuesday respectively. Durable Goods come out on Wednesday, followed by Personal Income and Spending on Friday. Also on Friday, the PCE price index for July will be released. PCE is the Fed’s preferred measure of inflation. In June PCE rose 0.5%. It is expected to rise 0.4% in July.
After rising rapidly in late 2020, new home sales are back to pre-pandemic levels as shown by the blue line in the graph below. Despite normalizing sales, shares of homebuilders D.R. Horton (DHI) and Lennar (LEN) are 61% and 59% respectively above pre-pandemic levels. This chart is just one of many examples where share prices are not reflective of underlying trends.
The graph below shows the small-cap- IWM (Russell 2000) index is now below its 200 dma for the first time since rising above it nearly a year ago. The S&P 500 is still 10% above its 200 dma, while the NASDAQ is nearly 15% above its. As we have pointed out on numerous occasions, this is another warning that markets may be on the cusp of a downtrade.
Dallas Fed President Robert Kaplan, a strong proponent of tapering in the coming months, put the markets on alert that taper may not be as inevitable as many investors believe. Per Reuters: “any economic impact from the Delta variant of the coronavirus and he might need to adjust his views on policy “somewhat” should it slow economic growth materially.”
The problem with his statement is in trying to discern why economic activity is slowing. Delta is certainly playing a role, but fading stimulus, reduced consumer confidence, inflation, China, and a sharp reduction in pent-up demand are also weighing on the economy. Delta may be a convenient excuse for the Fed to delay tapering until next year. The initial market reaction to his comments was positive.
As we have noted China’s economic activity is weakening. The message is not lost on its equity markets. Hong Kong’s Hang Seng Index is now officially in bear territory, down 20% from its February peak. The S&P 500 is up 10%+ over the same period.
Zero Hedge put out an interesting piece titled Morgan Stanley Spots a Flashing Red Market Risk warning about option gamma flip points. Morgan Stanley says gamma “flips to short below 4250. That is where we could hit an air pocket.” On Monday, in our Gamma Band Update, Erik Lytikainen pegged the S&P 500 gamma flip level at 4205. The gamma flip point is where dealers, on average, have to sell stocks versus buying them to hedge their options books. Given the increased volume in options, and call options, in particular, these flip points provide a level where the recent bout of selling could accelerate. In addition to key moving averages which have served investors well recently, gamma flip points another level of technical guidance worth following closely.
After a relentless grind higher, some key manufacturing metals such as copper and iron ore have begun to fall in price. Copper for instance is trading at $4.00, down from a high of $4.80 in early May. Iron ore is down 30+% over the same period. Not surprisingly the Australian dollar is also trading weaker as it is a large exporter of metals and minerals. China, whose economy has been slowing markedly, accounts for 42% of Australia’s exports. The second leading country they export to is Japan, constituting only 13%.
Despite the declines in some key industrial metals, the well-followed CRB commodity index, shown below, has yet to break its uptrend. The index is weighted 41% to agricultural products, 39% to energy, 13% to industrial metals, and 7% to precious metals.
August 19, 2021
The graph below is 30-year UST yields with its 50 and 200 dma’s. The vertical lines highlight the last five times, 30 year yields have witnessed its 50 dma falling below its 200 dma, also known as a “death cross.” In 3 of the last 4 death cross instances yields fell appreciably and reached record lows. The only time they didn’t was in 2017 (red vertical line). At that time yields consolidated to negate the death cross. As shown, on Monday 30-year yields witnessed a death cross.
Ford, Toyota, and Volkswagen are trading lower on plans to cut production in September due to the ongoing chip shortage. The Delta variant will only further complicate existing shortages.
Per Barons: Production woes have hit Infineon, a German chip maker and major supplier to the car industry, which said earlier this week that plant shutdowns in Texas and Malaysia have caused deliveries to core auto clients to fall, according to reports.
Ford’s decision to shutter the Kansas City plant was rooted in shortages related to the pandemic in Malaysia, according to the Reuters report.
The “Buy the Dip” (BTD) graph below from the Daily Shot, shows each consecutive market drawdown since the pandemic has fallen less than the prior one. Consequently, the VIX volatility index (graph on right) has a similar pattern. Investors and algorithms are increasingly quicker to buy dips and short volatility as such behavior has been rewarded with profits. The risk going forward occurs if the market keeps falling despite dip-buying, forcing traders to cover leveraged positions and unleashing new behaviors detrimental to prices. Until then, BTD!
Volatility experts at Spot Gamma had this to say about the graph- “The longer volatility is suppressed the more it’s going to pop.”
An increasing number of companies are hopping on the crypto bandwagon and allowing their customers to use crypto on their sites. Software company Palantir recently reported, that in addition to crypto, they will now accept gold. Further, they bought about $51 million dollars worth of gold. Per Bloomberg, COO Shyam Sankar said: “Accepting nontraditional currencies “reflects more of a worldview,” Shyam Sankar, the chief operating officer, said in an interview. “You have to be prepared for a future with more black swan events.”
August 18, 2021
The Fed shed little new light in the FOMC minutes in regards to the schedule and pace of Fed taper. While some Fed members seem eager to start tapering as soon as September, others voiced concern about downward inflation pressure and how the market may perceive tapering. We look to the Jackson Hole Fed conference late next week for more guidance.
Highlights from the Fed minutes from the July 28th FOMC meeting:
“Most participants noted that, provided that the economy were to evolve broadly as they anticipated, they judged that it could be appropriate to start reducing the pace of asset purchases this year.”
“They are worried that accelerating plans to wind down the asset purchases could lead investors to question whether the Fed is in a hurry to raise rates or less committed to achieving lower unemployment.”
SOME PARTICIPANTS REMAINED CONCERNED ABOUT THE MEDIUM-TERM INFLATION FORECAST AND THE PROSPECT OF MAJOR DOWNWARD PRESSURE ON INFLATION RESURFACING.
“Several others indicated, however, that a reduction in the pace of asset purchases was more likely to become appropriate early next year”
“Most participants remarked that they saw benefits in reducing the pace of net purchases of Treasury securities and agency MBS proportionally in order to end both sets of purchases at the same time.”
“The staff provided an update on its assessments of the stability of the financial system and, on balance, characterized the financial vulnerabilities of the U.S. financial system as notable. The staff judged that asset valuation pressures were elevated. In particular, the forward price-to-earnings ratio for the S&P 500 index stood at the upper end of its historical distribution; high-yield corporate bond spreads tightened further and were near the low end of their historical range; and house prices continued to increase rapidly, leaving valuation measures stretched.”
The Fed’s Reverse Repurchase Repo program set another new high at $1.116 trillion. The increasing trend points to the large and growing amount of cash being held at banks and money market funds. These massive balances are a green light of sorts for the Fed to taper. The large amount of cash on the sidelines will help offset the Fed buying less.
Housing Starts were weaker than expectations at 1.534 million annualized versus 1.643 million last month. Higher input prices and a growing reluctance to buy homes are likely causing home builders to scale back. Building permits were up slightly to 1.635 million. Given the increasing supply of existing homes, higher home prices, and weakening consumer sentiment we might find that some builders will reconsider and delay using the permits to build.
Since February, the Russell 2000 (IWM), tracking small-cap stocks, is little changed. Over the same period, the S&P 500 has risen by over 20%. The smaller graph below shows the underperformance of small caps to the S&P via the IWM: S&P price ratio. Many small-cap companies are feeling the negative effects of higher prices and are not able to offset inflation with lower interest rates to the degree large-cap companies can. Stripping the S&P 500 of the FANMG stocks and a few other leaders would leave the S&P 500 looking a lot like the Russell Index. This serves as a reminder of Bob Farrell’s investment rule #7: Markets are strongest when they are broad and weakest when they narrow to a handful of blue-chip names.
The graph below, courtesy of Goldman Sachs, shows the strong negative correlation between the price of gold to 10-year UST real rates. Recently, the correlation has failed. If the correlation regains its prior strength, the graph implies gold is underpriced by nearly $300, real rates are about to rise, or some combination of both. Real rates increase if Treasury yields rise and/or inflation expectations decline. We suspect it will be the latter.
August 17, 2021
Chairman Powell, speaking to educators today, had little to say about the future path of monetary policy. It looks like we will have to wait for next week’s Jackson Hole conference to see if he agrees with many Fed members that taper is in the cards for this fall. The following headline is the only clue he left us:
THE FED IS IN THE PROCESS OF PUTTING AWAY ALL OF ITS TOOLS THAT WERE BUILT FOR TRUE CRISES.
Retail Sales can be a misleading data point as it doesn’t account for inflation. For instance, if inflation was 5% and retail sales grew by 5%, 100% of the growth in retail sales is due to price increases, not more consumption of goods. The graph below takes the inflation component of sales to give us a clearer reading of true sales. Core retail sales exclude vehicle and vehicle parts, gas stations, and building materials. At a 3.4% annualized growth rate, real core retails sales are back to near pre-pandemic levels.
July Retail Sales came in at -1.1%, versus expectations of -0.2% and +0.7% last month. Excluding autos and gas retails sales fell by 0.7% versus expectations of a 0.3% decline. The weaker than expected data should not be a total surprise as BofA and JPM credit card spending tracking data has shown a decent drop-off in credit card usage.
Per Arbor Research, the University of Michigan’s Consumer Survey reported that buying conditions for durable goods, homes, and vehicles are at the lowest levels since 1980.
Economic data from China continues to come in weaker than expectations. China is the world’s second-largest economy and has been an important driver of global economic growth. While many developed economies continue to post outsized growth, China is flashing warning signals. This past weekend China reported the following:
Industrial Production 6.4% versus expectations of 7.8% and prior month 8.3%
Chinese Retail Sales 8.5% versus expectations of 11.5% and prior month 12.1%
Chinese Fixed Assets Investment excluding rural 10.3% versus Expectations of 11.3% and prior month 12.6%
The graph below serves as another reminder that valuations are at extreme levels. However, despite the graph below and many other valuation techniques at or near records, the market can get more expensive. Pay close attention to technical indicators to help navigate the current environment.
Sunday marked the 50th anniversary of the “Nixon Shock.” On August 15, 1971, President Nixon eliminated the convertibility of U.S. dollars to gold and thus removed the U.S. off of the gold standard. 5 years ago we wrote on Nixon’s decision and importantly the consequences in The Fifteenth of August. From the summary:
“Now, seven years after the end of the financial crisis and recession, these consequences are in plain sight. The Fed finds themselves crippled under an imprudent zero interest rate policy and unable to raise interest rates due to fear of stoking another crisis. Worse, other central banks, in a similar quest to keep prior debt serviceable and generate even more debt-induced economic growth, have pushed beyond the realm of reality into negative interest rates. In fact, an astonishing $10 trillion worth of sovereign bonds now trade with a negative yield.”
“With the August monthly options expiration on deck for this Friday, we may be looking for an options expiration “pin” near 4,500 as long as price remains near the current levels above the gamma flip.”
Retail Sales will be the important economic data point for the week. On Tuesday it is expected to show a 0.3% decline, yet despite the decline is still expected to be +11.5% versus last year. Given last Friday’s weak consumer confidence data, Retail Sales could surprise to the downside. Recent real-time credit card tracking data points to such a recent drop-off in consumer spending.
Fed Chair Powell will speak Tuesday afternoon. Many Fed members have been increasingly outspoken about the need to taper sooner rather than later. The market will pay close attention to see if his comments shift toward a more definitive time frame for tapering. The Fed’s annual Jackson Hole conference is at the end of next week, so this speech can provide a good chance to warn the markets of a coming change in stance. The Fed’s minutes from their prior meeting in late July will be released Wednesday afternoon.
August 13, 2021
Peter Atwater, a leading expert in market sentiment, provides us with his recent Financial Insyghts subscriber-only article discussing how diversification is not just a function of the correlation between various assets in a portfolio, but equally important, as Peter writes, “a variety of feelings associated with those assets.”
The University of Michigan Consumer Sentiment Survey plummeted from 81.2 to 70.2, the lowest level since 2011. Inflation expectations for 1 year forward were unchanged at 4.6%. It’s not clear whether consumers are suddenly concerned because of higher prices or the Delta variant. Either way, the report paints a grim picture for personal consumption which represents about 2/3rds of GDP. We will pay close attention to near-real-time credit card spending data and other consumer surveys to see how accurately Michigan’s survey is tracking reality.
From an investment perspective, the big question facing many companies is whether or not they can pass on higher prices to consumers. While each industry is different, the graph below shows retailers are more confident than anytime in the last 15+ years they will be able to raise prices and protect their profit margins.
The graphs and tables below break down the 153 components of inflation to provide a broader analysis of the recent July CPI data compared to June. At the headline level, monthly CPI fell to 0.5% from 0.9%. The average price of the 153 goods comprising CPI fell from 0.63% to 0.42%. However, the median price rose by 0.20% to 0.50%. Further, nearly 70% of the goods saw percentage price increases less than the CPI rate in June. In July that number fell to just under 50%. Also note, the average and median increases in the year-over-year changes rose significantly from June to July. The headline CPI number is supportive of those in the transitory inflation camp, but the underlying data is not as clear. Yesterday’s PPI data provides further concern that inflation may not have peaked yet.
The series of graphs below from Brett Freeze show the demand for money is weak. As we wrote in Inflation: Making the Complex Simple, “To correctly anticipate inflation, we must look beyond the supply and demand for goods and services. The truth lies in the supply and the demand for money. Unfortunately, the supply of money gets the headlines, while its demand is an afterthought.” Over the last few months, inflationists have been dwelling on the surge in the supply of money. They fail to notice that velocity, or the demand for money, both consumer and commercial, has been weakening and largely offsetting the supply. The year-over-year growth of the supply of money has been declining and will continue barring an unexpected increase in the amount of QE or more massive fiscal spending packages. Will the demand for money increase and offset the declining money supply growth?
August 12, 2021
As shown below Producer Prices (PPI) were stronger than expected. On a monthly basis, PPI and core PPI was the same as last month- +1.0%. The graph below shows PPI-commodities have been outpacing CPI since the recovery began. This is no doubt resulting in margin compression for many companies reliant on commodities to manufacture their final goods.
Yesterday Doug Kass shared a rant from his Real Money Pro subscription service on Twitter. He discusses the deleterious effects of excessive monetary and fiscal policy and joins the growing list of industry leaders imploring the Fed to stand down. We put his comments into the following link:
The Bloomberg graph below compares job openings from JOLTS and the NFIB small business survey. The NFIB confirms that there are plenty of jobs for the unemployed to fill. The question however is why are they not taking the jobs. Is it related to covid and related medical issues or are the generous unemployment benefits providing an incentive to stay at home? It might also be there are not enough qualified workers to fill the jobs? Either way, the situation is likely much more of a fiscal/legislative matter than one monetary policy can fix. This argues the Fed should commence tapering sooner rather than later.
As Nordea Bank shows, money supply growth is slowing which is resulting in a reduction of excess liquidity. The graph shows excess liquidity, with a 6 month lead time, has been well correlated with P/E ratios. If the correlation holds we should expect P/E compression in late 2021 and 2022.
August 11, 2021
Crude oil is trading 1.3% lower to $67.30 on a request from President Biden to OPEC. Per the WSJ- “The White House urged OPEC to boost oil production, saying recent planned increases are insufficient as countries around the world seek to emerge from the Covid-19 pandemic.”
After the last CPI report, we published “Just How Transitory is Inflation?” which provided a detailed analysis of what is driving the latest inflationary push. We showed how gasoline and used cars accounted for over half of the annual increase. In the latest report gasoline rose 2.4%, a tenth of a percent lower than last month. Used Car prices are finally cooling off. After rising 10.2% in June they only rose .2% in the July report. Other used car price indexes lead us to believe they will negatively contribute to CPI in next month’s report. It is important to note energy prices are delayed three months in the CPI report. Given the recent declines in crude and gasoline prices, we should expect energy to weigh less on CPI in upcoming reports. Of concern are rising rent and home prices as Shelter contributes almost 30% to the CPI index. The broad shelter category was up 0.4% last month versus 0.5% the prior month and is now up 2.8% on an annual basis. We expect an uptick in shelter prices following the end of the eviction moratoriums, but they should stabilize after that.
This report will help assuage inflationary fears as the largest contributors to inflation appear to be stabilizing or falling, as is the case with transportation services which are down 1.1% for the month, after rising by at least 1.5% in each of the last four months. We warn you, however, one month does not make a trend.
CPI came in slightly below expectations as shown below. The monthly inflation number was up 0.5%, the lowest increase since February and potentially a sign the inflationary surge in prices is abating. We will follow up with details later today as the BLS releases more underlying data.
Investor sentiment is showing signs of moderating as the timing of a Fed taper comes into question. Per Bloomberg, inflows into US buy-write funds of $1B in July were the most since 2012. Buy-write funds utilize an options trading strategy that profits most during periods with limited upside.
In the Bloomberg article linked above, Lu Wang wrote: “Call them cautious bulls — preparing for gloom, concerned about valuations, yet unwilling to completely bail. They’re hedging as growth slows and the Federal Reserve mulls rolling back monetary stimulus in a market that has gone nine months without a 5% pullback”.
The chart below from MKM Partners echoes the same tone. It shows bullish sentiment decreasing as the market recorded recent highs, a signpost of what MKM Partners describes as the “Reluctant Bull”.
“Risk-On” has been the mantra for the surge in the prices of risky assets since late March 2020. The graph below, courtesy of Nordea, shows an interesting divergence occurring between two “risk-on” favorites. The S&P continues to hit new highs yet junk bond yields are starting to rise (prices fall). Might junk bond investors be worried about the increasing odds of the Fed tapering, while stock investors brush it off?
August 10, 2021
What is full employment? The answer matters because the Fed warns they will taper when “significant progress” is made toward full employment. The Macrobond graph below, accompanied by the one we put out in yesterday’s commentary, argues we may be at or very close to full employment. In 2018 and 2019, when the Fed believed we were at full employment, there were more job openings than unemployed persons. With the recent round of JOLTS and employment data confirming a similar ratio, one may argue we are back to full employment despite the higher unemployment rate.
Mohamed El-Erian, former CIO at Pimco, wrote an editorial in the Washington Post imploring the Fed to end their “ultra-loose monetary policy” stance. The editorial follows Senator Manchin’s letter to the Fed in which he voices concern about their easy money policies and the hardships inflation can cause.
El-Erian’s article lays out five reasons the Fed’s overly aggressive policy might harm the economy over the next 12 months. They are as follows:
First, the Fed’s policy tools are ill-suited to address what is hampering the economy. The primary problem is widespread supply-side disruptions, from dislocated supply chains and higher input costs to transportation bottlenecks and difficulties in hiring workers.
Second, with both private and public demand already surging, the Fed’s policy stance risks fueling inflation.
Third, its continued massive intervention in markets has distorted the price signaling mechanism, encouraging all sorts of inefficient resource allocations that will eat away at the U.S. economy’s productivity and dynamism.
Fourth, the ample and predictable injection of cash into the system continues to encourage excessive risk-taking in financial markets while deepening the unhealthy conditioning among investors to always expect the Fed to boost asset prices.
Finally, the $40 billion of mortgages that the Fed insists on buying each month is contributing to a red-hot housing market that has been pricing out more and more Americans.
The chart below from Ned Davis Research compares the S&P 500 to a composite of three well-known market cycles: 1-year seasonal cycle, 4-year presidential cycle, and the 10-year decennial cycle. If the market follows these historical cycles, we should expect a weaker finish to the year. Note, the composite is in regards to trend and does not forecast the actual changes, ergo their note- “trend is more important than level.”
Per the headline below, Fed Governor Bostic affirmed what Chris Waller said last week in regards to employment and the timing of a potential taper. He also said he preferred a shorter taper period than prior episodes.
FED’S BOSTIC: THE FED COULD ACHIEVE ‘SUBSTANTIAL FURTHER PROGRESS’ ON EMPLOYMENT IF THERE ARE IS ANOTHER MONTH OR TWO OF STRONG JOBS GAINS
JOLTS data reported this morning shows there are now 10.07 million job openings a big jump from last month’s 9.3 million. The graph below puts the number of job openings and the number of jobs lost due to the pandemic in perspective. In April of 2020, the economy lost almost 20 million jobs. As of last Friday, it has regained about 14 million of those jobs and remains 6.5 million short. Job openings just eclipsed 10 million, meaning there are now 1.47 jobs per job loss since the pandemic. The Fed must be looking at this data and questioning if its monetary policy needs to stay uber aggressive.
Gold looks to open weak this morning but that is not even half the story. Last night, shortly after the futures markets opened, gold fell nearly $100. It bounced back quickly and has been slowly rising since. Silver also had a stunning decline and a huge recovery. It was down over 10% early last evening, yet is only down 1.5% this morning. Crude oil also had a rough night but not the same degree. Unlike the rebounding precious metals, it continues to leak lower. Crude oil now stands at $65.60 down nearly 4%.
Last week Fed Governor Waller said if the next two jobs reports come as strong as the June Report we can taper by September. Based on his opinion and last week’s strong July report, another good report on the first Friday in September may start the tapering process. With nearly 2 million new jobs added over the last two months, some Fed members are likely to join him this week in various speeches supporting the tapering QE.
All eyes this week will be on inflation data this week with CPI on Wednesday and PPI on Thursday. The current CPI expectation is for a small decline to 0.7% from 0.9% last month. Stronger than expected CPI and/or PPI data may further push Fed members to call for tapering QE. We will also keep an eye on JOLTs data on Monday for more evidence supporting strength in the labor market.
Joe Manchin, Democrat from West Virginia, wrote a letter to the Fed offering concern about their easy money policies and the hardships inflation can cause. Per the WSJ– “I am deeply concerned that the continuing stimulus put forth by the Fed, and proposal for additional fiscal stimulus, will lead to our economy overheating and to unavoidable inflation taxes that hard-working Americans cannot afford,” …. “He asked Mr. Powell and the Fed’s rate-setting committee “to immediately reassess our nation’s stance of monetary policy and begin to taper your emergency response immediately.”
We suspect other Congressional leaders, on both sides of the aisle, are harboring similar concerns. Given Powell’s term ends early next year and Congress must approve a new term, the pressure on Powell to reduce the pace of QE is mounting.
The BLS labor report was strong with the addition of 943k new jobs and a +88k revision to last month. The unemployment rate fell from 5.7% to 5.4%. Despite the strong growth, hourly earnings were unchanged from last month’s revised number as well as hours worked. It is worth noting that employment rose by 221k in local government education and 40k in private education. This is due to seasonal quirks due to the pandemic. Similar to the ADP report on Wednesday, leisure and hospitality were the main contributors adding 380k jobs, which also helps explain why wages are not increasing more. The initial reaction in the futures markets implies an inflationary bias with the Dow leading the way, S&P 500 flat, and the NASDAQ down. Bond yields are rising on the news. We suspect today’s report will spur further discussion about the Fed tapering as early as September or October.
In our article, Just How Transitory is Inflation, we showed which goods were largely responsible for driving CPI higher. While we acknowledge the difficulty of forecasting inflation in this environment, we came to the conclusion that most of the goods driving the recent price surge should fall in price in the coming months. To wit: “We think the current inflationary surge is temporary. When flexible prices, especially some of those mentioned, normalize, inflation is likely to follow suit.”
The graph below, courtesy of Arbor Research, provides some confidence for our expectations. It shows the prices of four key inflation contributors (two of which we detail in the article) and two pieces of inflation survey data finally appear to be peaking.
Apartment rent in metropolitan areas is increasing rapidly as workers return to cities, according to this report by the Wall Street Journal. Apartment List, a home search website, recently reported that median rent has risen over 10% in the last year. Camden Property Trust, a landlord in the Houston area, reported rent increases of 19% in July for new leases. A key factor contributing to rising rents is the state of the housing market as the economy reopens. Many individuals who would have otherwise purchased a home are being priced out of the market due to strong demand paired with lackluster supply, which is, in turn, bolstering demand for rentals. Investors appear to be exploiting this trend, as apartment REITs have outperformed the S&P 500 by almost 25% YTD.
August 5, 2021
As we noted in the Portfolio Trading Diary, Albermarle’s “GAAP EPS of $3.62 demolished the consensus estimate of $0.85.” The increasing demand for electric vehicles is driving lithium production and boosting ALB’s sales. If the chart below proves accurate, demand for lithium will continue to surge. ALB is the world’s largest lithium producer.
The graph below shows the historical correlation between the current ISM Manufacturing Prices index with 6 months forward S&P 500 returns and CPI changes. Currently, the ISM Prices index is at 85.7 and in the top decile, although slightly lower than last month. Based on the graph, stocks should be slightly lower over the next 6 months, and inflation running at 7.6% in March of 2022. Take this data with a grain of salt as the current supply/demand anomalies are unlike any of those in the past.
Initial Jobless Claims fell slightly to 385k this past week. The good news is new claims are down significantly from 800-900k at the beginning of the year. The bad news is they have been stuck at current levels for the last two months. As a comparison, the average weekly claims for 2019 were about 220k per week.
The new eviction moratorium extension will likely help keep a lid on core CPI through its expiration, as evidenced by the graph below from Andreas Steno Larsen. However, Primary & owners’ equivalent rent (OER/Rent), which makes up roughly 40% of core CPI, will likely push inflation readings higher when the moratorium is allowed to expire or if it is overturned by the Supreme Court.
On quite a few occasions we have talked about how the K-shaped recovery is benefitting wealthy individuals while other income classes are not benefitting to the same degree. As the Wall Street Journal writes in Heavyweight Companies Enjoy Outsize Rewards as Economy Rebounds, similar trends are occurring in the corporate world as well. The author provides a few examples of large companies thriving while smaller companies languish. We share the final paragraph, the story of a drone maker in Europe. Per the article: “Stefano Valentini, president of French manufacturer Drone Volt SA, said he is seeing strong demand for drones from large companies in Northern Europe and the U.S. in the wake of the pandemic, but little demand from Southern Europe, where small—and less capitalized—companies are the norm. For those companies, many of whom were slow to recover from the financial crisis, “Covid is the nail in the coffin,” he said.”
August 4, 2021
Fed Vice Chair Richard Clarida was nebulous in regard to his outlook for tapering QE. Per his speech today: “At our meeting last week, the Committee reviewed some considerations around how our asset purchases might be adjusted, including their pace and composition, once economic conditions warrant a change. Participants expect that the economy will continue to move toward our standard of “substantial further progress.” In coming meetings, the Committee will again assess the economy’s progress toward our goals. As we have said, we will provide advance notice before making any changes to our purchases.”
Fed Governor Bullard is following in Chris Waller’s steps saying the market is prepared for taper and does not expect a negative reaction when such an announcement is made. Further, he wants to move “earlier and faster on taper so the Fed could be in a better position to combat strong inflation.”
The ADP jobs report significantly missed expectations coming in at 330k versus expectations of 700k. Over the last year, ADP and this coming Friday’s BLS report have not had a great correlation. If the BLS report is similarly weak, recent talk of tapering QE as early as September may be pushed back toward the winter months. Of note in the ADP report, over a third of the net new jobs were in the leisure and hospitality industry which tend to be lower-paying. If the BLS shows a similar strong contribution, those jobs are likely to weigh on aggregate wages.
The graph below shows the two defensive sectors, staples (XLP) and utilities (XLU), are well correlated and both sitting at or near record highs. However, there is a noteworthy divergence occurring beneath the trading surface. 93% of the utility stocks in the ETF are above their respective 200 dma and that percentage has been steadily climbing for the last 2 months. Only 66% of staples stocks are above their respective 200 dma and the percentage has been steadily falling since May. The weakening breadth of XLP may result in relative weakness versus XLU, especially if inflation and inflation expectations remain high.
The stacked graphs on the left, courtesy of Arbor Research and the Daily Shot, show investors are clamoring for inflation insurance via the TIPs market. The top graph shows TIPs yields are trading at record low yields. The bottom graph shows TIPs have seen record inflows of cash while investment grade and Treasuries have seen large outflows. This helps explain why breakeven inflation rates have been rising. To recap, the yield on TIPs less the yield on a nominal Treasury equals the inflation break-even rate or rate where an investor is indifferent between either bond. As TIP yields fall more than UST yields, TIP investors are betting on more inflation. The third graph shows the growing divergence between 10-year TIPs and nominal bonds and the resulting rising breakeven rate.
August 3, 2021
The graph below, courtesy of Brett Freeze, shows the strong correlation of the ISM Manufacturing Survey with the year-over-year change in 10-year USTs. As we discussed yesterday, ISM remains at historically very high levels but is starting to decline. We expect it to decline further as fewer and fewer survey respondents will be able to continue to answer that manufacturing factors are again better in the current month than the prior month. If we are correct with ISM and the correlation holds up, a further decline in bond yields should be expected.
Yesterday we shared Fed’s Chris Waller’s hawkish stance on monetary policy. It is worth adding he has had a dovish stance similar to Powell up until that speech. While we doubt Powell will make such an abrupt turn in policy we will focus on Lael Brainard and Vice Chair Richard Clarida. Clarida speaks tomorrow. If he lays out similar goals and timelines as Waller, the speeches may be a coordinated trial balloon aimed at warning the market on the schedule of tapering QE.
Noah Smith, blogger and Bloomberg Opinion author, wrote a compelling article titled Why is China Smashing its Tech Industry. China has recently been punishing “tech” companies such as Alibaba, Ant Financial, Tencent, and Didi to name a few. At first blush, it may appear Chinese leadership harbors some of the same monopolistic concerns that are brewing in the United States. Noah thinks there is much more to the story. Per the article: “And so when China’s leaders look at what kind of technologies they want the country’s engineers and entrepreneurs to be spending their effort on, they probably don’t want them spending that effort on stuff that’s just for fun and convenience. They probably took a look at their consumer internet sector and decided that the link between that sector and geopolitical power had simply become too tenuous to keep throwing capital and high-skilled labor at it. And so, in classic CCP fashion, it was time to smash.”
Noah argues China is aiming for productivity growth, not profit growth, “fun, and convenience.” If true, China is playing the long macro-economic game which should greatly benefit their nation. While banning or even punishing ‘internet” companies is much less likely here, we should take notice of their desire for more productive growth.
August 2, 2021
Per the headlines below, Fed member Christopher Waller provided helpful guidance on the potential timing of tapering QE and what the Fed is looking for before tapering.
WALLER SAYS IF THE NEXT TWO JOBS REPORT COME IN AS STRONG AS THE LAST ONE, CAN TAPER BY SEPT; IF NOT, MAY NEED TO PUSH IT
WALLER SAYS ON TAPERING WE SHOULD BE EARLY, FAST, TO BE IN A POSITION TO RAISE RATES IN 2022 IF NEEDED
FED’S WALLER SAYS COULD MAKE AN ANNOUNCEMENT ON TAPER BY SEPT
I was in favor of tapering MBS first,” Waller says, adding, resignedly, that Chair Powell said in his press conference that it wasn’t an option.
The ISM Manufacturing Index fell to 59.5 versus expectations of 60.9 and last month’s 60.6 reading. Importantly, the prices paid sub-component fell to 85.7 from 92.1. Also of note, supplier delivery times fell 2.6 points. While early, it may mean supply line bottlenecks are easing. Employment rose to 52.9 versus 49.9. Employment is now in expansion mode as it’s above 50.
Fed President Lael Brainard indicates that the coming Jackson Hole meeting may lack any new indications about when the tapering of QE may begin. Per Lael; “I expect to be more confident in assessing the rate of progress once we have data in hand for September, when consumption, school, and work patterns should be settling into a post-pandemic normal.” She is an important voice at the Fed and is rumored to be in the running for the Chair job if Biden does not reappoint Jerome Powell for a new term.
The economic focus this week will be on the job market and the manufacturing sectors. The ISM manufacturing survey will be released this morning and the ISM services survey on Wednesday. We will keep a close eye on the inflation/prices and employment sub-components of the surveys. Wednesday will feature the ADP labor report followed on Friday by the all-important BLS jobs report. The consensus BLS forecast is for a gain of 900k jobs, following last month’s 850k.
Earnings reports will continue, but the pace should slow markedly versus last week. We expect a slew of Fed speakers this week further clarifying their individual thoughts around the economy, inflation, employment, and most important monetary policy. We will also be looking out for any possible policy changes announced at the late August Jackson Hole Fed meeting.
The excess savings racked up by Americans from trillions in stimulus payments is quickly waning. The chart below from Zero Hedge illustrates the effect of stimulus payments on personal savings over the past year and a half. Excess savings from the last round of stimulus is falling rather quickly, and as Zero Hedge notes, “… at the current rate that Americans are burning through savings, this means that the entire fiscal stimulus tailwind from Biden’s trillions will be gone by August… just in time for emergency unemployment benefits to end”. The upcoming fiscal cliff bears substantial risks to markets, especially as we move past the point of peak economic growth in this recovery.
The Chicago PMI surprised to the upside for July. It came in at 73.4 compared to expectations of 66.1 and a June reading of 66.1. The survey results suggest that, in July, business conditions improved more than expected in the Chicago area.
Personal income and outlays data were stronger than expected in June. Personal income increased 0.1% compared to a consensus estimate of -0.7%. Personal consumption expenditures increased 1% in June versus expectations of 0.6%.
The PCE price index increased 0.5% MoM (0.6% expected) and 4.0% YoY (4.1% expected). The core PCE price index, the Fed’s preferred measure of inflation, rose 0.4% MoM (0.5% expected) and 3.5% YoY (3.7% expected).
The toughest part of forecasting inflation is trying to properly assess the supply line problems and labor shortages. Wells Fargo put out a handy table recently, shown below, which tracks price pressures due to supply, inventory, shipping, and labor problems. Per Wells Fargo: “It suggests that bottlenecks are not yet easing in any widespread fashion, let alone close to being fully resolved”. The conclusions reached by Wells Fargo align with the reasons for missed expectations we saw in the second quarter GDP report yesterday.
Next week begins the weakest two months of the year for the markets, as shown below. While the graph below points to weakness, there have been plenty of prior Augusts and September’s that have produced positive returns.
July 29, 2021
NKLA founder, Trevor Milton, was charged with fraud this morning regarding lies to investors about breakthroughs and prototype vehicles. NKLA went public via SPAC in June 2020, thus Milton was not bound by the usual post-IPO restriction period on communication with investors. He quickly took to social media with the apparent intention of pumping the stock. According to MarketWatch:
“Prosecutors said in the initial period following Nikola starting to trade publicly, the value of Milton’s shares shot up by $7 billion”.
It doesn’t stop there.
“Prosecutors said that, in fact, the prototypes that had been unveiled didn’t function and were Frankenstein monsters cobbled together from parts from other vehicles. At public events, the vehicles were towed into position and were powered by plugs leading from hidden wall sockets”.
Milton has posted bail and proclaims his innocence. NKLA stock has sold off roughly 65% from its June 2020 highs.
Robinhood completed its IPO today and is trading under the ticker symbol HOOD. The stock opened in line with the IPO price at $38 per share after the indicated open fell from a high of $42 this morning. Based on the IPO price, HOOD is being valued at $32B.
Update: HOOD finished the day at $34.71 after retreating 8.7% from its open price. .
US GDP (initial) grew 6.5% in the second quarter versus expectations of 8%. This compares to first quarter GDP growth of 6.3%. PCE was above expectations at 11.8% versus the consensus of 11.4%. A key factor in the GDP miss was the decline in inventories, which highlights the supply-chain problems the economy is facing have yet to abate.
Initial jobless claims fell by 24k to 400k this week, slightly higher than expectations of 390k. Although weekly claims are falling, they remain elevated compared to levels you might expect to see in an improving economy.
The first estimate of second quarter GDP will be released this morning at 7:30 CT. This chart from The Daily Shot shows that economists’ estimates of GDP growth have been moderating in recent weeks.
The graph below charts the MBA’s mortgage purchase applications. These are the number of applications for mortgages, not the refinancing of existing mortgages. As shown, the number of applications has been steadily declining and now sits at pre-pandemic levels. The housing market is increasingly showing signs of normalizing. It is quite possible home prices will follow suit and begin to stabilize and possibly decline over the next few months.
The graph below, courtesy of Nautilus Investment Research, shows the current bull market rally, starting March 2020, is getting into rarefied territory. The market has gone 337 days without a 10% retracement. Of the 135 instances in the study, only ten bull market runs have been longer in duration, and of those, only two have gone up a higher percentage.
July 28, 2021
Changes to the FOMC statement are highlighted below. While most of the changes are inconsequential, they added the following to the section which discusses QE: ” Since then, the economy has made progress toward these goals, and the Committee will continue to assess progress in coming meetings.”
We think this new statement, and its deliberate placement in the section describing asset purchases is a reminder they are closing in on their goals and a signal to the market to prepare for the tapering of QE and ultimately higher interest rates.
The Financial Times (LINK) put yesterday’s earnings from Google, Microsoft, and Apple into perspective.
“The three US tech groups brought in combined after-tax profits of almost $5bn a week during the latest quarter. At $56.8bn, the total was almost double the year before and 30 percent more than Wall Street had predicted. The figures were “absolutely stunning”, said Jim Tierney, a portfolio manager at AllianceBernstein, adding that “digital advertising is just on fire”, as advertisers race to follow audiences who have turned to online services in huge numbers.”
Since today is Fed day we thought we would share a quote about monetary policy from Jim Grant: “Persisting with the easiest policy in memory in the teeth of the fiercest inflation in a generation, the Fed reminds us of a diamond-handed Reddit bro pushing his last chips on to AMC Entertainment. He’d better not be wrong.”
Have trucking costs finally peaked? If the recent rise, as shown below courtesy of Arbor Research, is forming a peak, another factor pushing inflation higher may be abating. This would be welcome news for Amazon and other e-tailers.
The graph below compares the S&P 500 to the Shanghai Composite. As shown, the broad Chinese market did not perform nearly as badly as the S&P 500 during the early days of the pandemic but has since grossly underperformed the S&P. It is essentially flat over the last year. The tepid performance of their stock market along with signs China’s economic activity is slowing sends macro warning signs to the world. China has the second-largest GDP in the world and has been growing at twice the rate of most developed nations. Simply, Chinese economic activity contributes significantly to global GDP growth. We are also keeping an eye on the Chinese yuan for signs they devalue it versus the dollar to stimulate export growth.
July 27, 2021
Thinking of buying today’s dip? If so, you may be proven correct in a record short period of time as shown below.
Consumer Confidence rose to 129.1 versus 127.3 last month. Both the present and future indexes were up versus last month. Interestingly, inflation expectations are showing signs of stabilizing. The report shows 1-year inflation expectations at 6.6% versus 6.7% last month.
The Case-Shiller Home Price Index rose 1.8% monthly and 17% on a year-over-year basis. The data is for May so it will be interesting to see if the gains continue next month amidst poor home buyer sentiment and the very weak new home data released yesterday.
The table below shows the clear outperformance by sector, style, and factors of large-cap stocks versus mid and small caps.
The graphs below tell the story of the growth/cyclical rotations of the past 7 months. The graph on the left is the ratio of the equal-weighted S&P 500 (RSP) versus the weighted S&P 500 (SPY). When RSP outperforms SPY, the ratio increases and vice versa. RSP has a much higher percentage of cyclical stocks, including- value, energy, financials, and materials. The S&P 500 is heavily weighted with technology and growth-oriented stocks. The graphs on the right compare the correlation of the RSP/SPY ratio to the NASDAQ, S&P, and ten-year UST yields. With Tech and the S&P 500 recently outperforming RSP, the correlations versus the QQQ and SPY are strongly negative. Conversely, the correlation to yields is currently strong, meaning yields are falling as RSP underperforms. Simply, the market is rotating fiercely, and it is important to be on the right side if you want to keep up with the market. Currently, the growth rotation is in vogue.
Yesterday we wrote that 10 year real yields hit a new all-time low. The graphs below show that the price of gold and real yields have been well correlated over the last decade. In particular, the scatter plot on the right, shows a statistically significant correlation with an R squared of .82 between gold and real yields. The red square shows the current instance and the arrows direct your eyes to where a reversion to the mean would bring gold or real yields. Per the graph, either gold is underpriced by about $200 or real yields should increase to about -0.60% from -1.20%.
There are a lot of companies in our equity model reporting earnings today as shown below.
AAPL – After Close
GOOG – After Close
MSFT – After Close
RTX – Before Open
SBUX – After Close
UPS – Before Open
V – After Close
July 26, 2021
Since its recent lows in March, the NASDAQ has risen over 20%. At the same time, the volume of NASDAQ stocks trading higher each day is deteriorating. The graph below shows the 10 day moving average of up volume and the NASDAQ. This is another bad breadth indicator showing fewer stocks are leading the charge higher.
New Home Sales fell sharply from last month and were below expectations. June sales were down -6.6% versus an estimate of +3.7%. This marks the third straight monthly decline. New home sales are now down 20% year over year, at the lowest levels in a decade. The median price of new homes fell from $380,700 to $361,800. The supply of new homes is back to pre-pandemic levels.
10 year real yields are now trading at an all-time low as shown below in the Bloomberg graph. The real yield is calculated by subtracting the 10 year UST yield from the rate of expected inflation over the next ten years. At a real yield of negative 1.12%, investors will need to see the 10-year UST yield fall by about 15 bps. to approximately 1.10% to earn a 0% real return due to the gain in the price on the bond. This condition, in part, helps explain why investors are willing to pay outlandish valuations for equities despite poor expected returns.
There is a lot of information for the markets to digest this week. For starters, the Fed meets on Tuesday and Wednesday, followed by the updated policy statement and Jerome Powell’s press conference. We suspect there will be few changes to their current policy stance or economic outlook. However, we will not rule out a shift of QE from mortgages to U.S. Treasuries. The other thing to be on the lookout for is any hint at policy changes they might announce at the late August Jackson Hole conference. They have made big some big announcements in previous conferences.
More housing data comes this week with new home sales today, the Case Shiller Home Price Index tomorrow, and pending home sales data on Thursday. Personal income and spending and the monthly PCE price index will be released on Friday along with the Chicago PMI report.
Earnings will be lively this week with many S&P 500 companies reporting as shown below.
Despite most equity markets, foreign and domestic, rallying over the past few days, emerging markets remain the odd man out. As shown below, the popular emerging markets ETF, EEM, is touching its 200 dma today. The index is down 1.75% at noon today, while the S&P and developed foreign markets (EFA) are up .75%. Many emerging markets are heavily concentrated in commodity production. The second graph below shows similar weakness in the commodity-centric energy and materials sectors as compared to the S&P 500.
Rental prices have been rising as of late, which is leading to concerns that CPI will stay elevated as higher rent prices offset stabilizing and declining prices of goods that already had marked inflation. Rent constitutes about 7% of the CPI Index.
Zillow, in a report published earlier this week, had the following to say about rental prices: “Rent growth maintained widespread momentum in June, with the Zillow Observed Rent Index (ZORI) up 1.8% month over month, pushing typical U.S. rents to $1,799/month in June. A strong recovery in the rental market over the past few months pushed year-over-year rent growth up 7.1% — the largest annual increase in the series’ history reaching back to 2015. Even discounting a weakened market last year, rents have risen 5.1% since March, the fastest quarterly growth in Zillow’s data.”
Yesterday the National Association of Realtors (NAR) released data on home sales and prices for June. Per NAR: “The median existing-home price for all housing types in June was $363,300, up 23.4% from June 2020 ($294,400), as every region recorded price jumps.” The graph below, courtesy Lohman Econometrics, helps break down the sharp rise in house prices and the results are stunning. The more expensive houses rose much more in price than lower-priced houses. While lower prices for starter homes may be good for first-time buyers, which did account for almost a third of June’s home sales, the beneficial wealth effect is clearly going to those with large real estate investments and in many cases above-average levels of wealth.
July 22, 2021
This morning, Lance and Michael discussed the recent PBS Frontline episode, The Power of the Fed, and shared 10 important clips from the video. If you haven’t watched the video, today’s Real Investment Show podcast provides a nice summary of the show and important commentary expanding on thoughts aired by industry leaders and ex-Fed members.
Per Bloomberg: *POWELL HAS BROAD SUPPORT AMONG TOP BIDEN AIDES FOR NEW FED TERM.
His term expires early next year. A continuation of his term will likely be perceived as market-friendly as investors have green accustomed to his easy money policies and might fret about a potential change in policy if someone else were to take the position.
Economic data was a little weaker than expected this morning. The Chicago Fed National Activity Index which measures 85 economic data points fell to 0.09 from 0.29. A zero value denotes the economy is growing at its historical growth trend. Their inflation measure now points to subdued inflation after rising above their threshold for “sustained increasing inflation” last month. This data set has been volatile for the last 6 months, so take today’s release with a grain of salt.
Jobless Claims which had been trending lower popped up to 419k from 360k last week. Non-seasonally adjusted Claims have now risen for 3 weeks in a row.
Bloomberg’s article linked above does an excellent job explaining why there are shortages of so many products that rely on semiconductors, aka chips. The article discusses the factors behind the shortage, who is most affected, and importantly from an investment view, a long discussion of chip manufacturers, the industry, and what the future holds for chip production. The graph below, from the article, shows time from ordering a chip to delivery is about 50% longer than it was before the pandemic.
Per Bloomberg: of the Q2 earnings reported thus far, 85% have beat expectations as compared to the average of 71%. It is important to note that only 10% of S&P 500 companies have reported of which many are banks. Banks had a profit boost last quarter as many banks lowered their loss reserves. 87% of the companies which reported earnings mentioned “inflation” in their earnings commentary.
July 21, 2021
Per Ned Davis Research, individual investors own more stock as a percentage of their assets than at any other time in the last 70 years. We remind you of one of Bob Farrell’s 10 investment rules: “The public buys the most at the top and the least at the bottom.”
The price to sales ratio (P/S) of the S&P 500 is now double that of global equity markets. It’s important to note a couple of things. First, the composition of the S&P 500 is more tech-laden than global equity indexes. Given the higher growth rates of tech companies, investors are often willing to pay higher valuations for the S&P 500. That said, the S&P P/S ratio has well surpassed the all-time highs of the late 1990s while the global index is sitting at its highs. The takeaway: The ratio of the P/S ratio for the U.S. versus the world appears extended even considering compositional differences.
For more context of U.S. valuations versus the rest of the world, we present a comparison of CAPE (10) ratios by country/region.
Yesterday we showed how the price of crude oil was sitting on important support and being closely followed by the bond markets because of the strong correlation between crude oil and CPI. The two graphs below help further highlight the important correlation. The first scatter plot shows the relatively strong relationship between the year-over-year change in CPI and Crude oil. The second chart shows the annual changes but in a different format. Important in the second chart, the year-over-year price in crude has fallen sharply recently. Will CPI follow? If the price of crude oil stays around $75, the red line should flatten out near current levels until November at which point it will fall.
July 20, 2021
The graph below shows the decent correlation between rising inflation expectations and the S&P 500. Both measures of inflation expectations have stopped increasing and are gradually declining. It appears the equity markets might just be noticing.
As shown below, the price of crude oil fell to critical support yesterday. At this point, its risk and reward are fairly even. If it bounces from the recent support line and the longer support line from May 2020, it may go test $75, the prior high. A break of the two support lines may result in a test of the 200 dma at $56. The bond market is likely paying close attention to crude prices as it has a high correlation with CPI.
The graph below, courtesy of the Daily Shot, shows housing inventory is finally rebounding and back to levels last seen in 2019. The combination of higher prices and more inventory should quell further large increases in house prices. Will it be enough to push them lower?
The chart below, courtesy Lohman Econometrics, shows margin debt has only been more than 2 standard deviations above its trend two other times since 1997, before the current instance. As shown, the reversal back to and below trend in those two instances was accompanied by a 50%+ decline in the S&P 500.
The graph below, courtesy of Brett Freeze, shows the correlation between real earnings yield and future returns. The earnings yield is the opposite of P/E, or earnings divided by price. Real earnings yield subtracts the current inflation rate from the yield. As he shows, at current real earnings yields, we should expect a one-year forward return of close to -20%. The R-squared is strong at .50, but there is significant variance around the trend line.
July 19, 2021
The graph below shows Bitcoin (BTC) is sitting on key support at 30,000. BTC has been a good barometer of the risk trade in equities, so the support line may be of importance for not just crypto investors.
Today’s equity sell-off and big decline in bond yields are being blamed on OPEC for increasing supply and the spreading of the Delta Variant. In regards to oil, lower oil prices are beneficial for bonds as it lowers the inflation rate. Lower yields and oil prices are also good for the economy, which should help stocks. Of note, the major airlines are down between three and five percent thus far today, despite being a beneficiary of lower oil prices. The decline is likely growing concern over new restrictions due to the Delta variant. The good news is that, thus far, hospitalizations and fatalities are not following the number of new cases related to the variant.
Crude oil is trading nearly 3% lower and below $70/barrel this morning as OPEC agreed to boost supply by 400k barrels a day each month starting August. The monthly increases will continue until the output is back to pre-pandemic levels. Equally important for OPEC, Per Bloomberg: “It also puts an end to a diplomatic spat that unnerved traders, as the fight between the two long-time allies (Saudi Arabia and UAE) risked unraveling the broader accord between the Organization of Petroleum Exporting Countries and its allies that has underpinned the recovery in crude prices.”
Housing data takes center stage this week. Today, the NAHB Housing Market Index will be released, followed by housing starts and permits on Tuesday, and existing home sales on Thursday. New home sales will come next Monday.
There will be a limited number of Fed speakers this week as they enter their blackout period before next week’s FOMC meeting.
There are a slew of earnings reports this week as shown below.
The following article by Lacy Hunt at Hoisington (LINK) is a little heady but well worth a read. The simple takeaway is fiscal stimulus will help boost aggregate demand and GDP today but reduces it below where it would have been tomorrow. From his summary- “More debt does not cure a subpar economy mired in a debt trap.”
Last week we discussed the prominent role used car prices played in the CPI report. We follow up with the graph below courtesy of BofA which helps explain the supply/demand mismatch driving new car prices higher. With so few new cars being produced there are fewer trade-ins which, in turn, reduces the availability of used cars.
The University of Michigan consumer confidence survey declined from last month. The index fell to 80.8 from 85.5. It appears inflation is playing a role in eroding confidence. Inflation expectations rose sharply from 4.2% to 4.8%. Partially as a consequence, consumers expect their real (inflation-adjusted) income to fall 3.2%. The graph below also shows that many of those surveyed think now is the worst time in recent history, by a long shot, to buy a house.
Retail Sales were better than expectations at +.6% versus expectations of a .4% decline. Last month’s data was revised lower by .4% to -1.7%. Not surprisingly food services/drinking and gasoline stations accounted for almost 80% of the gain. Given the shortage of new and used cars, motor vehicles and parts reduced .4% from the number. The control group, which feeds GDP, rose 1.1% but May was revised lower by .7%.
Per Zero Hedge and Bank America, Today’s strong report may be fleeting in July. Per their report- “According to BAC aggregated debit and credit card spending data, after a strong June, consumers hit the brakes, and total card spending slowed to only up 13% over a 2-year period or 12% over a 1-year for the 7-days ending July 10th. This will mark the slowest 1-year increase since the covid crisis began.”
The Bank of England (BOE) is under pressure by Parliament to explain QE and justify its risks. Per the report: “The Economic Affairs Committee publishes its report ‘Quantitative easing: a dangerous addiction?’, which urges the Bank of England to explain in more detail why it believes rising inflation will be a short-term phenomenon, and why continuing with its quantitative easing programme until the end of 2021 is the right course of action.”
The Fed is also seeing some backlash against QE and the resulting financial bubbles. This pressure however is from the media, not the government. Frontline recently published a damming episode, called An Epic Mistake? on the Fed and QE. Of particular note, they interview Peter Fisher who was the NY Fed President for over a decade. Mr. Fisher has some choice words to say about financial instability and the risks the Fed is taking in their pandemic-related massive QE efforts.
Peter Fisher has been a lone voice of reason since leaving the Fed in 2001. Two years we wrote, The Wisdom of Peter Fisher, which discusses his concerns about QE. It’s worth giving it a quick read before watching the Frontline Video.
The graph below charts market expectations for the Fed Funds rate going out to March of 2023. The orange line shows the market currently expects about 30bps in Fed tightening between now and then. Said differently, they expect a 100% of one 25bps rate hike and a 20% chance of two by March 2023. The graph also shows that current levels are near the highs for each monthly contract. The blue line extends the current effective Fed Funds rate out until March 2023.
Lumber is down 7% this morning and, after the big surge in price earlier this year, has now corrected back into the pre-pandemic range.
One more tidbit on inflation. The graph below shows the difference between CPI and PPI. PPI, which measures commodity prices and other manufacturing inputs tends to rise before CPI in an inflationary environment. CPI follows PPI as manufacturers and retailers try to push input price increases on to consumers. That is exactly what happened over the last year. At one point CPI was 6% higher than PPI on a year-over-year basis. Currently, CPI is 4% less than PPI. CPI will catch back up to PPI as is typical. If prices can be pushed to consumers without losing too much demand, PPI will drive CPI. If consumers are unwilling to pay higher prices, corporate margins suffer, which usually leads to less demand for input goods and ultimately lower prices.
Used car prices only represent about 3% of the CPI Index but contributed to about a third of its recent increase. As such, used car prices have become an important factor to watch for gauging inflation. The Manheim Used Vehicle Value Index below shows the sharp increase in prices since the pandemic. The only positive takeaway from the latest data from Manheim is it shows that price increases may be abating. June prices show a monthly decline of 1.3% from the prior month. That said, the index is still up 34.3% from a year ago.
Movie theaters are being left behind in the economic recovery. This year’s big blockbuster, Black Widow, just pulled in $80 million in revenue in its best weekend. In 2019, Avengers: Endgame had the biggest grossing weekend at over four times the revenue- $357 million. The graph below shows that ticket sales are running grossly behind levels from before the pandemic. The data for 2021 is through June so you can essentially double the $2.5 billion in box office sales to $5 billion and compare it to the nearly $12.5 billion in sales pre-pandemic.
July 14, 2021
Stocks, bonds, and gold are off to the races this morning as Powell’s prepared remarks before his testimony later today was released. He essentially quelled concerns that taper might be coming soon. He continues to base that judgment on the slow improvement in the labor markets.
“While reaching the standard of “substantial further progress” is still a ways off, participants expect that progress will continue. We will continue these discussions in coming meetings. As we have said, we will provide advance notice before announcing any decision to make changes to our purchases.”
Like CPI yesterday, year over year Producer Prices (PPI) came in about .5% above expectations. PPI rose 7.3% and core PPI rose 5.6%. Monthly PPI rose 1% versus 0.8% last month and expectations of +.6%.
The following chart, courtesy of Macrobond, shows if you strip out food, energy, and goods that have been directly affected by the economic reopening, inflation is relatively tame. Over the coming months, we will closely track the individual components of inflation to best assess its future path. In this realm, watching sticky prices versus flexible prices will be important. Sticky prices are those that tend to trend, like housing. Inflation in sticky sectors is more likely to be permanent. Flexible prices tend to oscillate over time. These include energy and used cars for example.
Fed Chair Jerome Powell is scheduled to present testimony on monetary policy and the economy to Congress today and tomorrow. We suspect he will continue to walk the fine line between talking about tapering and wanting to wait for an improvement in the labor markets before tapering. It is increasingly likely that senators and representatives will grill him on yesterday’s inflation data and the widening wealth inequality gap. As we wrote in Two Pins Threatening Asset Bubbles, such pressure could force the Fed to taper sooner than they would like.
To wit: If the prices of food, shelter, and other necessities continue to surge higher without equivalent wage growth, wealth inequality will worsen. This problem represents a coming dilemma for the Fed.
When the media and politicians take notice, they will pressure the Fed on their inflation stance.
U.S. bond yields have been declining as the market buys into the Fed’s view of transitory inflation and declining economic growth. Bloomberg recently wrote an article providing more evidence for such an outlook. In China’s Slowing V-Shaped Economic Recovery Sends Global Warning, the author warns China’s economy may be providing the recovery road map for the global post-pandemic economic recovery. They were the first to experience COVID and the first to recover from it. We noted a few weeks ago the sharp slowdown in credit creation as a signal of decelerating growth in China. The outlook was emphasized last Friday when their central bank cut the reserve ratio requirement for banks, essentially making lending easier. In regards to inflation that we import from China, the article quoted the following: “China’s growth slowdown should mean near-term disinflation pressures globally, particularly on demand for industrial metals and capital goods,” said Wei Yao, chief economist for the Asia Pacific at Societe Generale SA.
China has long been the marginal driver of global economic growth as they are the second-largest economy and, prior to the pandemic, growing at twice the rate of almost all developed nations’ economies.
July 13, 2021
The initial market reaction to the strong CPI print was a decent rally in bond prices (lower yields). Some may wonder why yields are falling if inflation was much stronger than expected. The answer likely lies in the reasons CPI rose. The table below shows the contributions by sector to the monthly and annual CPI Index. Energy and Transportation prices were both up sharply. In aggregate they contribute 63% and 80% to the monthly and annual number respectively. Both are considered to have flexible pricing meaning they can fall in price as easily as they rise. As a result, bond investors seem to remain comfortable with the idea that the recent inflationary surge will be transitory. The Fed will also likely use this reasoning to brush off today’s data.
As shown below, CPI came in .4% higher than expectations on a monthly and year over year basis. Troubling for the markets will be that the monthly rate of inflation accelerated after having declined last month. Markets tend to focus more on the rate of change as it provides guidance about future trends. That said, the monthly rate of inflation on an annualized basis is nearly 11% and that will no doubt make headlines.
Per the BLS– “The index for used cars and trucks continued to rise sharply, increasing 10.5 percent in June. This increase accounted for more than one-third of the seasonally adjusted all items increase.”
The good news is that used car prices are not likely permanent as they are the result of severe shortages and strong demand which are both temporary. The bad news is that housing prices (OER) continue to tick up. These prices are considered more “sticky” and constitute a much larger proportion of the CPI number.
One of the recent market themes we have been discussing is the growing divergences between certain sectors and markets. Last week, for instance, we wrote: “The generals are leading the way higher but the troops are not necessarily following.” The graph below, courtesy Lohman Econometrics, shows that 1-year rolling correlations between many indexes have broken down to levels, that in eight of the nine cases haven’t been witnessed in 20 years. These graphs and other related data do not mean the market will crash but they do represent a change in market dynamics that bears close watching and caution.
July 12, 2021
Per Bloomberg: “The U.S. central bank’s purchases of Treasury and mortgage-backed securities are both contributing to lower housing costs, New York Fed President John Williams says”
The unfortunate reality, as shown below, is that housing is now more unaffordable than any time in at least the last 20 years.
Massive intervention by the Fed and other central banks is significantly reducing investors’ perceptions of risk. For example, many equity valuations sit at or near levels recorded in 1999 and 1929, despite economic growth rates that are declining and lower than those periods. The graph below highlights another manifestation of risk complacency. It shows the standard deviations of UST yield spreads for each credit rating of corporate bonds. As shown, the deviation escalates as the bonds’ riskiness increases. Junk-rated bonds, especially the worst in class (CCC or lower) are now over four standard deviations from their average. Investors in these bonds only require an additional 5.81% of yield versus UST notes. The average is nearly 12% since 1997.
Our first glimpse of inflation data for June comes Tuesday with CPI. The current expectation is for a decline in the monthly growth rate from +0.7% to +0.4%. On a year-over-year basis, a slight decline from 5% to 4.9% is expected. PPI will be released on Wednesday and a slight decline from May is also expected. We are more concerned with the rate of change of inflation than the rate itself. If the monthly rate declines for the second month in a row it provides some level of confidence that inflation might be peaking. Given the highly unusual supply line shortages and insatiable demand for some goods, we must understand that forecasting inflation will continue to be extremely difficult and likely humbling.
On Friday, we will learn more about the health of the consumer with Retail Sales. Economists expect it to fall -.5%, following last months -1.3% decline. We will also keep an eye on various surveys throughout the week to see if they continue to rise to record or near-record levels or begin to stabilize.
Earnings will start this week with the following key releases shown below. Of note will be the large banks with JPM and GS on Tuesday, followed by BAC and WFC on Wednesday.
The graph below helps to further highlight the underlying weakness in the markets. It shows the S&P 500 continuing to set record highs on a seemingly daily basis, yet the percentage of S&P stocks above their 50 dma continues to decline. Currently, half the stocks in the index are below their 50 dma! We also noticed that only 33% of stocks are one standard deviation or more above their 200 dma and that percentage has been steadily falling. For reference, it stood at 55% at the start of June and 70% in January and February.
The most recent data on inventories shows that some of the shortage problems may be lessening. Wholesale inventories rose 1.3% last month, slightly more than expectations of 1.1%. At the same time, wholesale sales only rose 0.8%, meaning the inventory to sales ratio at the wholesale level upticked. The ratio for retailers will be released next week. As shown below, it has been in a free fall since the early days of the Pandemic. If the ratio starts to stabilize or turn higher, inflationary pressures should alleviate on the margin.
The latest Consumer Credit data, released yesterday afternoon, shows consumer credit rose by $35.3 billion in May, almost double expectations. Non-revolving credit (auto and school loans) increased by $26.1 bn, the most on record. Revolving credit, mainly credit cards, rose $9.2 bn after falling last month. With the unexpected increase, consumer credit is running about 2% above January 2020 levels. The growth rate prior to the pandemic was in the 4-5% range.
The graph below, courtesy of Brett Freeze, shows how the returns between the S&P 500 and 16 year-zero coupon treasuries tend to oscillate over time. In March, the year-over-year outperformance of equities over Treasuries hit an extreme. Based on the previous two times this occurred, we should expect Treasuries to outperform the S&P 500 over the coming months.
July 8, 2021
The New York Fed announced they will start selling their holdings of corporate bonds on July 12th. While the amount they own is minimal, it does represent a normalization of monetary policy. This announcement was widely expected and should have minimal impact on the corporate bond market.
The minutes from the last Fed meeting were released yesterday afternoon. Bottom line: the Fed has begun discussions about reducing QE purchases and the likelihood of tapering mortgage purchases is likely sooner rather than later. We suspect such an announcement regarding mortgage purchases could come at the late July meeting or at their annual Jackson Hole retreat in late August.
“Several participants highlighted, however, that low-interest rates were contributing to elevated house prices and that valuation pressures in housing markets might pose financial stability risks.”
“Various participants mentioned that they expected the conditions for beginning to reduce the pace of asset purchases to be met somewhat earlier than they had anticipated at previous meetings in light of in-coming data.”
“Several participants saw benefits to reducing the pace of these purchases more quickly or earlier than Treasury purchases in light of valuation pressures in housing markets.”
Owners Equivalent Rent constitutes nearly one-third of the CPI Index. As such, trends in rent prices are important to factor into inflation forecasts. Rents fell during COVID but have been recovering with the economy. The following paragraph and graph are from an in-depth report from Apartment List.
“Our national index increased by 2.3 percent in June, continuing the trend of rapid price growth since the start of the year. So far in 2021, rental prices have grown a staggering 9.2 percent. To put that in context, in previous years growth from January to June is usually just 2 to 3 percent. After this month’s spike, rents have been pushed well above our expectations of where they would have been had the pandemic not disrupted the market.”
While rental prices are recovering nicely we must put the gains into context. Rents are still below 2019 levels in many major cities. The ten cities hardest hit by the pandemic are shown below. That said there are many smaller cities seeing double-digit annual increases in rent. Boise and Spokane lead the way at +39% and +31% respectively.
July 7, 2021
Wolf Richter of Wolf Street shines a light on evidence the housing market is weakening quickly.
The evidence has been piling up for months in bits and pieces: While investors still have the hots for this housing market, potential buyers that need a mortgage and those who want to live in the home they’re thinking of buying are getting second thoughts, as evidenced by sharply dropping sales of existing homes and new houses even as inventories for sale have now risen for the third month in a row and new listings are coming out of the woodwork.
So here’s the latest piece of evidence: Demand from buyers who need a mortgage to fund the purchase of a home has been declining for months and in the week ended July 2 fell further and is now down 14% from the same week in 2020 and down 8% from the same week in 2019, according to the Mortgage Bankers Association this morning. Mortgage applications are now at the low end of the range in 2019.The entire Pandemic boom has now been worked off, plus some.
Per the BLS JOLTs report, the number of job openings declined slightly versus last month but remains near a record high at 9.2mm. New hires were also similar to last month at 5.9mm. Basically, the labor market remains tight despite the high unemployment rate. The quit rate fell but remains at 20 year+ highs at 2.5%. Typically employees that quit do so because they have confidence in finding another job and often one that is higher paying. Given the perceived leverage of those that quit over employers, there has been a strong correlation between wage growth and the quit rate. As shown below, the correlation broke down in 2017 and has been irrelevant during the pandemic. If the correlation normalizes we should expect an uptick in wages.
A WSJ article entitled Supermarkets are Stockpiling Inventory as Food Costs Rise discusses how grocery stores are stockpiling food inventories in anticipation of price increases. This is not the type of action grocers would take if they thought recent price inflation was transitory. “When you have a uniquely inflationary period like now, it’s a feeding frenzy,” said Tony Sarsam, chief executive officer of SpartanNash Co. The Grand Rapids, Mich.-based retailer and distributor is stockpiling about 20% to 25% more groceries such as frozen meat and boxed foods after more than 100 suppliers notified SpartanNash that they would raise prices, he said.
As grocers stockpile inventory, their actions fuel more inflation as demand further exceeds supply and supply line-related delivery problems. Such actions, especially if carried out by consumers and a large number of retailers, can create a repeatable cycle of higher prices.
The graph below, courtesy of the Cleveland Fed, suggests the surge in headline/core inflation is concentrated in a limited number of items. Per the Fed: PCE inflation jumped to 3.9% in May. But median PCE inflation, which excludes outlier components and focuses on the middle of the distribution, was steady at 2% for the third month in a row.
The data may provide some level of confidence for the Fed that the recent bump in inflation is transitory.
July 6, 2021
Per SentimenTrader:
The Nasdaq Composite closed at a 52-week high today, something it’s done 1,080 times since 1984. On those days, an average of 50% of stocks on the Nasdaq advanced on the day. Today, 31% of stocks on the exchange advanced. That’s the lowest out of all those 1,080 days.
The Citi Economic Surprise Index, measuring economists’ expectations versus actual data, has been positive for 274 of the past 275 trading days. It currently sits slightly above zero and is trending lower. It appears economists’ predictions have finally caught up with reality. Markets now run the risk that economic data going forward will fall short of expectations. However, if investors perceive bad news as good news, as it keeps the Fed from tapering, then a run of negative readings may be a good thing and the risk of weak data minimal. Such is the distorted environment we must invest in.
The graph below shows the market’s breadth is diverging from prices. The orange line (S&P 500) has been steadily climbing despite the number of NYSE stocks sitting above their respective 50 dma’s falling. Looking back over the last four years you can see a similar divergence occurred in 2018. The S&P ultimately fell by about 20% as the Fed was reducing its balance sheet at the time. QE Taper is on the horizon, might that ultimately determine how this divergence ends?
Economic data will be relatively light during this holiday-shortened week. Of importance will be the FOMC minutes from the last meeting. We will be interested to see how much discussion there was around the timing of tapering. ISM non-manufacturing PMI is due out tomorrow. Expectations are for a slight decline, but the prices component should rise to a very high reading of 81. The BLS will release JOLTS job openings on Wednesday.
Over the weekend a few subscribers asked us to explain the Feds reverse repo program that is approaching $1 trillion daily and could rise to $2 trillion over the coming months. In particular, they want to understand how it is different from the repo program the Fed initiated in the fall of 2019 that lead to interest rate cuts and QE of T-bills. Our answer can be found at the 27:40 minute mark of last Thursday’s daily podcast- The Real Investment Show.
Despite the strong performance by the indexes today, the underlying breadth of the market remains poor. As shown below, 5 of the 11 sectors posted meager to negative returns, and only two sectors, Tech and Communication, beat the S&P. The generals are leading the way higher but the troops are not necessarily following.
Sharply rising prices at the pump are helping further stoke inflationary concerns among individuals. As shown, the price of gasoline futures are now at levels last seen in 2014.
As shown below, the headline number from the BLS jobs report was strong at 850k net new jobs added in June. However, the unemployment rate rose from 5.8% to 5.9% and the labor participation rate fell by a tenth of a percent to 61.6%. Also of concern, hourly wages and the average workweek were slightly lower than expectations. Earnings are tricky to make sense of as an increase does not necessarily denote increased wages. The mix of jobs is equally important and hard to gauge. For instance, many service jobs are low-paying and reduce earnings. This past month 343k jobs were added in the leisure and hospitality sectors and teachers accounted for 269k of the new jobs.
As we have noted recently, we expect the Fed will begin to taper purchases of mortgages, possibly as soon as the late July FOMC meeting. With mortgage rates just above all-time record lows of earlier this year and house prices rising at a double-digit pace, it’s hard for the Fed to deny some culpability in spurring a housing bubble. The graph below, courtesy of Jim Bianco, shows the Fed now owns about a third of all mortgages used in Barclay’s MBS index.
Markets will be closed on Monday, July 5th for Independence Day.
The series of graphs below show that almost half of the investors surveyed in the poll are taking on leverage to invest. Generation Z leads the pack with nearly 80% of respondents saying they are taking on debt to invest. Not surprisingly only 9% of the more conservative Baby Boomers are leveraging their assets. The second and third graphs show the types of loans and types of investments favored by personal investors. While the data is telling about the state of speculation in today’s market, we would like to see it compared to years past to put it into proper context.
July 1, 2021
The PMI Survey on manufacturing conditions, which has been rising sharply, is showing signs of peaking. The index came in at 62.1 versus expectations of 62.6 and the prior month’s reading of 62.1. However, input prices continue to rise and sit at a new record high. Per the increased price pressures Chris Williamson, Chief Economist for IHS Markit (survey producer) commented: “Supplier delivery times lengthened to the greatest extent yet recorded as suppliers struggled to keep pace with demand and transport delays hindered the availability of inputs. Factories were increasingly prepared, or forced, to pay more to secure sufficient supplies of key raw materials, resulting in the largest jump in costs yet recorded.
“Strong customer demand in turn meant producers were often able to pass these higher costs on to customers, pushing prices charged for goods up at a rate unbeaten in at least 14 years.”
China’s PMI continues to slowly weaken and their prices index is down from 59.8 in March to 51.4 in June. China is the driver of marginal global economic growth so their pronounced relative weakness versus the United States bears watching. Eurozone and UK PMI’s inched higher and are at similarly high levels as the U.S.
With the first 6 months of the year in the rearview mirror, it’s worth looking at how markets finished the year after a strong first half. The table below, from LPL, shows that in the 16 previous times since 1950 the S&P was up more than 12.5% in the first 6 months, the next 6 months were positive 12 times, with an average return of 7.1%. The S&P is up over 14% already this year so the statistics books tell us that +20% is a reasonable expectation.
One of the key factors driving inflation higher is supply line problems. The graphs below from Goldman Sachs show that supplier delivery times are now over 4 standard deviations above their norm of the last 20 years. Maybe more concerning, businesses expect the problem to abate somewhat in 6 months but they still expect the largest supplier delays in 20 years.
The graph below highlights the difficulty in trading modern equity markets. As shown, if you bought the S&P 500 at the market open and sold the close since 1993 you would have not made a dime other than dividends. Conversely, if you bought the market at the close and sold at the open you would have captured all of the market gains of the last 28 years.
The ADP jobs report came in nearly 100k jobs stronger than expected at 692k net jobs added in June but off the 978k pace from last month. Not surprisingly, leisure and hospitality jobs account for nearly half of the gain as shown below.
Liz Ann Sonders from Charles Schwab posted the commentary below on Twitter which rebukes the commonly held thought that enhanced unemployment benefits are keeping people from finding jobs.
Job postings on @indeed in states that have ended enhanced unemployment benefits early have been climbing right in line with openings throughout the country, supporting @CapEconomics view that added insurance isn’t that strong a factor in holding back employment.
When extended benefits end nationwide over the next few months, we will better understand why job openings are at a record at the same time the unemployment rate is elevated from pre-pandemic levels.
In the aftermath of the last FOMC meeting and numerous Fed speeches, it is clear that unemployment is the main factor holding the Fed back from tapering QE and raising rates. As such, today’s ADP report and Friday’s BLS labor report will be important in regards to estimating the timing of Fed actions. ADP is expected to show a gain of 533k jobs, a historically strong pace but well off last month’s 978k. Friday’s BLS report is expected to show a pick-up of 675k jobs, compared to 559k last month. Equally important will be the participation rate, unemployment rate, and wages and hours in Friday’s report.
The graph below, courtesy of the Brookings Institution, shows the massive amount of fiscal stimulus of the last year is waning. Going forward, the sharp decline in spending will detract from GDP growth. This graph does not obviously take into account unknown future stimulus spending bills.
June 29, 2021
The chart below highlights an important issue for markets and one hotly debated by market prognosticators. Does the amount (stock) of monetary stimulus or the change (flow) in the amount of stimulus matter more? The graph below, on the left, from JP Morgan, shows the size of the major central bank balance sheets has doubled since the pandemic started. At the same time, the 12-month change in balances just peaked at over $8 trillion and is heading sharply lower. We believe the flow or annual change of the stimulus matters more. Accordingly, we think caution is warranted as the correlation between QE and asset prices is strong as shown in the second graph.
Home prices remain red hot. The Case Shiller 20 City home price index rose 1.6% on a monthly basis and 14.9% annually. The FHFA (regulator of Fannie Mae and Freddie Mac) home price index confirmed Case Shiller by rising 15.7% annually.
Also of note on the economic front, consumer confidence was much better than expected at 127.3 versus 117.2 last month. It now stands only about 5 points below pre-pandemic levels. While market expectations for inflation have leveled out in recent months around 2.5%, consumer expectations, via the confidence survey, just hit a 10 year high at close to 7%. Keep in mind consumers tend to believe there is more inflation than reported by the government, ergo they have higher expectations for inflation than the market. The lowest levels of the last ten years occurred between 2016-2019 where they ranged between 4.5% and 5%.
The graph on the left shows the shape of the crude oil futures curve. Specifically, the black line is the price difference between the front-month contract and the forward contract settling a year in the future. As shown by comparing the curve to the price of crude oil (right graph), when the curve peaks (oil futures are in backwardation), oil prices tend to peak.
June 28, 2021
The graph below updates inflation expectations. As shown, both 5yr and 10yr expectations have stabilized for the last three months after rising sharply for almost a year. The other takeaway is the difference between 5yr and 10yr expectations. Typically 5yr expectations are lower than 10yr. Since late 2020 they have been higher. This can be interpreted as the market believing the Fed in that inflation will run “hot” but will be transitory. The difference between them is shown in gray. Recently it has been slightly declining, furthering the transitory view.
As shown below, B and CCC-rated junk bonds are now trading at 20+ year record low yields. As a spread versus U.S. Treasuries, both sets of bonds are close to levels seen in 1999 and 2007. With little upside and significant downside, we urge caution in the junk bond sector. Simply, the additional yield offered by junk bonds versus safer bonds is not worth the additional risk.
The S&P 500 is showing signs of weakness lately as it grinds higher at a seemingly slowing pace. This chart from Bloomberg points out the narrow breadth seen as the index made a record high last week. Only 46% of index members were trading above their 50-dma when the market closed on Thursday.
The following chart from SentimenTrader provides ominous historical context to the situation. The last time we saw the market making new highs with a similar lack of breadth was in 1999. Moreover, most other instances prior to 1999 preceded significant corrections or bear markets. This is not to say a large correction is imminent, rather keep an eye on signs of market weakness as the effects of fiscal stimulus fade.
The economic calendar will be busy this week. The Case-Shiller Home Price Index and Consumer Confidence Index will be released tomorrow, followed by the ADP Employment Report on Wednesday and the ISM Manufacturing Index on Thursday. Perhaps most important, Nonfarm Payrolls will be released Friday. Considering recent inflation prints, unemployment continues to grow in importance with regard to the Fed’s decision to taper asset purchases.
After last week’s barrage of Fed speakers, this week will be relatively light. We will hear from NY Fed President John Williams today.
Boston Fed President Eric Rosengren voiced some concerns regarding financial stability today. He commented that we should to consider some of the side effects of a “low for long” interest rate plan, and that the Fed needs to have a less ad hoc approach to crises. He continued by stating that monetary policy may not be as accommodative for as long if financial stability risks are not addressed. Regarding inflation, he largely stuck to the script reiterated many times this week by Fed members.
Rosengren also discussed a need to monitor the speed of increases in housing prices, noting that in several markets, prices are now higher than they were prior to the financial crisis. He suggested that the Federal Reserve consider tapering treasury and MBS purchases by the same amount when the time comes. Tapering of MBS purchases has become a hot topic with Fed officials lately, signaling this could be the first area of action when the time comes.
The University of Michigan’s Consumer Sentiment Index was 85.5 for the month of June, which measures below the estimate of 86.5. The index fell from the preliminary reading of 86.4 earlier this month, however, it represents an improvement from May’s value of 82.9.
Personal Income fell -2% in May versus expectations of -2.6%, while Personal Consumption Expenditures were unchanged on a monthly basis, missing the consensus of +0.6%. On a YoY basis, the PCE Price Index matched expectations of +3.9%. This represents a slight increase over the +3.6% seen in April.
The Core PCE Price Index, the Fed’s preferred measure of inflation, rose +0.5% on a monthly basis and +3.4% YoY in May. Both timeframes came in below expectations and compare to April’s readings of +0.7% MoM and +3.1% YoY. The Federal Reserve will likely stick to its story of transitory inflation caused by a strong reopening and supply chain pressures which will moderate going forward.
Lumber futures continue to retreat this morning as home builders wait out high input costs, buyers are increasingly priced out of the market, and saw mills begin catching up with demand.
The following chart from Julien Bittel shows that since 1990, every time the 30-Year T-Bond yield rose more than 1% over a 12-month period, it declined over the subsequent 12 months. The YoY change in yield reached 1.3% on March 8, 2021, and the rate has fallen over 21 basis points since. Thus, the data suggests we may have seen a local peak in long-term yields.
June 24, 2021
The bipartisan infrastructure agreement includes $579B of proposed new spending. According to President Biden, funding sources will not include a gas tax increase or fees for electric vehicles. The President also said he expects a vote on the bill before the fiscal-year ends.
“We’ve struck a deal. A group of senators – five Democrats and five Republicans – has come together and forged an infrastructure agreement that will create millions of American jobs.”
Weekly jobless claims came in higher than expected this morning, at 411K versus a consensus estimate of 380K. Initial claims fell by 7K, a slight improvement over last week’s data but still higher than the print two weeks ago. As we alluded to last week, the employment situation going forward will be an important factor in the timing of the Fed’s decision to begin tapering asset purchases.
A bipartisan group of Senators will meet with President Biden today at 11:45 AM EST to discuss plans for an infrastructure proposal totaling nearly $1 trillion. According to Senator Jon Tester, the group has reached a general framework for the deal but there are still some components that need to be fleshed out.
Yesterday Treasury Secretary Janet Yellen urged Congress to increase the government’s debt limit to avoid potential default on Treasury debt this year. The Wall Street Journal noted:
“Without congressional action to suspend or raise the limit after July 31, the government could begin to miss payments on its obligations, triggering a default on government debt, which Ms. Yellen called unthinkable.
‘Failing to increase the debt limit would have absolutely catastrophic economic consequences,’ she said, noting that the U.S. has never defaulted on its legal obligations. ‘I believe it would precipitate a financial crisis. It would threaten the jobs and savings of Americans at a time when we’re still recovering from the Covid pandemic.’”
It is highly unlikely that Congress would allow this to happen, but as Yellen stated, “We can’t tolerate any chance of defaulting on the government’s debt.”
The chart below compares the shape of the 2yr-30yr UST yield curve (orange) to the ratio of the S&P 500 Growth to Value indexes. As shown, the correlation has been strong since the start of the year. Growth has outperformed recently as the yield flattened. This chart falls in line with a lot of other trends which help define the inflation-deflation trade.
June 23, 2021
Following the hawkish stance from Bostic, the Fed’s Kaplan made some comments that inspired modest selling into the close.
“The U.S. economy will likely meet the Federal Reserve’s threshold for tapering its asset purchases sooner than people think, said Dallas Fed President Robert Kaplan, who has penciled in an interest-rate increase next year.
‘As we make substantial further progress, which I think will happen sooner than people expect — sooner rather than later — and we’re weathering the pandemic, I think we’d be far better off, from a risk-management point of view, beginning to adjust these purchases of Treasuries and mortgage-backed securities,’ Kaplan said Wednesday in an interview with Bloomberg News.”
Like Bostic, Kaplan said he expects an initial rate hike in 2022.
The Atlanta Fed President, Raphael Bostic, said today he now expects a rate hike in late 2022 with two additional rate hikes in 2023. He also expressed his belief that the economy is close to fulfilling the “substantial further progress” needed to begin tapering bond purchases and commented that a tapering decision could be made in 3-4 months. The S&P 500 briefly dipped into negative territory following his comments but returned to positive territory shortly thereafter.
Following yesterday’s stronger than expected Existing Home Sales report, New Home Sales fell 5.9% to 769K in May, missing expectations by a wide margin. The median sales price rose to a record high $374,400 (+18.1% YoY) as supply side constraints contributed to rising prices.
The median sales price of existing homes in the US rose to $350,300 last month, up 23.6% year over year. This chart from Bloomberg highlights the clear link between declining inventory and surging home prices. Meanwhile, the Federal Reserve continues its purchases of $40B per month in MBS despite fueling a supply-demand imbalance that is driving home prices out of reach for many first-time home buyers.
The graph below shows the absurdity of how low junk bond yields have gotten. Assuming no defaults, which is historically impossible, the Barclays junk bond index will return a yield slightly below the rate of inflation. Typically the real, post-inflation, yield is north of 4% to provide a cushion against defaults. Just to hit home with the stunning graph, in a better than best-case scenario, junk bond investors should expect to lose purchasing power.
June 22, 2021
The semiconductor chip shortage worsened yet again last month, according to an article published by Bloomberg earlier today.
“Chip-starved industries from automakers to consumer electronics will need to wait a bit longer for components, as delays in filling orders continue to get worse.
Chip lead times, the gap between ordering a semiconductor and taking delivery, increased by seven days to 18 weeks in May from the previous month, an indication that chipmakers’ struggles to keep up with demand are worsening, according to research by Susquehanna Financial Group.”
The chart below shows the drastic increase in lead times for semiconductor chips as the economy continues to reopen.
Per Live Squawk:
– Fed’s Daly: Appropriate To Debate Taper But We Are Not There Yet
– Could Reach Threshold For Taper Late 2021, Early 2022
– Looking To Autumn To Get More Clarity On Economy
Existing home sales for May came in above expectations at 5.8M versus the consensus of 5.72M. This represents a decline of 2.7% from the April level. The lack of supply of existing homes continues to pose a problem for the market, but it’s worth noting that inventory rose 7% month over month.
At 2 pm ET Chairman Powell will testify to Congress on Pandemic emergency lending and supporting economic recovery. This will be the first chance for Congress to pressure Powell on rising inflation and the problems it creates for the lower and middle class. This will also Powell’s first comments since the Fed meeting last week.
This excerpt from his prepared remarks echoes a familiar tone:
“Inflation has increased notably in recent months. This reflects, in part, the very low readings from early in the pandemic falling out of the calculation; the pass-through of past increases in oil prices to consumer energy prices; the rebound in spending as the economy continues to reopen; and the exacerbating factor of supply bottlenecks, which have limited how quickly production in some sectors can respond in the near term. As these transitory supply effects abate, inflation is expected to drop back toward our longer-run goal.”
June 21, 2021
New York Fed President John Williams said today that he believes recent inflation data is mostly due to rapid reopening of the economy and supply chain disruptions.
“I expect that as price reversals and short-run imbalances from the economy reopening play out, inflation will come down from around 3 percent this year to close to 2 percent next year and in 2023.”
Regarding the Fed’s policy, he went on to explain:
“It’s clear that the economy is improving at a rapid rate, and the medium-term outlook is very good. But the data and conditions have not progressed enough for the FOMC to shift its monetary policy stance of strong support for the economic recovery.”
Following some hawkish comments on Friday, the St. Louis Fed’s Jim Bullard appears to have dialed it back this morning:
BULLARD SAYS NO ONE REALLY KNOWS HOW THIS IS GOING TO UNFOLD BUT NEED TO BE READY FOR UPSIDE RISKS TO INFLATION
BULLARD SAYS THE COMMITTEE IS ONLY NOW STARTING TO TALK ABOUT TAPERING AND IT WILL TAKE SOME TIME TO GET THAT UP AND RUNNING
BULLARD SAYS LOW INTEREST RATE AND LOW INFLATION RATE ERA IS NOT ENDING ANY TIME SOON
Bullard: There Are Legitimate Questions About Fed Buying Mortgage Bonds
This upcoming week will be relatively light on the economic data front but should be chock full of Fed speakers. Jobless claims on Thursday bear watching to see if the recent downward trend continues. Friday will feature the PCE price index for May. This is the Fed’s preferred measure of inflation.
Given the Fed’s change in tone last Wednesday, we will closely follow Fed speakers. Many Fed members were already calling for the Fed to taper sooner than Powell was alluding to. Inflation is clearly becoming a concern of the Fed. As such, we will see if their calls for taper become more urgent. If Bullard’s recent comments that we shared are any indication, the market may be volatile.
Owners Equivalent Rent (OER), a proxy for housing costs, accounts for about a quarter of the CPI number. Rents are on the rise as discussed in a CNBC article entitled- Rents for single-family homes just saw the largest gains in nearly 15 years. While housing prices were rising double digits, rental costs were not following. Recent data, some of which is included in this article, shows that rental prices may finally be playing catch up. If so, they will provide a further boost to CPI levels.
Per the article: “Single-family rents were up 5.3% year over year in April, rising from a 2.4% increase in April 2020, according to CoreLogic. That is the largest gain in nearly 15 years.”
At Wednesday’s FOMC press conference Powell used the word “transitory” twice, compared to 9 times at the prior meeting in late April. He also voiced concern that inflation might be “persistent”. While parsing what we think the Fed is thinking is difficult, both examples suggest the Fed is much more concerned about inflation today than a month or two ago.
The market action since Wednesday’s Fed meeting has taken a decidedly deflationary bias. Since Wednesday afternoon, the 30 year UST yield has fallen from 2.23% to 2.10%. Commodity prices like copper and oil are off 5% and 3%, respectively over the same period. The NASDAQ rose 1.25% yesterday while the commodity heavy Dow fell by 0.60%.
Gold and silver were closely tied to bond yields and deflationary sectors over the prior month or so. Days in which inflation expectations fell and technology rose gold tended to do well. That has not been the case the last two days. We are keeping a close watch on precious metals to see if the correlation of the last month is breaking down. The dollar index is up nearly 2% over the last two days, which also helps explain gold’s weakness.
“Should we prepare for a sneaker shortage now? Get ready, folks…” That was the last line of a great Business Insider article entitled Why the World Is In a Shipping Crisis. We recommend reading it as it details problems in the transocean shipping industry that are driving shortages of many popular goods. One factor the author mentions is the surging price of shipping containers. The graph below, courtesy of Arbor Research, shows the dramatic price increase of containers since the start of the year.
The graph below, courtesy of Arbor Research, shows the tremendous inflows of money into ETFs that benefit from higher levels of inflation.
June 17, 2021
The graph below, courtesy of Arbor Research, shows the sharp drop in inflation expectations following yesterday’s Fed meeting. Market activity across many asset classes concurs, pointing to expectations for a more hawkish Fed going forward.
With the Fed boosting their inflation forecast it seems the only factor preventing the Fed from tapering sooner rather than later is the employment situation. As such, weekly jobless claims, in addition to the monthly BLS/ADP reports are important to keep a close eye on. If claims continue to decline, as they have done for the last three months, it will support yesterday’s shift in the Fed’s outlook about tapering. Initial jobless claims rose from 375k to 412k this past week. Prior to the Pandemic, claims were running in the low 200k’s per week. If the downward trend continues, claims will pierce 300k in one or two months and possibly normalize in the fall. Keep in mind the trend is predicated on continued economic recovery which may become trickier as the various forms of fiscal stimulus wane.
Tomorrow is quadruple witching day, one of four days each year in which index futures, options futures, stock options, and stock futures expire on the same day. Often, the confluence of expirations can lead to increased volatility as investors unwind their futures and/or options positions before contracts expire.
The popular narrative helping explain why Treasury yields are falling revolves around investors buying into the Fed’s belief that the recent bout of inflation is transitory. While it has merits, it’s also worth understanding the supply and demand dynamics in the U.S. Treasury market. Since January 1st, Treasury debt balances have risen by $271bn. At the same time, the Fed has purchased, $441bn of U.S. Treasury bills, notes, and bonds. Despite large deficits, the amount of debt outstanding in the markets has actually shrunk. Foreign holdings of U.S. Treasury securities also rose by approximately $60bn over the period. Simply, the supply/demand equation for U.S. Treasuries has resulted in lower yields. As we have mentioned, Treasury issuance has been lighter than normal over the past few months as they draw down their account at the Fed (TGA). Currently, their account balance is $730bn, down by over $1trln from last year’s highs. It will likely come down another $400bn by October, which should further keep net issuance after Fed purchases flat to negative.
June 16, 2021
Key comments and some commentary from Jerome Powell’s press conference:
“Inflation has risen significantly in recent months”
“Inflation could turn out to be higher and more persistent than we expect“
“Even after liftoff (tapering), policy will remain highly accommodative“
“Before adjusting asset purchases, the Fed would give advance notice”
“Over the summer, prepare to see a lot of job growth”
“Take the dot plots (Fed expectations) with a grain of salt”
He mentioned employment a lot in his opening speech. Given strong economic growth and rapidly rising inflation, employment is the only thing holding the Fed back from tapering QE and raising rates. If he is correct about strong summer job growth, taper could come as early as this fall.
“This is an extraordinarily unusual time. We really don’t have a template or any experience of a situation like this. I think we have to be humble about our ability to understand the data.” – This was his most important line- we are in unchartered territory and neither the Fed nor any “expert” should have full confidence in their economic or market expectations.
*POWELL: THIS WAS A `TALKING ABOUT TALKING ABOUT’ MEETING- In other words, they are now thinking about tapering. Prior to today, even “thinking about, thinking about”, tapering was off the table. He confirmed that with- “Near term discussions that will begin is about the path of asset purchases”
Powell left little doubt that the Fed is now strategizing about when and how to taper.
Bottom line: the Fed’s statement was little changed but the more optimistic changes in their economic projections are hawkish as it implies the Fed will taper and increase rates sooner than expected.
The Fed raised their core PCE inflation forecast for 2021 to 3.0% from 2.2% and the all-inclusive CPI from 2.4% to 3.4%. Further, the consensus of Fed members now expects to increase rates twice in mid-2023. The Fed did not taper mortgage purchases as we suspected they might do. The “dot plot” graph on the left shows the level of Fed Funds that each Fed member expects by year. There are now 7 Fed members that think the Fed will hike rates as soon as next year. There were only 4 in March. The Fed statement barely changed from the last meeting six weeks ago as shown in the second graphic.
The ten-day moving average of the S&P 500 put-call ratio is now at its lowest levels since those seen before the tech crash in 2000. The ratio is the volume of put options divided by the volume on call options. A low ratio, as we have now, denotes there is significantly more interest in making upside bets than taking on downside protection.
Last Friday’s University of Michigan Consumer Sentiment survey shared results for home-buying conditions as seen by buyers and home builders. The first graph below, courtesy of Lohman Econometrics, shows that consumers believe now may be the worst time to buy a home in at least 35 years. The second graph shows the massive divergence between the optimistic view of home builders and their potential customers. As an aside, buying conditions for automobiles also registered the lowest reading going back to the 1980s.
June 15, 2021
Rule #9 by Bob Farrell states: “When all the experts and forecasts agree – something else is going to happen.” Only 2% of those surveyed by Bank of America expect a bear market during the remainder of the year. We caution you, complacency is most often seen at tops, not bottoms.
Bank of America got it right, Retail Sales fell 1.35%. The table below from Brett Freeze breaks down its major components to show how each sector contributed to the data (column on the right). As shown, motor vehicle sales account for -.81% of the decline and building materials -.38%. Auto and home sales are the two hottest sectors over the last few months. Higher prices may finally be having a negative effect on sales. Not surprisingly, food services and drinking were the leading contributors as the economy reopens and people get comfortable going out again.
Producer Prices (PPI) were above expectations. Year over year prices rose 6.6% versus expectations for 6.2%. Core PPI was +5.3% versus expectations of 5.1%.
Retail sales are due out at 8:30 am ET this morning. Expectations are for a 0.4% decline. Bank of America, using its proprietary credit card spending data, suggests the number could be a full 1% weaker than expectations at -1.4%. Retail sales underwhelmed expectations last month as correctly predicted by Bank of America’s spending tracker.
As we wrote last week, we think it is possible for the Fed to reduce QE purchases of MBS as early as tomorrow’s FOMC meeting. Further fueling our speculation is comments from Andy Haldine, Chief Economist of the Bank of England. He states: “As things stand the housing market is on fire.” “There is a significant imbalance between incipient demand and available supply of houses, and because the laws of economic gravity have not been suspended, the result is pretty punchy rises in house prices.” Further, he tied the remarks to widening wealth inequality. Sound Familiar?
In part II of Two Pins Threatening Multiple Asset Bubbles we commented “Who benefits more from rising home prices, the wealthy or the poor? Who tends to rent more, the wealthy or the poor? Fed policy directly supports the housing market, and its benefits are overwhelmingly bestowed upon the wealthy.” The combination of surging housing prices and growing wealth inequality is certainly enough fodder for the Fed to reduce purchases of MBS sooner rather than later.
June 14, 2021
In last Friday’s Technical Value Scorecard, we wrote: “Note also that financials and materials are now both slightly oversold after being decently overbought last week and for many months prior. Both sectors underperformed the S&P by about 2.5%.” The graph below shows the recent weakness in the ratio of financial stocks (XLF) to the S&P 500 (SPY). Since last November, the ratio has bounced off the red support line three different times after dipping below the 50dma. Currently, the ratio is trading below its 50 dma, but it is still above the trendline. A break of the trendline may likely signal further relative weakness for financials and may prove to be another sign that the reflationary trade is coming undone.
Retail Sales and PPI will be released on Tuesday. PPI tends to lead CPI, so we will watch closely to see if rising producer prices start to ease. Housing Starts and Permits on Wednesday are expected to rise slightly. Recent MBA mortgage data shows their purchase index weakening. We shall see if weakening demand translates to less construction of new homes.
Most important this week will be the Fed’s FOMC meeting on Wednesday. We will again be on the lookout for signals the Fed is thinking about tapering. Equally important to Powell’s press conference following the meeting, will be the speeches following from various Fed members. Many have become increasingly outspoken about the need to start considering tapering QE purchases.
In the past, we mentioned that the Treasury accumulated a lot of cash from the stimulus relief bills that were not immediately spent. The excess cash balance sitting at the Fed’s Treasury General Account (TGA) must be reduced significantly by October. The Treasury, with the surplus cash, must significantly lessen its borrowing needs, specifically with short-term Treasury Bills, to meet its mandate.
Banks, hedge funds, and other leveraged investors are highly dependent on said bills as they are used for collateral for many trading opportunities. Further, money market investors are also facing problems finding positive yielding short-term paper as cash balances by retail and corporate investors are running high. As a result of the relative dearth of T-bills and strong demand, banks and money market funds are actively engaging in reverse repurchase (RRP) transactions with the Fed. The graph below shows the daily overnight repo balances at the Fed now account for over 50% of the decline in TGA balances. As we approach the Fed meeting next week, we need to consider if the Fed will take actions to combat short-term interest rates trading below their target. Fed Funds are trading between 5-6 bps versus 10 bps prior to the reduction in TGA balances.
Today’s University of Michigan Consumer Sentiment survey has interesting inflation results. The broad sentiment index increased over the past month with current conditions falling slightly but future expectations rising decently. Of particular interest, 1-year inflation expectations were only 4% versus expectations for 4.7%. 5-10 year expectations were also below expectations at 2.8% versus 3%. Might the consumer also be buying into the Fed’s expectation that inflation will be transitory?
The table below breaks down sentiment by political affiliation. The results show the stunning change in sentiment over the past year based on the change in political power.
The graph below, courtesy of Fundstrat, shows the strong correlation between the change in ten-year UST yields and the change in the ratio of financials to technology. Financials tend to outperform technology as yields rise and vice versa. As we have been writing about on many occasions, financials are part of the inflationary trade and technology along with Treasury bonds part of the deflationary trade. In the technical value scorecard below, we wrote: “One of the key themes this past week is the increasing investor buy-in to the Fed’s expectation that inflation will be transitory. Despite a 5% annual inflation print Thursday, bond yields fell and the deflationary sectors outperformed inflationary sectors.”
It’s too early to see if the market transition to a more deflationary regime will be lasting, but watching yields and the sector rotations, as the graph shows, will be an important and powerful tool.
Next Tuesday and Wednesday, the Fed’s FOMC meets to discuss monetary policy. Due to soaring home prices, we think, it is possible the Fed announces it will begin to reduce its $40bn/month of MBS purchases. If that were to occur, it’s likely to be matched with increased purchases of UST securities. If not, any net reduction of QE would go against the Fed’s forward guidance that they “are not even thinking about, thinking about tapering. The last thing the Fed wants to do is cause investor confusion and potentially harm investors’ confidence in the Fed.
As we wrote in Taper is Coming: Got Bonds?, tapering of QE has actually been good for bond prices in the prior instances. The graph below, from the article, shows that periods of QE – highlighted in gray- were followed by lower 10-year UST yields.
June 10, 2021
Early today we offered caution as the recent bout of low volatility might be a precursor to a move lower. LPL Research takes the other side. As shown below, when stocks are sitting near all-time highs “dull markets” offer decent average returns over the next six months.
CPI was stronger than expected with a monthly increase of 0.6% and year over year rate of 5%. Core CPI rose 0.7% monthly and is running 3.8% year over year, the highest since 1992. As we showed earlier today, used car prices are having a significant influence on inflation data. In today’s report, used car prices rose 7.3%, on top of last month’s 10%. Bond yields are up slightly on the report but equities seem comfortable thus far, posting a slight gain. The graph below shows that CPI, using a two-year annualized rate, is back to pre-pandemic norms.
The sleepy market is potentially a warning signal. The lower graph shows the average true range (ATR) using 10 day periods on SPY. It confirms the recent bout of lackluster trading we are witnessing. More often than not over the last few years, a low ATR resulted in a sell-off of sorts. One problem with relying on a low ATR is that it can drift at low levels for quite a while. It’s worth adding, our proprietary cash flow models are getting ready to turn bearish and the Fed is meeting next week. As such, the potential for a pick-up in volatility is increasing.
The Manheim Used Car Index continues to soar as shown to the left below. The index is up approximately 43% since January of 2020 while the used cars and trucks sub-index of CPI is only up 21%. The second graph compares the Manheim index to the CPI-used car index. Currently used cars only account for 2.57% of CPI, yet despite its low relative importance, substituting Manheim for the BLS data would result in a CPI number that is .57% higher than reported.
The graph on the left below, courtesy of Arbor Research and Trading, shows 10-year sovereign yields, worldwide, are the least volatile they have been in at least 25 years. Essentially, the chart quantifies that bond traders are complacent. Frequently, periods of low volatility are followed by more extreme volatility. The 10-year UST yield graph on the right highlights the latest four low volatility readings as shown on the first graph. The data warns of a big move coming, but not in which direction. With U.S. ten-year yields sitting on support at 1.50%, a break below could introduce the meaningful potential for a push to 1.25-1.00%. Trade carefully.
June 09, 2021
The graph below shows, based on expectations for tomorrow’s CPI data, CPI and Core CPI should peak at 4.65% and 3.41% respectively tomorrow. Thereafter, assuming a 2.5% annual rate of inflation, which is 1% higher than the previous five years, annual rates of CPI will fall throughout the next 12 months. Conversely, Core CPI, the Fed’s preferred method for assessing inflation, will stay at current levels until February 2022 before falling. Assuming a slightly higher 3% rate of inflation going forward, CPI will linger at slightly above 4% this year, while Core CPI will rise to 4% before peaking in early 2022. The Fed is likely following monthly data versus year over year data due to the skewed base effects.
The yield on the 10-year Treasury note broke below 1.50% this morning, down nearly .30% from its highs in March. As shown below, 1.50% has been technical support for yields. If it holds, we suspect yields will rise to about 1.60% where it will test the recent downward sloped resistance line and its 50 dma. A break lower in yield, possibly due to a weaker than expected CPI number tomorrow or hawkish language from the Fed next week, could result in yields falling as far as the 200 dma (1.15%). It’s worth adding, 5-year break-even inflation expectations have fallen from 2.72% in mid-May to 2.47%. Both indicators are currently opining that despite a spike in inflation that may last a few more months, inflation will ultimately be transitory and gravitate back to trend.
The graph below, courtesy of BofA Global Research, shows the power of the massive stimulus payments given directly to citizens. As shown, retail sales are nearly 20% above pre-pandemic levels despite employment which remains almost 10 million jobs below pre-pandemic levels. Had the government not infused massive stimulus, paid directly to individuals, retail sales would look a lot like the employment graph. Mind you, personal consumption accounts for about two-thirds of GDP. As such, GDP would also look like the employment graph. Going forward, with less fiscal stimulus likely, the economy will become heavily dependent on employment making a swift recovery and bolstering jobs and wages back to trend levels.
June 08, 2021
The JOLTS (job layoffs and turnovers) report from the BLS showed the number of new job openings reached another record high at 9.3mm. Despite the number of openings, the number of hires was little changed at 6.1mm. In a positive sign for job growth, the number of separations (quits) increased to 5.8mm, a series high. Workers tend to quit jobs when they are confident in their ability to easily find a better job. Click HERE for the full report. The updated Beveridge Curve below shows the job opening rate is near twice the rate it should be based on historical unemployment data. The conundrum continues: why are businesses not hiring given there are so many unemployed and why are people not taking jobs that are apparently abundant?
The series of charts below, courtesy of @robinbrooksiif, provides a rough profit margin proxy for manufacturers by country. Output prices (vertical) are what firms charge their customers, while input prices (horizontal) are what they pay for goods to produce their products. The dots shifting toward the right and away from the red line over the three-month period is an indication that producers are able to mark up their prices and more than offset the increasing cost of goods used to produce their goods. This is a positive sign for manufacturing profit margins.
The graph below, courtesy of Black Knight, helps partially explain why home prices are soaring. As shown, the number of active sale listings is running at less than half of the average running rate before 2020. Despite higher prices, the number of new listings still lags the average by about 25%. Further, new listings account for more than 75% of listings in April. This is because most homes are selling quickly and not lingering on the market, meaning new listings are largely the only listings. To wit: “Data from our Collateral Analytics group showed there was two months’ worth of single-family inventory nationwide in March, the lowest share on record and trending downward.” The second graph shows the rise in home prices has been relatively equally distributed across the country. LINK to the full report which also includes interesting data on delinquency and foreclosure activity.
Coupled with the lack of supply noted above is relatively strong demand resulting in higher home prices. However, a recent survey by Fannie Mae points to weakening demand which may help counter low supply and provide a headwind to further home price inflation. Per Reuters: “The percentage of consumers who said it is a good time to buy a home declined in May to 35% from 47%, Fannie Mae said in its monthly survey of the U.S. housing market. This reading, the lowest since Fannie Mae began the survey about a decade ago, marked the second straight monthly decline and represented a drop of 18 percentage points since March.”
Treasury Secretary Janet Yellen, during a weekend speech, made the following comment: “Higher interest rates would be a plus for the U.S. and the Fed.” We are unsure of what to make of her comment, but assume she is looking forward to a time the Fed can raise rates because the economy and jobs market is fully recovered.
Economic data will be in short supply this week. On Tuesday, the BLS will release the JOLTs report. On the heels of last week’s employment reports, it will be interesting to see if the job openings rate remains at record highs. Thursday will feature the all-important CPI report.
Fed members will go into a media blackout this week in advance of the next FOMC meeting on June 16th.
A couple more concerning tidbits from Friday’s employment report. Service producing jobs produced 556k of the 559k new jobs. These tend to be lower-paying jobs. Secondly, the graph on the right, courtesy of Brett Freeze, shows temporary help service growth has stopped increasing on a quarterly basis. Temporary help and GDP growth are well correlated as shown in the graph on the left.
Bloomberg recently published a great article highlighting the surge in the price of materials used to build houses. In their article, Building a home in the U.S. has never been more expensive, they open the financial books of a Boise Idaho based construction company and break down the cost increases of products used to build a new house. Based on this one builder, the cost to construct a new home has risen 58% from the pre-pandemic period. The following are a few of the examples the article shares:
The graph below, courtesy of the Peterson Institute, provides context for the jobs recovery and the 10 million job shortfall from the pre-pandemic trend. This is the key statistic that concerns the Fed and keeps them from tapering QE and or raising rates.
The BLS employment numbers were underwhelming. Payrolls grew by 559k versus expectations of 650k. More importantly, following the strong ADP report, many market prognosticators thought the number of new jobs could approach 1 million. Possibly more concerning is the monthly change in hourly earnings only rose by 0.5%. Expectations were for a gain of 0.7%. Wages are not keeping up with the spike in inflation, especially for necessities like food, energy, and shelter. The labor participation rate continues to languish, coming in at 61.6%, 0.1% lower than last month. The U-6 which is the broadest measure of unemployment was 10.2%, down from 10.4%. Jerome Powell has mentioned that this indicator is a truer measure of unemployment. As we look forward it is worth noting Thursday’s Challenger report showed job openings were at the lowest level in a year.
Glenn Kelman, CEO of Redfin (@glennkelman), posted a series of Tweets about the state of the housing market. We share a few of the most interesting comments, but urge you to read the entire thread as it is very telling about the state of the real estate market.
It has been hard to convey, through anecdotes or data, how bizarre the U.S. housing market has become. For example, a Bethesda, Maryland homebuyer working with @Redfin included in her written offer a pledge to name her first-born child after the seller. She lost.
There are now more Realtors than listings.
Inventory is down 37% year over year to a record low. The typical home sells in 17 days, a record low. Home prices are up a record amount, 24% year over year, to a record high. And still homes sell on average for 1.7% higher than the asking price, another record.
In 2020, new-construction permits were *down* 13% in DC and New York, 40% in LA, 48% in Chicago, 50% in Seattle, 79% in San Francisco. Permits were *up* 25% in Miami, 56% in Vegas, 96% in Greenville, 122% in Detroit, 246% in Knoxville.
In Redfin’s annual survey of nearly 2,000 homebuyers, 63% reported having bid on a home they hadn’t seen in person.
For low-tax states, 4 people move in for every 1 who leaves. For Texas, this ratio is 5:1; for Florida, 7:1. Cites & states have no leverage to raise taxes, after many promised new money for social justice; the federal government will have to fund long-term investments.
The average housing budget for out-of-towners moving to Nashville was $720K, ~50% higher than locals’ $485K budget. It used to be coastal elites who worried that every adult in the family had to win a career lottery, just to afford a home. Now that feeling may spread.
it’s not just income that’s k-shaped, but mobility. 90% of people earning $100,000+ per year expect to be able to work virtually, compared to 10% of those earning $40,000 or less per year. The folks who need low-cost housing the most have the least flexibility to move.
The ADP jobs report came in much stronger than expectations at 978k versus 650k expected. Last month’s figure was revised lower by nearly 100k to 654k. The current estimate for tomorrow’s BLS report is +645k jobs. While the ADP data is a great sign for economic recovery, the improving employment market also signals an end to excessive monetary policy. Further improvement may be a case where good news is bad news for the markets.
Yesterday we discussed how the Momentum (MTUM) ETF has switched from growth stocks to value stocks. The same is occurring in other factor-based ETFs. For instance, the two top holdings of IWN, the iShares Russell 2000 Value ETF, are GameStop (GME) and AMC Entertainment (AMC). Both stocks have risen considerably to valuations that are extreme. They are about as far from value as one can imagine. The scatter plot below shows that AMC’s valuation is now approximately 10x its historical valuation based on revenue. One can easily argue the number is even higher as the movie theater industry will likely not fully recover from the Pandemic due to the growing popularity of streaming services.
Last night, the Federal Reserve said they will shortly announce plans to wind down their Secondary Market Corporate Credit Facility (SMCC). The announcement is a far cry from tapering QE, but it is another reversal of pandemic-related actions. The facility only owns $13.8 billion of corporate bonds and ETFs.
The graph below is yet another way to assess inflation expectations. The Citi Inflation Surprise Index measures economists’ consensus forecasts for inflation versus actual inflation readings. The higher the level, the more the economists underestimated inflation. Conversely, negative readings mean they overestimated inflation. As shown, they are currently underestimating inflation by the largest amount since at least 1998.
The scatter plot below compares each monthly instance of 5 year UST yields with the Core PCE inflation index. As shown, the relationship over the last 30 years has been statistically significant. The orange dot shows today’s instance is straying far from the historical relationship. Either, the market thinks inflation is transitory and not pricing it into bond yields or the Fed, via massive liquidity injections, is artificially suppressing yields by about 4%.
June 02, 2021
In last Friday’s Technical Value Scorecard, we noted the popular ETF MTUM, which holds momentum stocks, has been shifting from a growth orientation to value, as sectors benefiting from inflation were showing the most momentum. To wit: “It is important to note that MTUM shifts its holdings based on individual stock momentum readings. In March TSLA, MSFT, AAPL, AMZN, and NVDA were the top five holdings. Today Tesla remains the top holding, but JPM, BRK/B, DIS, and BAC make up the remaining four. The index is more biased toward inflationary sectors versus disinflationary than it was 3 months ago.” The graph below, courtesy of Lohman Econometrics, shows that purely as a result of the shift of stocks comprising momentum indexes becoming more value-oriented, the forward P/E ratios are collapsing.
Our equity allocation decisions to different sectors and companies have been heavily focused on those most affected by the question of whether or not the recent bout of inflation is transitory. The graph below, courtesy of @jsblokland, shows the strong correlation between the price of oil and inflation expectations. The price of crude oil has not been able to break above $70 since 2019. It is once again closing in on $70. A break above $70 will provide further warning that the inflationary trade may have more room to climb and with it, Value, energy, financials, and materials may continue to outperform.
The Fed has repeatedly said they will not consider tapering QE or raising rates until they meet their 2% inflation objective. Over the past year, they switched their inflation target from monthly indications of inflation to its average over time, although they have not been specific about the time frame in which to average inflation.
Regardless, the table below shows the Fed’s preferred inflation gauge Core PCE (excluding food and energy) and the widely followed Core CPI. As shown, both indicators, over most time frames, are near or above 2%. Note the 6-month data is annualized. Given they are likely comfortable with their inflation target, the focus will be on employment data for signs the Fed may be ready to taper QE or raise rates.
On Friday we noted that the Chicago PMI report was strong except for the labor component. Today, the ISM manufacturing report was slightly better than expected but shows similar weakness in employment. The employment sub-index fell from 55.1 to 50.9, a six-month low, and is now barely in expansion territory.
The graph below from Brett Freeze shows the statistically significant correlation between the ISM index and the year-over-year change in ten-year UST yields. If the ISM is topping, as is probable, yields are likely to fall.
Over the weekend, China’s central bank (PBOC) took steps to reduce the value of their currency which has been surging versus the U.S. dollar. Specifically, they are forcing their banks to hold an additional 2% of their foreign exchange in reserves. In theory, this will reduce the supply of dollars in China and likely weaken their currency. From the U.S. perspective, the action should help temper inflation. America imports more goods from China than any other country. The strengthening yuan was making Chinese imports more expensive. From China’s perspective, it was making Chinese goods less competitive from a pricing perspective. The graph below shows the significant appreciation of the yuan versus the dollar since the Pandemic started. (a lower yuan/$, as shown below, denotes strength of the yuan as it takes less yuan to buy a dollar) Please click HERE for a Bloomberg article with more on the topic.
After last Friday’s strong Chicago PMI report, we get more manufacturing data today with ISM and Dallas Fed Manufacturing. The prices sub-index in the ISM report is expected to rise to 90, a level that was last recorded over 12 years ago. This week we will also get an update on the labor markets with ADP on Thursday and the BLS report on Friday. Economists are forecasting a 600k increase in payroll in the ADP report and 610k in the BLS report. Last month the BLS report was much weaker than expectations at +266k. Another weak report would be concerning as it signals job growth may be slowing at a faster pace than assumed by most economists.
Bloomberg reports that gold stored at the Bank of England has been selling for a premium. The implication, per the article, is the central banks, via the Bank of International Settlements (BIS), are buying gold. If true, their actions should provide a bullish tailwind for the price of gold. For more read BOE Gold Commands High Premium, Signals Central Bank Buying.
May 28, 2021
The Chicago PMI, measuring economic activity in the midwest, rose to its highest level in nearly 50 years. As noted in the report and shown below, all of the sub-indexes rose except employment. While the report is historically strong, it points to current supply line constraints and importantly a lack of confidence in the future. If confidence were stronger we would expect employment to rise. Simply, employers are not fully committing resources, likely under the assumption that current levels of activity are not sustainable.
“Chicago Business Barometer™ Pushed On To 75.2 in May The Chicago Business BarometerTM, produced with MNI, jumped to 75.2 in May, the highest level since November 1973. Demand provided a boost to business activity, but supply chain constraints remain. Among the main five indicators, New Orders and Order Backlogs saw the largest gains, while Employment recorded the only decline.“
Personal Income and Consumption data, shown below, remains extremely volatile due to the rounds of stimulus checks. Most important in this data series are the price indexes (PCE price index). April’s PCE was +0.6% monthly and +3.6% versus last year. Core PCE, excluding food and energy, rose from 0.4% in March to 0.7% in April. The Fed will pay close attention to that Core PCE trend to assess how transitory inflation is.
President Biden will propose a $6 trillion dollar budget for 2022 over the coming days. Per the administration, the deficit would remain around $1 trillion. To help assess the reality of their assessment, consider for the last 5 years, prior to the pandemic, tax spending average $4 trillion, while tax receipts averaged around $2 trillion per year. Taxes are expected to rise, but not likely enough to cover the additional deficit resulting from the increased spending. From an investment perspective, this matters because the Fed will have little choice but to support spending via very low-interest rates and more QE.
Yesterday we mentioned that Fed taper chatter is increasing. We follow up with an article from Zoltan Pozsar, Credit Suisse’s Fed analyst. Like us, he believes the Fed will taper QE in the coming months. The problem facing the Fed is the potential negative effect of tapering on asset prices. Zoltan offers a way for the Fed to reduce asset purchases with the help of Wells Fargo. As background, currently, Wells Fargo has a regulatory cap on asset purchases.
Per Zoltan: “While lifting Wells Fargo’s asset growth ban now would do more harm than good, it could come in handy when the Fed commences taper later this year or next. The market assumes that taper will lead to a sell-off in rates, like in the past–but that need not be the case. The Fed could announce its plans to taper, while at the same time announcing the end of Wells Fargo’s asset growth ban, so that fewer purchases by the Fed would be offset by more purchases by Wells.
Less buying by the Fed and more buying by Wells Fargo…”
The latest chatter on taper from Fed Vice Chair Randy Quarles:
“If my expectations about economic growth, employment, and inflation over the coming months are borne out, it will become important for the FOMC to begin discussing our plans to adjust the pace of asset purchases at upcoming meetings…”
May 27, 2021
Pending home sales fell 4.4% monthly versus expectations for a small gain. With the recent decline in new home sales, it appears the housing market is finally starting to cool off a bit.
Initial Jobless Claims continued to fall, reaching 406k this past week. Other than the past year, one has to look back to 2011 to find a higher number of new claimants. While the trend lower in claims is great, it is still confounding that such a large number of people are losing jobs on a weekly basis.
It seems with each passing day the volume of media discussion about the Fed tapering its QE purchases increases. Yesterday we published, Taper Is Coming: Got Bonds? to help our readers assess how bond yields and related interest-rate sensitive equities perform during QE and afterward.
To wit: “Currently, yields are close to their cycle highs. If we believe the Fed is nearing tapering, yields could be peaking. Based on prior QE taper experiences, a yield decline of 1% or even more may be in store for the next six months to a year if the Fed is, in fact, on the doorsteps of tapering.”
The graph below shows that 5yr, 10yr, and 30yr UST bonds are in multi-month consolidation patterns following a spike higher in yield. From a technical perspective, these patterns resemble bullish flags. Based solely on the pattern, we would expect them to break out higher in yield by about the size of the “flag pole.” In the case of the ten-year (orange) that would entail a .75bps increase to approximately 2.25%. The opposite of a bullish flag, a bearish flag, can be found in the 3 bonds during the fourth quarter of 2019.
While cognizant of the pattern and the potential for higher yields, we believe bonds may be ready to break lower in yield due to the potential for a sooner than expected Fed taper of QE. A break below the flag support lines would provide some confirmation. We recently added a very small position of TLT, but remain well underweight bond duration in our benchmark. We are closely watching and ready to react in either direction, as the charts are signaling the potential for a large move.
May 26, 2021
Typically inventories of crude oil and its byproducts increase going into the summer months. As shown below, courtesy of TFA, inventories for all products declined in an atypical fashion last week. If oil usage reverts back to levels of 2019 and prior, and inventories do not pick up, we run the risk of higher short-term oil prices.
Yesterday we noted the record surge in two home price indexes. Housing makes up almost one-third of the CPI Index, yet despite surging home prices, the housing component of CPI is relatively docile. The graph below, courtesy of Macrobond, highlights the discrepancy between the FHFA price index and CPI-shelter. In 2019 we wrote an article on MMT and discussed flaws in inflation reporting. In regards to home prices, we wrote: “The BLS replaced an index based on actual home prices with what is now called owner’s equivalent rent (OER). OER is a rental equivalence that calculates the price at which an owned house would rent. It is important to note that rents were then and continue to be a part of the CPI calculation.”
The next graph updates analysis from the aforementioned article to show that CPI would 2.58% higher if the CPI calculation used the Case-Shiller Home Price Index instead of its OER calculation.
May 25, 2021
Consumer Confidence in May fell slightly to 117.2 from 117.5. The present situation index rose sharply to 144.3 from 131.9 while the future expectations index dropped to 99.1 from 107.9. Such a divergence will likely be a headwind for larger consumer purchases. Personal Consumption makes up about 2/3rds of GDP, therefore consumer confidence is an important factor drive economic growth.
Both the FHFA and the Case-Shiller Home Price Index beat expectations. On a year-over-year basis, the FHFA index is now up 13.9% while Case-Shiller is up 13.3%. The FHFA’s 13.9% increase is the fifth straight record in the series dating back 30 years. The Case-Shiller number is the strongest since late 2005. Strong housing data provides the Fed a reason to reduce MBS QE purchases. Currently, they are buying $40bn a month.
The graph below from the Atlanta Fed provides more clues about the potential future path of inflation. The Atlanta Fed breaks all goods and services included in the CPI calculation into 2 categories, sticky and flexible. Sticky are those goods and services whose prices do not change often. Per the Fed: “Because these goods and services change price relatively infrequently, they are thought to incorporate expectations about future inflation to a greater degree than prices that change on a more frequent basis.” The r-squared between the core sticky price index and core CPI is .97, denoting a strong statistical correlation. The core index removes volatile food and energy prices.
Sticky prices are recovering but still below levels preceding the pandemic. The sticky price data series does not point to lingering inflation. On the other hand, the year-over-year change in the flexible pricing index is at ten-year highs. The flexible core index is at its highest level since the 1980s.
@not_jim_cramer offers a series of graphs below showing eight market gauges that should be of concern for investors. Seven of the eight graphs use red dots to compare current levels to prior similar levels. The graph without dots (left side, third from the top) compares the Fed’s balance sheet to forward P/E’s. The takeaway from this series of graphs is to buy stocks when the Fed is buying, but heed the warnings from the other seven graphs when the Fed stops.
May 24, 2021
Electric vehicle (EV) lithium-ion batteries rely on five critical metals: cobalt, graphite, lithium, manganese, and nickel. Per The Elements Newsletter, China is currently the number one ranked country based on their resource, mining, and refining capacity of the aforementioned metals. They are expected to maintain a dominant position until at least 2025. The United States currently ranks 15th and is expected to move up to 13th by 2025.
The Chicago Fed National Activity Index is the latest economic indicator to fall short of economists’ forecasts and the prior month reading. The Index comprised of 85 national economic indicators rose 0.24 versus a prior reading of 1.71 and expectations for a 1.2% increase. Production and Income accounted for about 2/3rds of the increase. Employment indicators rose slightly while personal consumption and housing fell slightly. Based on recent data, it is looking likely that the greatest effects of the latest round of fiscal stimulus are behind us and the economy is beginning to slow.
Economic data will be light heading into next Monday’s Memorial Day holiday. On Tuesday we get FHFA and Case-Shiller data on home prices. Both are expected to slow slightly from last month’s pace but are still running at very high rates. On Friday The BEA will release personal spending, personal income, and the PCE price index. These are key components of GDP and should help economic forecasters hone in on second-quarter economic growth. Also on Friday is the University of Michigan Consumer Expectations Survey. Again we will focus on the inflation expectations sub-index.
For what it’s worth, the Cleveland Fed sees little inflation on the horizon. The graph below shows their expected one and two inflation rates. We added a third line (Red) that computes, based on the one and two-year expectations, what the one-year inflation rate expectation is for one year from now (1×1). As shown, the forward rate is well below the Fed’s 2% target and less than pre-pandemic expectations.
May 21, 2021
The graph below, courtesy of Arbor, uses interest rate derivative markets to arrive at market odds for inflation over the next five years. The markets assign a 99% chance of greater than 1% inflation and 40% odds inflation runs greater than 3%. As we noted in Foreseeing The “Flation” Knuckleball, “However, we do not think markets are ready for a resumption of deflationary forces or a more pronounced outbreak of inflation. It is these two outliers where a fat pitch may lie.” The graph backs up the statement as the markets are not betting on deflation or stronger inflation. Also, note the big shift in expectations from September 2019 to today.
The graph below, courtesy of The Market Ear, shows the strong correlation between Tesla and Bitcoin. The author notes the two “assets” remain the number one emotional trades.” Not only are many investors of each asset emotional, but they are, to some degree, driving investor behaviors of the broader risk markets. As such, watch the “generals.” Quite often their price action leads markets. Both Bitcoin and Tesla were due healthy corrections. We now watch to see if they resume their uptrends or we must contemplate what comes next if they are indeed in bubbles as some investors believe.
Yesterday afternoon Jerome Powell and the Fed announced they will release a paper this summer exploring digital payments, with a focus on the possibility of issuing a U.S. central bank digital currency (CBDC). His short speech can be watched HERE.
A subscriber asked our thoughts on the graph below from ZeroHedge. Specifically, she noted that overnight reverse repo transactions transacted by the Fed just passed last March’s highs. Should we be concerned?
The Fed offers overnight reverse repo transactions (RRP) in which they lend securities in exchange for money. From the perspective of the counterparty, a bank or money market fund, they are making an overnight investment. The reason for today’s popularity is different than a year ago. In March of 2020, some money market investors wanted to reduce their credit risk and opted to invest with the Fed over weaker counterparties. At the time they were willing to accept a lower rate for the security offered by the Fed. Today, some overnight investment options have negative yields while the Fed’s RRP program has a floor of 0%. As such, investors are simply choosing a higher-yielding option in RRP.
The uptake in RRP usage is not a sign of a healthy funding market as it points to a shortage of collateral. Collateral is needed to create leverage. Many asset markets have been bolstered by extreme amounts of leverage. As such the situation bears watching.
May 20, 2021
The Philadelphia Fed Manufacturing Index fell sharply to 31.5, but still indicates a strong expansion. The Future Expectations Index also fell by a similar rate. The decline occurred despite the Price Index hitting the highest level since 1980. Also of note, the number of employees fell from 30.8 to 19.3. The index and all sub-indexes are all still in expansion mode but slowing. The special question of the month involved the outlook for prices the firm will receive and consumers will pay. The table below shares the inflation outlook.
Initial Jobless Claims fell to 444k in the prior week and continue to decline at a decent rate. Total continuing claims is also falling but still stands at a high number, just under 16 million. Continuing claims are more difficult to assess as it’s likely a portion of these claimants are seeing their claims period expire but are still jobless. It is also unclear how many “gig-economy” workers are included.
The chart below, courtesy of All Star Charts, shows the economic surprise index has been positive for a record 240 consecutive days. The index measures economic forecasts versus actual economic data. A positive number, as we have had, means economic forecasters have underestimated the pace of economic activity. It appears that after two-thirds of a year, forecasters finally have a better grip on what’s driving economic activity. With that comes the risk they begin to overestimate data, and as such, investors find economic activity disappointing. The recent labor and retail sales reports are two such examples.
The chart below shows margin debt as compared to the S&P 500 as well as the annual change in margin debt in the lower graph. Margin debt can be called from the borrower by the lender if markets become volatile. They can also be paid back by the borrower if they deem conditions too risky and want to reduce risk exposure. Margin debt growth can continue to propel markets higher but at the same time, it increasingly becomes a potential hazard if it declines.
On Monday we shared how Bitcoin, Tesla, and other market leaders have recently been falling sharply. If the correlation between Bitcoin and equities holds up, and Bitcoin continues lower, caution is warranted, as shown below.
May 19, 2021
Today’s FOMC minutes show there are some Fed members that are near ready to taper. To wit: “A number of participants suggested that if the economy continued to make rapid progress toward the Committee’s goals, it might be appropriate at some point in upcoming meetings to begin discussing a plan for adjusting the pace of asset purchases.” On the other hand, the minutes also said: “It would likely take some time before significant change is made.” The Jekyll and Hyde opinions within the Fed are likely a way for the Fed to prepare the market’s for tapering, yet have the excuse to delay tapering for much longer.
The following headline hit the wires this morning. BULLARD: U.S. MAY BE “GETTING CLOSE” TO POINT WHERE PANDEMIC IS OVER, THEN ATTENTION COULD TURN TO POST-PANDEMIC MONETARY POLICY
St. Louis Fed President Bullard is one of the more dovish Fed members. As such, his comment alluding to “getting close” to tapering (post-pandemic policy), is another sign the Fed is inching closer to tapering despite its official statements.
As shown below, courtesy of Investing.com, many cryptocurrencies are having a rough morning and, for that matter, week. Double-digit percentage gains or losses are somewhat commonplace for cryptocurrencies, so the recent downtrend may not be a concern for crypto investors. For the rest of us, they are worth watching as crypto and other more traditional risk assets have become somewhat correlated. To wit, equities are currently down over 1% this morning, and as shown in the FINVIZ heat map below, almost every other asset class except the dollar is trading weaker.
The graph below, courtesy of Ally Invest, goes a long way in explaining why there are shortages of so many consumer goods and resulting inflation. As we showed last week, retail sales are now 15% above the trend of the last decade. At the same time, retailers did not anticipate such a surge in demand and did not stock up their inventories appropriately. It is highly likely retail sales will fall back to the trend unless there are more stimulus packages that directly aid citizens. Inflationary pressures should subside if retails sales retreat to the trend. On the other hand, if retail sales maintain at current levels, retailers will have to bulk up their inventories which will further pressure prices to the upside. Essentially, the graph below is saying that retailers do not have much confidence in the sustainability of stimulus-induced spending.
The graph below, courtesy of Nordea, shows Chinese credit growth is shrinking rapidly after ramping up during the pandemic. Given China is the world’s largest importer of commodities, the relationship between credit growth and commodity prices has been relatively strong. Note, the credit impulse is pulled ahead by a year in the graph to show the one-year lag between commodity prices and Chinese credit. Might the recent downturn in credit growth be a harbinger for much slower growth in commodity prices shortly? Nordea helps answer the question: “the clear roll-over in the Chinese credit data could be the canary watch.”
May 18, 2021
Housing Starts were much weaker than expected, falling by 9.5% versus expectations of -2%. The decline was led by single-family home starts which fell by 13.4%. Building permits grew by +0.3%, slightly less than expectations and below the last month’s 1.7% pace. We have mentioned higher mortgage rates along with surging house prices and commodity prices would dampen new housing construction. We should add, the record cold snap in the midwest and Texas and the effect it had on home construction is still resulting in quirky data.
The dollar index is opening down 35 cents this morning and trading below 90. It is now within 30 cents of the low for this recent downward trend of 89.40 on April 1, 2021. Prior to that, the dollar had not traded below 90 since early 2018. The catalyst appears to be the Fed which seems to have no intentions of raising rates or tapering QE.
The graph below provides historical context for its current level as well as technical guidance. As shown, the dollar is sitting on the lower support line of a 10+ year wedge pattern as well as a horizontal line of resistance that turned into support. Both levels of support argue for a stronger dollar or at least a bounce. However, if support doesn’t hold, the dollar could tumble from current levels. A weaker dollar would provide further tailwinds for higher commodity prices and other imports.
The key to successful investing these days is to properly forecast the current and future path of inflation. A large part of the analysis is gauging how much longer supply line-related shortages will continue. Bloomberg published The World Economy Is Suddenly Running Low on Everything yesterday which helps explain why these shortages are occurring. The article also gives a concerning forecast as highlighted below.
“For anyone who thinks it’s all going to end in a few months, consider the somewhat obscure U.S. economic indicator known as the Logistics Managers’ Index. The gauge is built on a monthly survey of corporate supply chiefs that asks where they see inventory, transportation and warehouse expenses — the three key components of managing supply chains — now and in 12 months. The current index is at its second-highest level in records dating back to 2016, and the future gauge shows little respite a year from now. The index has proven unnervingly accurate in the past, matching up with actual costs about 90% of the time.”
May 17, 2021
It is worth adding to the prior comment that three other market leaders of the past few months are also struggling. Bitcoin is now down over 30% from recent highs to 42,000 while Tesla and ARKK (Cathie Woods ARK innovation ETF) are both down nearly 40% from their respective February highs. Bitcoin is resting just above its 200-day ma, while TSLA and ARKK have broken below it.
From March of 2020 until about a week ago, the price of lumber rose over 600%. While still greatly elevated from last year and years prior, its price is finally showing weakness. The graph below shows that lumber is down nearly 25% in the last 6 trading sessions. From a technical perspective, the prior two weeks of trading formed a bearish engulfing pattern, whereas the high and low last week exceeded the highs and lows from the prior week. Continued weakness would confirm the pattern represented a top. Further downside, along with weakness in other essential commodities, might alleviate some broader inflationary fears.
The New York- Empire State Manufacturing Index dipped slightly but remains at a very high level. However, prices paid and prices received surged higher to their highest levels since at least 2000.
Economic data this week will largely be focused on the housing sector. Today, the NAHB will release their Housing Market Index, followed by Housing Starts and Building Permits on Tuesday. Existing Home Sales will be released on Friday. Both Housing Starts and Permits are expected to decline from the torrid pace set earlier this year. Higher mortgage rates and surging prices for copper, lumber, and other commodities used to make homes are certainly a growing concern for homebuilders.
In recent months we have relied heavily on implied inflation expectations to help guide our allocation decisions. Periods where expectations were rising led to a clear outperformance of materials, energy, and financial companies. Tech, staples, and utilities tended to benefit when inflation expectations stabilized. What makes this analysis very difficult is that “market-based” inflation expectations are not really market-based anymore. The graph below shows the Fed has bought significant amounts of TIPs and Notes and Bonds, which can lead to distortions in these markets, and therefore skewed implied inflation calculations.
The University of Michigan Consumer Sentiment Survey data was decidedly weak as shown below. Interestingly weakness was equal for both current conditions and future conditions. Driving the weakness is likely inflationary concerns. The long-term inflation expectations rose to 3.1% from 2.7% last month.
As if supply lines were not fractured enough, the Mississippi River is closed to barge traffic near Memphis due to concerns over a bridge. Currently, there are 771 barges awaiting passage. Per CNBC– “The shutdown fueled concerns about shipping U.S. grain and soy to export markets at a time when global inventories are slim and prices are near eight-year highs.”
Retail Sales were much weaker than expected as shown below. The control group, which feeds GDP, was down 1.5% versus an expected slight increase. On the plus side, last month’s data was revised higher. The markets seem to be taking the data in stride with stocks and bonds at similar levels as prior to the release.
April Retail Sales are due at 8:30 ET this morning. Expectations are for a 1% increase, following last month’s 9.8% gain. March retail sales greatly benefited from stimulus checks. It would not be surprising to see a big deviation today from expectations as the timing of the stimulus checks and when/how they were spent is very difficult to forecast. Based on their credit card spending trends, Bank of America expects a decline in retail sales.
As we have discussed, base effects (comparison versus last year’s data) make price inflation appear much higher than it actually is. The graph below puts the CPI indexes in context with their trends of the last five years. Currently, the broad CPI index is only .011% above its trend. Core CPI, which excludes food and energy, is running 1.06% above its trend. If the inflationary impulse is in fact transitory and dies out over the next few months, inflation data will end up close to where it would have been had there never been a pandemic.
Almost a year ago Tim Duy wrote a powerful editorial for Bloomberg about how expects the Fed to maintain ultra-easy policy going forward. With inflation running hot and the recovery maturing, it is worth reviewing the summary paragraph of his article as we consider how the Fed might react to high inflation.
“The implication for financial markets is that the Fed expects to hold policy very easy for a very long time. They will reinforce this stance with enhanced-forward guidance and, eventually, yield-curve control. As long as inflation remains below 2%, the Fed will push back on any ideas that they will tighten policy anytime soon. And even inflation above 2% wouldn’t guarantee tighter policy if the Fed concluded the overshoot was transitory. Don’t doubt the Fed’s resolve to keep policy accommodative. They will keep reminding you if you forget.”
May 13, 2021
The charts below show that many of the grain futures have given up some of their recent gains. Crude oil is down over sharply today as well. While not a trend yet, a continued sell-off in these commodities and others will help relieve recent inflationary pressures.
PPI came in hotter than expectations, but much less so than yesterday’s CPI report. Of note, monthly PPI rose 0.6% which was more than expectations of 0.3%, however, last month’s gain in PPI prices was 1%, meaning the rate of increase is slowing. The year-over-year gain of 6.2% was above expectations for 5.9%. Based on the initial market reaction, the higher than expected PPI figures were priced in.
Jobless Claims continue to forge lower, coming in at 473k versus 498k last week.
Cryptocurrencies are opening up down 10-15% after Elon Musk said Tesla would suspend accepting Bitcoin for new purchases due to the excessive energy use required to mine Bitcoin. Prior to the announcement, Tesla bought and held a sizeable chunk of Bitcoin for “liquidity purposes” and Musk was a self-professed fan/promoter of Dogecoin. Given the wasteful energy use was a widely known fact, the announcement seems odd and we are left to wonder if there is more to the announcement.
On the heels of yesterday’s hot CPI report, PPI is due out at 8:30. The consensus estimate actually points to slower producer price growth on a monthly basis. The monthly PPI core (excluding food and energy) is expected to climb 0.4%, versus 0.7% last month. On a year over year basis, it is expected to rise 3.7% from 3.1%.
The graph below shows the difference between CPI and Fed Funds. The last time the difference was as large as it is was June of 1980. The Fed is making a big bet that inflation is transitory.
The graph below, courtesy of Sven Henrich, is a unique way to show the bubble environment. Wealth should stay relatively proportionate with the output of a nation. As shown, it currently sits well above what has been historically normal since at least 1950 and above two prior peaks. The last two times the ratio spiked higher (dot com bust and financial crisis) were followed by significant drawdowns in many asset markets. This time is not likely to be different, however, timing the eventual reversion to the mean is very difficult.
May 12, 2021
A subscriber commented to us that they thought the five-point increase in the VIX (as of 3 pm ET) was excessive given the S&P was only down by 1.6%. The scatter plot below charts daily changes of the VIX and S&P over the last five years. The orange dot shows that the relationship today is in line with the historical correlation.
CPI was much higher than expectations on a monthly and annual basis as shown below. The core CPI data (excluding food and energy) rose +.09% versus expectations of 0.3%. At 3% YoY, core CPI is now running at the highest annual rate since the mid-1990s. A big portion of the increase came from used cars. Per Zerohedge- “the index for used cars and trucks rose 10% in April. This was the largest 1-month increase since the series began in 1953. It accounted for a third of the seasonally adjusted all items increase.” The gain in used car prices is temporary as its a function of the low supply of new and used cars at the same time fiscal stimulus is flowing through the economy. Supply line problems and chip shortages will abate and stimulus will run its course, leading to a normalization of supply/demand. The Fed will find some comfort in this and likely discount today’s data.
Stocks initially fell on CPI but have been climbing back to near where they were before the release. Interestingly, bond yields are only slightly higher on the news. Bonds appear priced for the expected surge in inflation and maybe looking ahead to the Fed more actively discussing tapering QE. The dollar initially surged but has given back a big chunk of those gains.
In yesterday’s commentary, we provided a link to CNBC’s interview with Stanley Druckenmiller. As we shared, he commented- “I can’t find any period in history where monetary and fiscal policy were this out of step with the economic circumstances, not one.” To stress his point he presented a graph of retail sales. To his point and shown below, retail sales are now 15% above the pre-pandemic trend or about 5 years’ worth of growth. If retail sales were simply to revert to trend, it would have to decline more than in the 2008/09 recession. This is but one example of economic activity propped up by massive fiscal stimulus. As the benefits of stimulus fade, and with less new stimulus on the horizon, economic activity will suffer. That is the fiscal cliff we will be dealing with in late summer and fall.
Yesterday’s BLS JOLTs report showed that the number of job openings in March surged to 8.12mm from 7.53mm in February. The graph below is the Beveridge Curve, which compares the number of job openings as a percent of the labor force to the unemployment rate. As shown, historically we would expect a job opening rate in the 2-4% range, not at nearly 5.5%. Further, the rate of job openings is the highest on record since the BLS started tracking it in 2000. Extended and enhanced unemployment benefits are partially responsible for the gap between what we are seeing and what we should expect. The full JOLTs report can be read HERE.
May 11, 2021
On CNBC, famed investor Stanley Druckenmiller warned about the current pace of fiscal and monetary policy. Given his stature and extremely successful career, we think it’s worth your time to listen to today’s CNBC Interview.
“I can’t find any period in history where monetary and fiscal policy were this out of step with the economic circumstances, not one.”
In today’s 3 Minutes on Markets & Money (linked below) Lance Roberts mentions that the NASDAQ is relatively oversold versus the S&P and DJIA. The graph below helps provide some risk levels on the NASDAQ (QQQ). Since the market rout last March, QQQ has fallen below its 50 day moving average three times as labeled in the top graph below. Currently, the NASDAQ is down about 2% this morning. It would not be surprising to see it decline to the range of the prior episodes (another 2-4%). The second graph shows its deviation from the 200 day ma. It is still about 10% above the average. Falling to the 200-day moving average might be strong support, but a significant break of the moving average would be concerning. As Lance mentioned, the NASDAQ is over-sold on a short-term basis but not a long-term basis. There is a potential opportunity here but it entails a good eye on risk management.
The NFIB Small Business Optimism Index rose in April to 99.8. The Index has recovered about 2/3rds of its losses from pre-pandemic levels. The survey was quick to point out “42% of owners reported job openings that could not be filled, a record high reading. Owners continue to have difficulty finding qualified workers to fill jobs as they compete with increased unemployment benefits and the pandemic keeping some workers out of the labor force.” The three graphs below highlight the disconnect between hiring workers and being able to find workers to hire.
The survey respondents also appear to be sounding inflation warnings. Per the report: “The net percent of owners raising average selling prices increased 10 points to a net 36% (seasonally adjusted), the highest reading since April 1981 when it was 43%. The highest was 67% in October 1974 when inflation reached double digit rates.” The graph below highlights the sharp increase in prices.
The recent uptick in inflation expectations is resulting in the outperformance of inflationary sectors like materials, financials, and energy. At the same time technology, communications, and cyclical stocks are underperforming. Yesterday for instance the Dow Jones Industrial Average was down by only 0.09% while the NASDAQ fell 2.63%. The tables below courtesy of Finviz show the significant divergence over the last week and month Last week’s Technical Value Scorecard highlighted these divergences in more detail as well.
The graph below, courtesy of CoStar, shows a large majority of workers are still working from home. Longer-term estimates forecast that the work from home trend is viable. Per forecasts, the numbers below are likely to only get back to about 80%. If that forecast holds true, there will be a sizable surplus of office space in big city markets.
May 10, 2021
The dollar, shown below, was showing signs of a bottoming process but it has recently turned more bearish. Recent weakness has taken it below the rising support line which started at the beginning of this year. A break below the early March and January lows would confirm more dollar weakness ahead. The MACD is currently oversold, but not at levels that might indicate a bottom is in place. The only bullish factor in the graph is the 50-day ma is about to rise above the 200-day ma.
The second graph compares the dollar to inflation expectations. As shown, they tend to have an inverse relationship. The current bout of dollar weakness is likely associated with the recent pick-up in inflation expectations.
CPI, PPI, and Retail Sales data will be released this week. CPI, due out Wednesday, is forecast to increase 0.4% monthly, and 3.8% year over year. The year-over-year data is skewed because of last year’s low inflation. As such most economists will focus on trends in the monthly data.
There will be a slew of Fed speakers this week. We are on the lookout for Fed members that are more inclined to see the Fed taper sooner rather than later. Given last week’s poor employment report, those in favor of tapering may not be as vocal about it in the coming weeks as they might have been if it were a stronger report.
Rumors have been circulating this past week about a potential merger between Chevron (CVX) and Exxon (XOM). While they may be serious, it is worth noting the two companies have been in discussions for the better part of the last five years. Interestingly, both companies were spun off of Standard Oil when it was broken up 110 years ago due to antitrust concerns.
Gary Gensler, the new SEC Chairman, sent a few warning shots toward the crypto markets last week. Some headlines as follows:
GENSLER SAYS WE NEED GREATER INVESTOR PROTECTIONS REGARDING CRYPTO TOKENS -CNBC
*GENSLER SEES GAPS IN OVERSIGHT FOR BITCOIN TRADING ON EXCHANGES
*GENSLER: BITCOIN TRADING ON LARGE EXCHANGES NOT PROTECTED
SEC CHAIR GENSLER: IF CONGRESS DECIDES TO ACT ON CRYPTO TOKENS, WE WILL COLLABORATE WITH THEM.
The graph below, courtesy of the WSJ, provides good context for the pace of the labor market recovery and how many jobs are needed before a full recovery.
The BLS jobs report fell far short of expectations at +266k versus a consensus estimate of nearly +1 million. The unemployment rate rose to 6.1%, which was +.3% above expectations. The average workweek rose to 35 hours from 34.9 and average hourly earnings rose .7% versus last month. On the wage front, hourly earnings are only up 0.3% versus a year ago. This is concerning given the denominator in the year-over-year math is April of 2020, the trough of the employment crisis. CPI is running at +2.6% YoY, meaning workers, on average, have lost 2.3% in purchasing power over the last year. Government stimulus has thus far eased the situation.
Leisure and Hospitality jobs added 331k, which accounts for more than the total number of jobs added. Temporary help lost 111k jobs which is surprising given how often we hear companies can’t find employees.
The initial market reaction was friendly for the deflationary sectors like technology. Bonds and gold are also off to a strong start. The market will likely perceive today’s report as evidence the Fed is far away from tapering.
The graph below, courtesy of Brett Freeze, shows the strong correlation between temporary help and GDP.
Goldman Sachs shines a light on its poor expectations for wage growth today and for the remainder of this year- “We expect that base effects will pull the year-on-year rate negative in this Friday’s employment report, and that the composition unwind will drag the average monthly growth well below +0.2% for the remainder of 2021”
Wage growth is important because inflation, without a boost in wages, will be crippling especially for the lower-income classes.
Expectations for the BLS Employment report due at 8:30 ET are as follows:
Last night Fed President Lael Brainard stated: “Vulnerabilities associated with elevated risk appetite are rising.” The combination of stretched valuations with very high levels of corporate indebtedness bear watching because of the potential to amplify the effects of a repricing event.”
And therein lies the Fed trap they set for themselves. QE and low-interest rates elevate risk appetites which drive stretched valuations and high levels of indebtedness. Tapering QE and/or raising rates might very well “amplify the effects of a repricing event.” More simply: Fed stimulus is blowing bubbles that will pop if they stop blowing.
A day after the last Fed meeting, Fed President Kaplan said: “The Fed should start talking about tapering bond-buying soon.” This was due to his concerns about rising inflation. Brainard’s comments yesterday concern rising financial instability. We think her comments might represent a more cloaked effort to push the Fed closer to tapering and raising rates.
May 6, 2021
Jobless Claims continue to improve, crossing below 500k, to 498k, for the first time since the COVID lockdowns began. There are still over 16 million people receiving state or federal claims, a number the Fed would like to see drop meaningfully before they talk about removing stimulus.
Yesterday afternoon, Boston Fed President Rosengren said “the mortgage market probably doesn’t need as much support now.” Similar to hawkish comments from Dallas Fed President Kaplan, it seems Rosengren is indirectly pushing for a tapering of MBS-QE. Currently, the Fed is buying $40 billion mortgages a month.
Real (after inflation expectations) 10-year UST yields peaked at -.58 on March 21, since then they have fallen to -.91%. Treasury yields fell nearly 10bps over the period while inflation expectations have been on the rise as of late as shown below. As we have noted on numerous occasions, the price of gold is highly negatively correlated to real yields. Since mid-March, its price has gone from 1675 to near 1800. The question for gold investors is can Treasury yields remain rangebound while inflation expectations rise? That is a tall order.
We are not sure of the reliability of the graph below from the Daily Shot, but if somewhat accurate, it shows that farm values are expected to rise sharply. We think some of the credit for the increase is due to speculation and the recent popularity of owing hard assets, including land to protect from inflation. The recent surge in agricultural prices certainly helps as well.
Last Sunday, 60 Minutes aired a segment on the shortage of semiconductor chips in the United States. The shortage is part of the reason supply lines for so many products reliant on chips are troubled. Ford, for example, recently cut their production in half for the second quarter as it can’t source enough chips. Based on the segment, it is likely these shortages are likely to continue, to some degree, for two more years. Also of note, only 12% of chips are made in the United States leaving the U.S. vulnerable to Asian suppliers who manufacture about 75% of them. LINK to the video clip.
May 5, 2021
Earlier today we wrote: “Based on recent Fed comments, employment seems to be the key factor stopping the Fed from tapering QE.” Fed Vice Chair Clarida just said the economy needs to add 8 million jobs to get back pre-COVID levels. From the trough of the last recession to 2020 the economy formed 182k jobs a month. At double that rate it will still take two years to get back to pre-COVID levels.
The ADP Labor report was weaker than expected, showing the economy gained 742k jobs versus expectations for 850k. We suspect the report will be perceived by investors as equity market-friendly. Based on recent Fed comments, employment seems to be the key factor stopping the Fed from tapering QE.
Yesterday we reported that Yellen sparked a little fear by mentioning interest rates might “somewhat” if the economy overheats. Apparently, she got a tap on the shoulder as those remarks were rescinded in a speech later that afternoon. In those later comments she said “I do not see the rescue package as overheating the economy” and “I am not predicting anything.”
The ISM Manufacturing survey is an important gauge used by economists to assess the manufacturing sector. While most investors and economists focus on the quantitative results of the surveys, ISM also shares some commentary from respondents that can be illuminating. We share a few of the more interesting comments below. The rest can be found on the ISM website.
“Steel prices are crazy high. The normal checks on the domestic steel mills are not functioning — imported steel is distorted by the Section 232 tariffs.” (Fabricated Metal Products)
“It’s getting much more difficult to supply production with materials that are made with copper or steel. Lots of work on the floor, but I am worried about getting the materials to support.” (Electrical Equipment, Appliances & Components)
“In 35 years of purchasing, I’ve never seen everything like these extended lead times and rising prices — from colors, film, corrugate to resins, they’re all up. The only thing plentiful at present, according to my spam filter, is personal protective equipment [PPE].” (Plastics & Rubber Products)
“Demand continues to be very strong. Supply chain delays hamper our availability and ability to sell more.” (Machinery)
Over the past few months, we have noted the amount of margin debt, or leverage being employed in the equity market, is approaching, or in some measures greater than we have ever seen in the past. The graph below, courtesy of Topdown Charts, shows another form of leverage that is not captured in the margin data. The green line shows that assets under management (AUM) of leveraged long ETFs have risen by about 150% in the last year and sits well above pre-COVID levels as well as anytime in the 15 years prior. Signs of euphoria are everywhere but that doesn’t mean a top is imminent. However, it does mean, we should exercise caution, understand the potential downside, and manage our risk carefully.
May 4, 2021
“It may be that interest rates will have to rise somewhat to make sure our economy doesn’t overheat,” Yellen said in an interview with the Atlantic recorded Monday that was broadcast on the web on Tuesday. “It could cause some very modest increases in interest rates.” – Per Bloomberg
Take notice of this important comment from Treasury Secretary Janet Yellen. After largely agreeing with Jerome Powell that inflation will be transitory and there is no rush to raise interest rates/taper, she seems to be changing her tone. Given her current role and former role as Fed Chair, she might be tipping us off to coming changes in Fed policy.
Equities fell this morning, supposedly on the rumor of a Chinese aircraft entering Taiwan’s Air Defense Identification Zone (ADIZ). The ADIZ is not the same as Taiwan’s territorial airspace. This event is likely not the cause for the decline because similar incursions have been occurring and have been widely publicized. Further, as shown below in the map, China’s and Taiwan’s ADIZs overlap, making it a possible “legal incursion.” That said, the area is becoming more of a geopolitical hot spot and worth paying attention to.
Most recessions are cyclical events that occur when inventories are bloated and, as a result, manufacturers cut production, resulting in layoffs. As shown below, in the ISM report courtesy of Bloomberg, during the 2008/09 recession, inventories rose which resulted in order reductions, ergo fewer backlogs, for new goods. Today is quite different. Inventories are at the lowest levels in at least 14 years as customers are waiting on new orders to replenish their inventories and meet pent-up demand for many products. This graph argues supply line-related product shortages will continue to be problematic and result in reduced supply and upward price pressures. Over time we expect the situation to normalize but given the historic divergence, it may take longer than expected, and the resulting price pressures may last longer than expected. At some point, the markets may begin to question the Fed on the “transitory” nature of recent price increases.
One of the more notable aspects of this earnings season is that companies reporting good earnings and sales have not been rewarded as they have been in the past. Per BofA, “Companies beating on sales/EPS in 1Q have led by just 16bps the next day, vs. average +1%.” Their graph below provides historical context.
May 3, 2021
Similar to a graph we shared last week, this graph by Standard and Poors shows the percentage of firms in each industry feeling profit margin pressure.
The ISM Manufacturing Index was weaker than expected at 60.7 versus 64.7 last month. Noteworthy, employment fell 4.5 points to 55.1, and inventories fell below 50 and into economic contraction territory at 46.5. Prices paid were the only notable subcomponent rising on the month. It was 89.6 versus 85.6 last month. As shown below, it has only been above 90 twice, the 1970s and 2008. The combination of higher prices and slowing economic activity is not a good sign for corporate profits. That said, one month certainly does not make a trend.
The economic calendar will be busy this week. ISM releases its manufacturing survey this morning followed by its service sector survey on Wednesday. The most important data points of the week will be Wednesday’s ADP labor report and Friday’s BLS employment report. With inflation and inflation expectations near the Fed’s 2% target, employment appears to be the only factor keeping the Fed from discussing tapering QE and raising rates. The market is expecting the BLS to report that nearly 1 million new jobs were created in April, which should bring the unemployment rate from 6% to 5.8%. While great news, it is still well above pre-COVID levels.
We expect an active Fed speaking calendar this week. Again, we will be on the lookout for any dissension in the ranks in regards to the timing of removing monetary stimulus.
The earnings calendar will be busy this week as follows:
As shown in the graph below, the sharp increase in the amount of margin debt outstanding is only rivaled by similar increases before the meltdowns of 2000 and 2008. The red dots show periods when the annual change in margin debt exceeded two standard deviations. While an ominous graph, we caution that the amount of margin debt a year ago was falling rapidly with the market. As such, a year over year comparison may not portray similar circumstances as those leading to 2000 and 2008.
And just one day after the FOMC meeting, Fed President Kaplan is the first dissenter. This morning he said, “The Fed should start talking about tapering bond-buying soon.” He also said rate hikes should start in 2022.
The Chicago PMI Survey rose to its highest level since 1983. The index was 72.1 versus 66.3 last month. The broader ISM Survey, due out on Monday, is expected to be 65. Like Chicago PMI, that would be the highest level in nearly 40 years.
Earlier this year we discussed how the Treasury would draw down its $1.6 trln cash balance at the Fed which would result in less short-term debt issuance and lower rates. Yesterday the Fed auctioned $40 bn 1-month Treasury Bills at 0.00%. As a result of the Treasury’s actions, investors are clamoring for short-term paper with any positive yield. In the same vein, the Fed has recently been conducting its reverse repo program due to strong demand. In reverse repo (RRP), the Fed borrows money from participants in exchange for Treasury securities as collateral. The Fed only allows repo at 0% or positive rates. It sounds crazy but 0% is better than secondary market repo rates, so money market funds have interest in lending/investing at 0%. Unfortunately, like M2 money supply, the Fed discontinued providing Treasury balances held at the Fed. As such, we do not know how much longer the situation may last.
Late yesterday afternoon Department of Labor Secretary Marty Walsh said “a lot of gig workers in the United States should be classified as employees.” If his wishes are granted, companies like Uber (UBER), LYFT (LYFT), and Door Dash (DASH), will be on the hook to provide benefits to their employees that they are currently not supplying. All three companies were down nearly 10% on the news.
The first graph below shows that the U.S. savings rate increased markedly during the COVID crisis. This was due in to a combination of stimulus benefits received by many people that remained employed as well as limited opportunities to spend money due to economic shut-downs. Interestingly, as shown in the second chart, courtesy of the Financial Times, savings rates around the world increased sharply over the last year. The big economic question going forward is whether or not a global consumer mindset favoring savings versus consumption is emerging. As shown, in the U.S., the savings rate has been relatively stable. Given this long track record, we assume until proven otherwise, the recent spike in savings is an anomaly and will revert to historical norms once economic activity normalizes.
April 28, 2021
Comments from Jerome Powell:
“The unemployment rate of 6% understates the shortfall in inflation”
Prices will continue to rise due to economic reopening, pent-up demand, and supply chain bottlenecks, but price increases are temporary. He stressed this numerous times
The Fed will aim to anchor inflation at 2%, but will temporarily tolerate inflation above the target to offset prior periods of lower inflation
He made it very clear that a significant reduction of the unemployment rate and 2% inflation is needed before tapering QE or raising rates. Until those goals are met there will be no reduction in QE ($80bn UST and $40bn MBS)
Per Powell, it’s not time to even begin “thinking about thinking about” tapering
We are unlikely to see persistent inflation with slack in the labor markets- (ergo they think wages are the primary driver of inflation and do not see them rising up yet)
He does not see long-time “scarring” of workers, meaning he believes the job losses are not permanent as we saw after the financial crisis.
They are watching housing prices rise but do not characterize the situation as a bubble because they do not see financial stability problems like in 2005-2008. He thinks the primary driver of higher prices is the lack of supply.
“Some asset prices are high.” Powell also alluded that parts of the equity markets are “frothy”
As we expected, the Fed’s FOMC statement was little changed from the last one from March 17th. The red-lined version below, courtesy of Zero Hedge, compares the two statements. As shown, the only changes are a slight upgrade in their description of economic activity with credit given to policy support and vaccinations.
The graph below, courtesy of Optuma, shows the strong correlation between the ratio of Copper to Gold and 10-year U.S. Treasury yields. Historically, the Copper/Gold ratio has proven a durable measure of inflation. As shown, on a technical basis, the ratio is breaking out of a brief period of consolidation, portending yields will potentially move up in lockstep.
Prices for many agricultural products on the futures exchanges have been on a tear over the last month as shown below. The price increases of these goods will have a larger effect on the poor and middle class than the wealthy. Given the Fed has been outspoken about the divergence of wealth, and the poor being left behind, it will be interesting to hear their comments today on rising prices. We must also keep a close eye on staples stocks and assess if they can fully pass on the price increases to consumers. If not, they will take other measures to cut costs to try to keep profit margins stable.
1 Month Performance:
Wheat +24%
Corn +23%
Soybean Oil +20%
Canola +20%
Sugar +13%
Coffee +12%
Soybeans +12%
Oats +11%
The graph below, courtesy of All Start Charts, shows the economic surprise index has been greater than zero for 225 days, the longest such streak since at least 2003. The index measures economists’ economic forecasts versus actual economic data. The gist is economists have been consistently underestimating the pace of the economic recovery.
April 27, 2021
The graph below and commentary are courtesy of Danielle DiMartino Booth:
“Risk premiums on CCC bonds dropped below 500bps late Monday, a level only seen twice in the last two decades — the years leading up to 2008 financial crisis & right before the dotcom bubble burst.”
–By “risk premium” she is referring to the spread or differential between the yields on CCC-rated bonds and like maturity Treasury bonds.
The Fed’s two-day FOMC meeting concludes tomorrow at 2 pm with the FOMC monetary statement and the Powell press conference at 2:30. While we expect little to no change in the statement and no change to ongoing monetary operations, we do think they will pay more lip service to inflation than they have been. They are likely to acknowledge the recent uptick in prices, especially of food and energy, but we expect them to stick to their belief that the increases are transitory. The Fed conversation may become more interesting over the next week or two as Fed members will be back out on the speaking circuit.
Over the last year, Fed members have been in unison in regards to comments on monetary policy and their policy of allowing inflation to “run hot.” With the inevitable taper on the horizon and a recent uptick of inflation in consumer staples, which hurt the poor, it will be harder for Powell to keep the group in line. This may prove troubling for the markets in the coming months.
The graph below on the left, courtesy of Stifel, shows that almost all of the gains in the S&P 500 over the last decade occurred during periods when the year over year growth of the global money supply was increasing. The graph argues the rally may hit some headwinds in the coming months as the annual growth of the money supply will inevitably see a sharp decline. We are now a full year past the initial liquidity injections of 2020. As this occurs the denominator in the annual growth calculation will increase rapidly. The second graph quantifies this effect by showing how year over year U.S. M2 money supply growth will shrink despite the assumption that the Fed continues to add $120bn a month of QE.
The Fed likes to use trial balloons to assess how potential changes to their operations might affect investor behaviors. Given that the economy is recovering nicely, vaccinations are giving a further boost to economic activity, and inflationary pressures are on the rise, we suspect the Fed may be closer than they allude, to begin “thinking about thinking about tapering.” To wit, this morning comes a potential trial balloon by the WSJ article entitled The Fed’s Next Test Is Breaking The Ice Over Policy Shift. There is nothing in the article that leads us to believe change is coming at this week’s FOMC meeting, but it does state the Fed is closing in on the time when they must start to reverse emergency stimulus measures. It wouldn’t surprise us if Chairman Powell makes a short statement this Wednesday saying as much. The question is, how will the markets react.
The economic calendar is relatively light for a second week running. Of note this week will be personal income and spending and the PCE price index on Friday. The PCE index is the Fed’s preferred inflation gauge. Also on Friday will be the University of Michigan Consumer Survey and importantly their survey on inflation expectations, as well as the Chicago PMI report and their inflation sub-survey. After a weak durable goods report last month, economists are expecting a strong rebound to 2% when released at 8 am today.
The highlight of the week is likely to be the Fed’s FOMC meeting and Powell’s press conference on Wednesday. Similar to the last couple of meetings we suspect little will change in their statement that would lead us to believe they will be more or less aggressive with monetary policy. As such, any meaningful changes in QE or just in their tone or descriptions of economic/market activity may have an outsized effect on markets.
This will be a big week for Q1 earnings releases. The table below shows the more widely followed earnings release dates.
The graph below, courtesy of Goldman Sachs, shows that SPAC issuance has significantly slowed. Thus far in the second quarter, 6 SPACs have come to market. That compares to over 50 at the same point in the first quarter. Poor recent returns and heightened regulatory risks are largely to blame for the decreased issuance.
As shown below, the Baker Hughes Rig Count is still below pre-COVID levels despite the price of oil having fully recovered. Assuming the rig count does not spike higher as the economy continues to recover, this should limit supply and keep a bid under the price of oil. The wild card is OPEC, which has begun slowly increasing production levels.
The graph below, courtesy of the Daily Shot, shows that people are using mortgage refinancings and home equity lines to draw on their house’s equity. The extra money is providing homeowners additional funds to pay down other debts and spend. Recent trends in credit card debt lead us to believe that some people are using their home’s equity to pay down costly credit cards.
On Tuesday Fortune published an interesting article on some of the risks with Bitcoin mining. The key takeaways included pollution and national security. On the pollution front the article stated:
“Overall, de Vries reckons that fossil fuels power around 70% of all Bitcoin mines worldwide, and that coal provides the vast majority of that share. “We now know for sure that one-third of all production runs on pure coal from a tiny place in China,”
“Miners are going to unusual places in search of the cheapest power that’s also reliable—and that’s almost always fossil fuels.
In regards to national security:
Finally, “It’s now clear that one-third of all the world’s Bitcoin-mining power masses in a single hotbed of our archrival, China. He fears that if tensions between the U.S. and China escalate, Beijing could use the equipment in Hutubi and the rest of China to paralyze the network, halting all transactions. That shutdown would wreak havoc with the hedge funds that hold Bitcoin and the corporations piling the coins into their treasuries.”
Since sanctions constrain Iran from exporting oil, Tehran is developing a new market inside the nation’s borders by luring Bitcoin miners with super-low energy costs. By some reports, Iran now accounts for 8% of the world’s Bitcoin production.
April 22, 2021
President Biden will propose boosting the long-term capital gains rate to as high as 43.4% for those with earnings of greater than $1 million. It is rumored the tax will be retroactive to include 2021 gains. Stocks are trading lower on the news.
To show how deep our fiscal deficit issues are we share a paragraph from Bloomberg on the tax increase: “The Tax Foundation estimates that increasing capital gains taxes in the fashion suggested by Biden would result in just $469.4 billion in revenue over 10 years. That may seem like a lot, but most of the forecasted tax revenue will be back-end loaded and is actually paltry when compared with projected total government outlays of $6.6 trillion in fiscal 2020 alone. Capital gains taxes account for about 5.2% of tax revenue on average.”
Initial Jobless Claims fell again to a one-year low of 547k. Despite the recent decline in state unemployment claims, the total number of unemployment benefits, including Federal programs, rose by 500k to 17.4 million. It has been hovering around this level for all of 2021.
Existing Home Sales were weaker than expected at 6.01mm annualized sales, down from 6.22mm last month. The monthly decline of 6.6% is due to higher mortgage rates, higher prices, and a limited supply of homes on the market. The report stated there were slightly over 1 million homes for sale in March. To stress how little supply is available on the market, that number is 28% less than last March, when the economy was reeling from COVID lockdowns. Even with the declines over the last two months, Existing Home Sales remain well above the rates of the prior ten years.
Yesterday we discussed how SPACs and Bitcoin can help us gauge the market’s desire to take on risk. We would be remiss if we did not mention Lumber. The price of Lumber futures is up nearly 300% from pre-COVID levels. While supply line shortages and heavy construction demand for lumber are driving its price higher, speculation is also playing a role. Add lumber to the list of “risk-on” assets to keep an eye on.
Per Bloomberg, Dogecoin (cryptocurrency) is now worth more than Ford and Kraft Heinz. Per Yakob Peterseil at Bloomberg:
“No one thinks these blue-chip stocks are all that comparable to Dogecoin, a fringe asset with no real purpose beyond being a joke on social media. But the similarity of their market values underscores the boom in cryptocurrencies that’s taken Wall Street by storm.”
April 21, 2021
Over the first two months of 2021, SPACs were all the rage. From January through February 17th, the IPOX SPAC Index rose 27%. Since then it gave up all of the gains and is down over 3% year to date. The quick rotations into and out of risky products have been a hallmark of the last year. As we noted with BTC below, following these trends can yield important clues about market sentiment.
The Bank of Canada (BOC) appears to be the first central bank to reduce COVID-related QE bond purchases. Partially driving the decision is a sharp rise in home prices. To wit: “We will continue to have an eye on the threats posed by the dramatic increase in home prices.” One has to wonder if the Fed is harboring similar thoughts.
The graph below is of Bitcoin’s (BTC) price for the last year. We follow it, in part, because the “risk-on” trade in some equity sectors has been well correlated with BTC. As shown the recent 5-6x increase in price from last fall had good support in its 50-day ma as well as the white support line. Over the last few days, it has broken below both. BTC is certainly extended and due for a pull-back. Given how much its risen in just months, a decline to the 200-day ma (34,123) should not be shocking. Equity investors in some of the high-flying stocks linked to BTC, like Tesla, Coinbase, Overstock, and Microstrategy, should pay close attention.
The following series of graphs, courtesy of Brett Freeze, shows bank lending growth contracted for the first time since 2010. At the same time, securities and cash held by the banks are rising rapidly. QE is designed to spur loan growth but, as shown, banks are using the Fed reserves to buy investment assets, not make loans. This is one reason QE has been a strong tailwind for asset prices but unable to help sustain economic growth.
The graph below, courtesy of Zero Hedge, further confirms Brett’s analysis. As shown, loan growth from the four largest banks has been flat since the 2008 financial crisis despite a doubling of bank deposits. Prior to 2008, banks used deposits to make loans, and accordingly, they tended to grow at very similar rates.
April 20, 2021
Coca-Cola is raising prices to help offset higher input costs. Per CNBC they “join a number of other consumer giants, such as Kimberly-Clark and J.M. Smucker, in hiking prices.” With the price of many commodities up significantly over the past few months, investors will be looking to see if they can raise prices to help stop profit margins from shrinking, yet, at the same time, not hurt demand for their respective products.
Last week we shared data from the BLS JOLTs report showing that despite a large number of unemployed people, employers are having a hard time hiring. To that end, we ran across a report from Business Insider which claims McDonald’s is paying people $50 just to interview for a job and “it’s still struggling to find applicants.” The graph below tells a similar story for companies in search of truck drivers.
Julian Bittel, in his graph below, argues that the recent surge in equity valuations implies poor future 1-year returns. As such, the gray line, the equity to bond ratio, should fall sharply, meaning bonds will outperform stocks. If true this would represent a reversal of the last six months in which bond prices fell while stock prices rose.
The graph below, which was accompanied by a few tweets from Jim Bianco, shows the rolling annual Federal deficit in dollar terms at the top left, and as a percentage of GDP at the bottom left. Per Jim Bianco “As this chart shows, the last 12-months the deficit was hard to understand $4+ trillion. As a % of GDP it was equally hard to understand 19%.” The second chart shows that the only time the government went into as large a deficit, as a percentage of GDP, was during WWII. The financial crisis of 2008 and the Great Depression, pale in comparison to the current deficit.
Federal stimulus is not likely to spark long-term inflation, says Lisa Abramowicz in an opinion piece recently published to Bloomberg.
“The headline numbers seem huge: Americans have $1.8 trillion in extra savings over the pre-pandemic total, according to the latest estimates by Bloomberg Economics based on data through February. A lot of this stems from about $877 billion of checks sent to U.S. households in three rounds of stimulus payments during the pandemic, which has helped consumers pay down debt and save.
The question, though, is how much of that they can truly deploy in the coming months. While March retail sales surged 9.8%, the most in 10 months, according to data released on Thursday, the jump comes on the heels of stimulus checks that spurred shopping sprees.”
Abramowicz goes on to explain,
“On average, American households set aside about 26% of their stimulus checks to buy things in the relatively near future, with most of the funds going toward savings and debt payments, according to an April 7 New York Fed research report.”
She concludes by stating that it’s tough to see how “helicopter money” alone could lead to sustained inflationary pressures in the US.
The economic calendar will be quiet this week. Of note will be existing home sales on Thursday and new home sales on Friday. The next Fed FOMC meeting is scheduled for next Tuesday and Wednesday. As such, speeches or comments from voting fed members will be sparse as they enter a self-imposed media blackout this week.
As shown below, the corporate earnings schedule will be much busier this week as we progress further into earnings season.
The graph below is a good tool to help define sectors according to Growth/Value and Defensive/Cyclical traits. As we have discussed sectors falling into the Cyclical/Value description were the best performing sectors when implied inflation was running higher in late 2020 and early 2021. Over the last month, with implied inflation values stalling out around 2.5%, Cyclical/Quality is taking back leadership. Generally speaking, the market has been keyed on value vs growth and seems to prefer cyclical over defensive sectors. You can map this to our weekly Technical Scorecard report to better evaluate sector rotations on a weekly basis. We are doing more work with this type of analysis that we hope to share soon.
Housing Starts for March came in above expectations at 1.739M units annualized versus the consensus estimate of 1.620M and a prior month reading of 1.421M. Housing Permits were 1.766M— slightly above expectations of 1.750M and a prior month reading of 1.682M. This is somewhat surprising given higher mortgage rates and record lumber prices are starting to weigh on homebuilders. Six to nine months from now, these positive readings could help alleviate the supply shortage currently facing the housing market.
Earlier in the week, we discussed the role higher energy prices are playing in boosting CPI. The graph below, courtesy of Jim Bianco, shows how Used Car prices are rising at their fastest annual pace in at least 20 years.
“How come? It’s a classic case of low supply and high demand.
There’s just not as many used vehicles for sale, for one thing. The pandemic forced rental agencies to slash purchases of new cars after a steep decline in individuals leasing cars at airport and other locations. Those vehicles typically are sold to used-car lots after a year or less.
At the same time, demand rose for used vehicles as more people avoided public transportation or moved from the cities to the suburbs to escape the coronavirus. Cox Automotive estimated that demand for used vehicles has doubled since last March.
Many Americans preferred used vehicles to save money in a time of great economic uncertainty, especially with the cost of new cars and trucks at an all-time. Earlier this year the average cost of a new vehicle surpassed $40,000 for the first time, the auto-research firm Edmunds found.
The imbalance is unlikely to end anytime soon.”
The chart below, courtesy of Ned Davis Research, shows retail investors are “all-in” so to speak. Rising stock prices and pitiful bond yields are pushing investors to take their highest allocation to equities since the days preceding the dot com bubble crash. It is worth reminding you of Bob Farrell’s investment rule #5: the public buys the most at the top and the least at the bottom.
April 15, 2021
**We apologize, there will be no 3 Minutes on Markets & Money this morning due to technical difficulties.
This morning CitiBank warned that peak credit losses may not occur until 2022. While the market is bulled up on the banks and their prospects, some seem to be losing sight that many loans and mortgages are in forbearance. As the borrowers are forced to make regular payments plus make up for missed payments, we are likely to see a decent number of defaults. The question facing banks is how much of their loan loss reserves do they need to hold in anticipation of coming defaults. Yesterday JPM said it released $5.2 billion in loss reserves, leaving it with $25.4 billion. As a comparison, they had $18.6 billion prior to COVID.
We start the day with much better-than-expected economic data. Initial Jobless Claims fell sharply to 576k versus expectations for a 700k increase. Retail Sales, with the help of newly minted stimulus checks, rose 9.8% on a monthly basis. Interestingly, despite the strong economic numbers, bond yields are falling this morning. The ten-year UST yield is currently down 4 basis points to 1.60%, about .15% below the highs from two weeks ago.
China has been a leading driver of global economic growth for the last decade-plus. Fueling the growth are exports, massive infrastructure projects, urbanization, and importantly, extreme leverage. U.S. economists pay close attention to their money supply or so-called “credit impulse” to gauge how much financial and economic leverage is being generated. As shown below, M1 has been growing at a relatively tepid rate despite the Pandemic. The PBOC (central bank) is making a concerted effort to limit further expansion of leverage in hopes of making economic growth more sustainable over the longer term. While prudent, it will weigh on short-term economic growth for not just China, but the U.S. and the rest of the world. The graph to the right shows Morgan Stanley’s expectation for reduced credit growth resulting from the PBOC’s actions to reduce leverage. As they note, commodity prices are likely to feel the sting as China is the world’s largest consumer of many commodities.
We have struggled over the last few months to reconcile the high and sustained rate of weekly jobless claims with the quickly recovering labor market. Zero Hedge recently published an article that seems to explain some of the divergences. Jobless Claims, as the title says, are claims for money, not actual payments. Just because one makes a claim for jobless benefits doesn’t mean they are given money. The graph below shows about 50% of claims, prior to COVID, resulted in payments. Currently, about 20-25% of jobless claims receive benefits. Assuming a quarter of claimants (versus historically half) actually receive benefits, the number of weekly claims is more in line with the unemployment rate.
April 14, 2021
The Coinbase (COIN – Crypto Exchange) IPO initially traded at $391, which is a market cap of just under $100 billion. For context consider Goldman Sachs has a market cap of $115 billion and Charles Schwab is $127 billion. Also, consider the largest stock exchange, prior to today’s offering, was the Hong Kong Exchange at $74 billion.
Following on the heels of CPI yesterday, we got more inflation data today. Import prices rose 1.2%, above the estimate of 0.9%, but 0.1% weaker than last month. Export prices rose 2.1% versus 1.6% last month and well above estimates of 0.9%. The Atlanta Fed released their Business Inflation Expectations at +2.5% annually versus +2.4% last month. Their reading is in line with CPI at +2.6% annually.
Per the latest NFIB survey, the number of small companies having trouble filling jobs is the highest since at least the early 1980s, as shown below to the left. Last week JOLT’s report also reported a high number of job openings. The graph to the right is the Beveridge Curve. It compares the number of job openings as a percentage of the working population (y-axis) to the unemployment rate (x-axis). The orange dots and the line show the path of this data over the last 13 months. While the labor situation has improved markedly, it is confounding unemployment is over 2% higher than pre-COVID despite a record number of job openings. Also, worth noting, the curve shifted right (green to blue) after the last recession. In light of the massive amounts of stimulus, which will weigh on future economic growth, might current readings be an early warning of another shift to the right?
Along with record prices come record valuations. The graph below, courtesy Top Down Charts, shows that a composite valuation using CAPE10, P/E (TTM), and 1yr. forward P/E is nearing its peak of 1999. This indicator will decline in the coming weeks with improved Q1 earnings reports. If earnings were to stay constant, the S&P would need to rise about 5% to take out the 1999 highs. While valuations are concerning and should raise our risk radar, we also have to recognize stocks may have further to climb. As we wrote in Zen and the Art of Risk Management–
“The market is grossly expensive, but as we stated valuations have poor predictive ability to help gauge what will happen in the next few weeks or months. Despite extreme valuations, we can ride the market higher with other greedy investors. However, unlike most investors, we are aware that the risk of significant losses is not minimal.”
“Quantifying downside risk allows us to have a plan in place to reduce or hedge risk when technical indicators and other signals alert us to potential changes.”
CPI was .1% higher than expectations on a monthly and annual basis as shown below. While slightly warmer than expectations it was not as hot as the PPI print last Friday. This non-confirmation may prove to be a temporary relief for the bond markets.
The graph below shows the market’s breadth, as measured by the percentage of S&P 500 stocks above their respective 200-day ma, is at its highest level in over five years. With a reading over 95%, this gauge serves as a warning as markets fell sharply when it peaked at slightly lower levels in early 2018 and 2020. That said, prior peaks such as in the first quarter of 2017, saw breadth deteriorate without a sharp drop in the S&P 500.
The graph below, courtesy of Brett Freeze, shows consumer credit trends. Noteworthy, the year-over-year change in revolving credit (credit cards- non-seasonally adjusted) is falling at the sharpest rate since at least 1994. Despite the housing boom, non-revolving consumer credit is also trending lower, albeit still exhibiting positive growth. Personal consumption typically accounts for about two-thirds of GDP. As such, consumer borrowing is an important driver of personal spending.
Below is the corporate earnings schedule for the week:
April 12, 2021
St. Louis Fed President Bullard made an interesting comment today as follows: Fed’s Bullard Says 75% Vaccinations Would Allow for Taper Debate. For now, we will treat this as a one-off statement and not necessarily representative of other Fed members. However, If we hear similar rhetoric from other Fed members, the equity markets will pay closer attention to vaccination data and likely fret as they rise.
This will be an important week for economic data with CPI at 8:30 am ET tomorrow, Fed Chair Powell speaking on Wednesday, and Retail Sales due out on Thursday. Also on the radar will be the University of Michigan Consumer survey on Friday and, in particular, its inflation gauges. With PPI rising well above expectations last Friday, investors will be looking for confirmation in other inflation indicators. More important, will be any indications pointing to whether this bout of inflation is transitory or longer-lasting.
Q1 corporate earnings start this week in earnest. The banks will lead the way with JPM and GS releasing earnings on Wednesday, followed by many other big banks on Thursday. We are expecting strong reports from the large banks as they are likely to significantly reduce loan loss reserves. Further, the steeper yield curve should have increased margins, and the active trading environment bolstered trading revenue.
In the upcoming Q1 earnings reports, investors are likely to focus on rising input inflation costs and how companies will try to maintain or boost profit margins. Our friend Eric Cinnamond at Palm Valley Capital wrote an interesting article on the topic (LINK) that is worth reading. Here are few noteworthy passages:
Recent quarterly results and commentary of the businesses on our 300-name possible buy list support my anecdotal observations. With declining inventories and rising costs, companies have been reducing promotions to protect gross margins and receive full price on their limited supply.
Another business we follow, Big Lots (BIG), also reported fewer promotions, stating, “As our inventory levels were sold through, we were able to navigate through the holiday period with fewer promotions than last year. This reduction in markdowns significantly mitigated the pressure felt from increased spot freight rates and higher supply chain charges we incurred.”
Nike (NKE) discussed how supply chain shortages are negatively impacting sales, saying, “Starting in late December, container shortages and West Coast port congestion began to increase the transit times of inventory supply by more than three weeks. The result was a lack of available supply, delayed shipments to wholesale partners and lower-than-expected quarterly revenue growth.” Management also commented on its improved gross margins, partially contributing them to “higher full-price product margins.”
Chairman Powell will appear on 60 Minutes Sunday night. We presume he will talk up the economic recovery, pledge to keep the stimulus coming, and try to allay any fears of sustained inflation.
Producer Prices (PPI) surprised to the upside, rising 1% in March and 4.2% on a year over year basis. Expectations were for a gain of half a percent and +3.8% year over year. The 4.2% increase is the largest since 2011. We remind you, year over year analysis involves a comparison to March of 2020 when the economy wash shut down. Core PPI, excluding food and energy, rose .6% versus expectations of a .2% gain. CPI will be released next Tuesday. It will be interesting to see how much of the increase in input prices (PPI) corporations are able to pass on to consumers. The current estimate for CPI is +.5% and +2.5% on a monthly and annual basis respectively.
The graph below, courtesy of the Daily Shot, shows that 42% of stimulus checks are being saved and 34% are being used to pay down debt. While this bodes well for personal finances and helps explain the reduction in credit card balances, the stimulus is not stimulating the economy as much as politicians desired.
On April 29th the BEA will release the first-quarter GDP. The graph below shows the Atlanta Fed estimates growth will come in around 6%, while the consensus of economists is closer to 4%. The recent bump up in the Atlanta Fed forecast is primarily due to increased government spending forecasts and the robust housing market.
The chart below, courtesy of Macrocharts, shows that large gold outflows from the GLD ETF, as recently experienced, are typically followed by decent rallies. As shown 660k metric tons of gold were removed from the ETF in recent weeks, the second-largest withdrawal in the history of the ETF. We added a 2.5% position of gold via IAU three days ago in both the Equity and Sector models. Our internal money flow models are turning bullish, signaling the recent downtrend may be ending. The second graph shows that when RSI and MACD are extremely oversold (vertical gold lines), gold tends to rally. Further, gold bounced off its support trend line (ascending purple line) and formed a double bottom. The double bottom and trend support line provides us two relatively low-risk areas to establish stop-loss limits. If gold continues to show signs of a trend reversal we may add another 2.5% bringing the total to 5%.
April 8, 2021
“As of late February, investors had borrowed a record $814 billion against their portfolios… up 49% from one year earlier, the fastest annual increase since 2007… Before that, the last time investor borrowings had grown so rapidly was… in 1999.” – Investors Big and Small Are Driving Stock Gains With Borrowed Dollars. -WSJ
The economic recovery will face some challenges in the months ahead. One of them is that Federal/state actions allowing renters and mortgagees to skip payments and making evictions illegal will shortly end. As this occurs, those the did not make payments will have less money to spend for general consumption as they will have to pay rent/mortgage payments or face eviction. To this end, the Texas Supreme Court is allowing the emergency forbearance order to expire and will not enforce federal orders to stop evictions. For more, NPR wrote the following article: Texas Courts Open Eviction Floodgates: “We Just Stepped Off A Cliff.”
Despite the blockbuster jobs report last week, Initial Jobless Claims continue to make very slow progress lower. This past week 744k new people filed for claims versus 728k the prior week. The number of federal and state continuing claims continues to hover around 18mm, the same level it has been stuck at for the last four months.
Yesterday’s Fed minutes from the March FOMC meeting were as expected for the most part. Below are a few noteworthy sections:
“Participants noted that it would likely be some time until substantial further progress toward the Committee’s maximum-employment and price-stability goals would be realized and that, consistent with the Committee’s outcome-based guidance, asset purchases would continue at least at the current pace until then.”
Per CNBC -” Though inflation shows up 64 times in the minutes, Fed officials indicated little concern that it might become a problem anytime soon. One notion in the minutes said that inflation forecasts were right around where FOMC members expected.”
“Disorderly conditions in the Treasury markets or a persistent rise in yields that could jeopardize progress toward the Committee’s goals were seen as cause for concern”
After the minutes were released, Lael Brainard essentially defined “Disorderly Conditions”: “I would be concerned to see disorderly conditions, like we saw Feb. 25.” On February 25th, the ten-year UST yield increased 13 basis points which represents a 2.73 standard deviation move. The graph below shows the daily standard deviation of changes in ten-year UST yields over the last ten years. A change of 2.73 or greater has occurred 41 times in the last ten years. In other words, the bar is set pretty low for the Fed to potentially take action to limit yields rising.
April 7, 2021
Per the headline below, some of the supply line-related problems are improving. Any inflationary pressures due to these temporary problems should abate with continued normalization.
* NATIONAL RETAIL FEDERATION – CONGESTION AT U.S. PORTS IS ABATING AS CONTAINER CARRIERS AND TERMINALS ADJUST TO NEW NORMAL
The graphs below show the MBA’s Purchase and Refi Indexes as compared to mortgage rates. We are watching them closely to see how higher mortgage rates affect both indexes and therefore the economy. In the first graph, showing the Purchase index versus the mortgage index, the index has not fallen significantly despite rates rising by about .60%. The correlation between home purchases and rates will likely be low for the time being due to the limited supply of houses on the market and rates that are still well below the 4.25% average for 2018/2019. The Refi index, on the other hand, is much more sensitive to the change in rates. The Refi index is back to pre-COVID levels despite rates that are still .50% lower. New home purchases play a large role in economic activity and job growth. Refi activity is also economically important as it allows existing homeowners to reduce their mortgage payments, allowing them to spend more.
Most economic data is reported on a year over year basis to help minimize seasonal effects. Data coming out over the next few weeks, for March of 2021, will be compared to March of 2020 when the economy was paralyzed. The graph below of credit card spending shows how the so-called “base effect” warps annual change (year over year) reporting. As shown, credit card spending is up an astonishing 64% versus a year ago. However, compared to more normal economic periods it is actually down 3.2%.
The two graphs below tell a similar story- Investors rooting for more inflation better be careful about what they wish for. The first graph, courtesy of Brett Freeze, shows that valuations have historically declined as the volatility of CPI increases. The second graph, from the Daily Shot, highlights that lower valuations are associated with higher levels of CPI. The current CAPE is 35. As shown in the second chart, the maximum CAPE for any historical CPI reading greater than 3% is in the low 20s. A decline from 35 to 20, assuming no change in earnings, entails an approximate 40% price decline.
April 6, 2021
The Job Openings and Labor Turnover (JOLTs) report from the BLS pointed to more good news on the labor front. Per the report, the number of job openings rose by 286k to 7.37m, back above where it was before the pandemic. At the peak a year ago, there were 4.60 unemployed workers for every job opening. That ratio has shrunk significantly to 1.40 but it still has room to fall as it was below 1.00 for much of 2019.
The chart below shows ten-year UST yields (white) and Fed funds (yellow) since 1986. Overlayed on the chart is the regression line as well as one and two standard deviations from the line. As circled, each time the yields hit the +2 standard deviation line, yields quickly reversed lower. Currently, the line comes in slightly north of 2%, about .25-35 bps higher than today’s level. The only difference between today and the past is Fed Funds. In the past, the Fed increased Fed funds multiple times before 2 standard deviations were reached. Today, the Fed is nowhere close to raising Fed Funds. If yields break above the 2 standard deviation line, not only would it be unprecedented, but it may cause the Fed to consider options such as Operation Twist, to stem further yield increases. For more on Operation Twist- Its Time To Do The Twist Again.
Last week we discussed how the hedge fund Archegos used total return swaps and shared collateral to amass significant leverage in the equity markets. A reader asked us to better explain what total return equity swaps are, so here it goes: A total return swap (TRS) is a swap agreement (derivative) allowing one party to receive a payment based on a set rate, usually, LIBOR, while the other party receives payment based on a fixed or variable rate. With an equity TRS, the transaction typically involves the bank receiving LIBOR plus a fee, while the hedge fund/investor receives the total return (price and dividend) on a stock, a basket of stocks, or an index. The benefit for the investor is they only need to put up collateral to back the trade and can therefore create leverage. Second, because they do not hold the stocks directly, they can avoid regulatory ownership rules. In the case of Archego, they used the same collateral with 7 different banks, meaning they could employ 7x the leverage normally gained on TRS. If you want to learn more, the WSJ has an excellent description of TRS including more color on how Archego used the swaps- LINK.
It is likely Archego is not the only fund to back TRS with shared collateral. As we saw with stocks used in Archego’s TRS, like VIAC and DISC, upward and downward volatility can be amplified due to the extreme leverage.
April 5, 2021
***We are having a data issue this morning on numerous pages. Please bear with us as we fix the problem.
Treasury Secretary Janet Yellen is pushing for a minimum global corporate tax rate. On the heels of Biden’s plans to retract Trump’s corporate tax rate cut, Yellen would like to see similar measures taken abroad. It appears she is concerned that higher taxes on U.S. corporations will impede their global competitiveness and incentivize companies to offshore operations. Per her speech:
“Together we can use a global minimum tax to make sure the global economy thrives based on a more level playing field in the taxation of multinational corporations and spurs innovation, growth, and prosperity,”
Today’s ISM Services survey, similar to last week’s manufacturing survey, was much stronger than expected, coming in at a record 63.7. The prices paid sub-component is now the highest since 2008.
This week should be relatively quiet on the economic front. Likely garnering the most attention will be PPI on Friday. Surveys and expectations continue to point to a surge in inflation, but PPI and CPI have yet to show the same. It is worth noting that PPI is for March, thus year-over-year data will show an uptick due to strong deflationary conditions last March. The current expectation for PPI yoy is +2.5%. The Fed’s minutes from the last FOMC meeting three weeks ago will be released on Wednesday.
In our ongoing quest to gauge inflation expectations, we present a new graph. The chart below shows the relatively strong correlation between the Australian dollar and U.S. 5-year inflation breakevens. The correlation is tight because Australia is a large commodities producer/exporter and almost all of their trade occurs in U.S. dollars. As such, the value of their currency is closely tied to inflation expectations. Since January 1, 2021, the AUD is unchanged while implied inflation is up by nearly .50%. Either the correlation may be temporarily breaking down, the AUD is signaling a weaker dollar, or the AUD is warning that U.S. bond traders may be pricing in too much inflation.
The BLS Employment Report was stronger than expected at 916k versus 468k last month. The unemployment rate fell to 6% from 6.2%. Average hourly earnings fell, likely because many new hires are in the service industry which tends to be low-paying jobs. The sector accounting for the most jobs gained was the leisure and hospitality sectors with a pick up of 280k jobs. A summary of the report is below.
April 1, 2021
With today’s equity market rally, the VIX (volatility index) has fallen back to pre-COVID crisis levels. The dotted line shows the current sub-18 reading is fairly typical for the two years preceding the pandemic.
The ISM Manufacturing Survey came in at 64.7, the highest level since 1983! The Prices Paid sub-component rose further to 86 from an already high 82.10. The prices paid reading is in rarified territory. Since 1950, it has only been above 90 for a total of 18 months. Two of those months were in 2008, the remaining data all occurred before 1980.
Weekly Jobless Claims rose by 61k to 719k. Through March 13th, there are still 18.2 million people receiving state or federal jobless aid. The volatility of the workforce in regards to the number of people being hired and fired is tremendous. Consider, the market is expecting the BLS to report that, in aggregate, 625k jobs were added last month. During the same month, almost 3mm people lost their jobs according to weekly jobless claims data.
The bond markets will close at noon ET today and the equity and bond markets will be closed tomorrow for the Good Friday holiday. Despite, market schedules, the BLS employment report will still be released tomorrow. Current estimates point to strong job growth in March, as shown below.
Welcome to April. The graph below, courtesy of Bank of America, shows that since 1928, the month of April has the second-best average monthly return (+1.37%), and posts positive returns nearly two-thirds of the time. Only December, at 74%, has a better win-loss percentage.
The graph below, courtesy of the Visual Capitalist, shows the problem the Fed faces as interest rates fall too much. The green dots show that household spending increase as interest rates decline. This occurs in falling rate environments as less interest earned on savings makes saving not as desirable. Further lower borrowing costs incentivize people and corporations to borrow and spend. However, the benefits of lower rates start reversing when the 10-year UST yield falls below 4%. The Fed tries to steer economic activity by manipulating interest rates. While their intent is to enhance economic activity with lower rates, they may have pushed rates too low and their actions are actually having the opposite effect. This is known as the Paradox of Thrift.
March 31, 2021
The NAR pending home sales data for February was weak. To blame is the cold snap in the midwest/south and rising mortgage rates. That said, the data comes with a grain of salt as the supply of houses is abnormally low. Per NAR President Lawrence Yun: “The demand for a home purchase is widespread, multiple offers prevalent, & days-on-market are swift but contracts are not clicking due to record-low inventory,”
The Chicago PMI manufacturing survey rose sharply to 66.3 versus 59.5 last month. The current reading is the highest since Q3-2018. The employment and priced paid sub-indexes continue to rise. The broad index is now within a couple of points of the prior peaks of the last 30 years.
The ADP Jobs Report was slightly stronger than expected at +517k and well above last month’s +176k. Not surprisingly, approximately a third of the new jobs were in the leisure and hospitality industry.
This morning there is more troubling news on Archego leaking out. It is now rumored that the hedge fund used the same collateral to enter equity total return swap contracts with as many as seven banks. Given there is already some leverage embedded within the swap structure, using the same collateral allowed them to amass at least 7x leverage. Assuming such leverage, a decline of 14% in the equities underlying the swaps would bankrupt the fund, leaving the banks on the hook for the equity exposure within the trades and no collateral to protect them. It is rumored that Goldman Sachs and Morgan Stanley were aware of this early and liquidated Archego’s swaps. They were likely to seize the collateral to help offset losses. Nomura, Credit Suisse, and other banks were left holding the bag.
Today, Joe Biden is expected to release an array of tax proposals to help fund his aggressive spending plans. The four biggest changes, based on what has been leaked, are highlighted below:
Raise the corporate tax from 21% to 28%
Impose a minimum tax on profits of foreign subsidiaries
Tax capital gains as regular income for high wealth/income classes and tax unrealized gains at death
Raise the top individual tax rate to 39.6% for those making $400k or more
With the quarter ending today, corporate earnings reports will hit the wires in the second half of April. Unlike any time over the last decade-plus, inflation will be a key topic in earnings commentary and management calls. Manufacturing surveys, such as ISM (Prices Paid) shown below, are reporting that a large percentage of companies are bemoaning higher prices for raw materials. As such, profit margins are at risk if higher input costs can not be passed on to the consumers of their respective goods. The Financial Times recently published an interesting article on the topic entitled U.S. companies sound inflation alarm.
March 30, 2021
Consumer Confidence jumped sharply from 90.4 to 109.7, the largest monthly increase since 2003. The surge in confidence is a good sign the economic recovery continues. Stimulus checks, vaccinations, and the reopening of the economy should help improve confidence going forward.
The graphs below, courtesy of Brett Freeze, show the strong correlation between the price of gold and the combination of 10-year real yields and the Japanese Yen. Per the chart, the correlation of Brett’s model is significant with an R-squared of .88, denoting 88% of the price of gold is based on real yields and the yen. Gold is trading at $1680 this morning, slightly below its average premium to the model, but still about $30 above the model’s fair value.
The nine charts below show the large declines in stocks that are said to be part of the Archegos liquidation occurring Friday and yesterday. It is possible banks/dealers may still own sizeable shares of these companies as they are waiting for some price recovery or the new quarter to sell the rest. In other words, the selling pressure in these names may not be over. It is now rumored that Credit Suisse Bank is now looking at losses of $7 billion, up from estimates of $4 billion yesterday.
Yesterday afternoon Press Secretary Psaki announced that Biden is planning on rolling out another COVID stimulus relief bill in April, separate from this week’s forthcoming infrastructure plan. Bond yields rose, in part, on concerns of even greater federal spending.
ZeroHedge put out an interesting article in which they discussed a sharp uptick in corporate stock buybacks. The graph below from the article shows the four-week running average is now at a record high. Over 55% of the buybacks were in the technology sector, which is not surprising given many of the larger technology firms have large cash balances and shares that have been relatively depressed. Financials were second, accounting for about a quarter of the buybacks. Given many banks will be shedding loan loss reserves in the coming quarters we suspect they will continue to buy back shares.
March 29, 2021
On Wednesday President Biden will release details of his infrastructure plan as well as plans on how to fund it. The markets, thus far, have focused on spending and its stimulative effect, but at some point, it will also have to factor in likely increases in personal and corporate tax rates.
Shares in Viacom (VIAC) started the year at $40, rose to nearly $100 by mid-March, and just over the last week fell back into the 40s. We learned this weekend the sharp losses in VIAC, along with DISC and a few other stocks is due to a large, heavily leveraged hedge fund (Archegos Capital) failing. Nomura and Credit Suisse Bank are said to be taking larges losses as a result. Other European banks are also at risk, but thus far no significant losses have been pinned on U.S. banks. For more on the story from Reuters- LINK
The first quarter ends on Wednesday, which might induce some volatile price action due to portfolio rebalancing. Such trades may help bonds as many investors are likely under-allocated to bonds due to their steep price declines the past few months.
This week we get updates on the labor market with ADP on Wednesday and the BLS employment report on Friday. The current estimates point to a pick-up in job growth with a gain of 480k jobs and a 0.2% decline in the unemployment rate. Interestingly, we cannot trade on the BLS data as the markets will be closed for Good Friday.
Also this week, the Chicago PMI and ISM Manufacturing survey will provide us March readings. Investors will focus on the underlying prices data to better assess inflation expectations.
The graph below shows what Treasury bond and TIP yields imply about future inflation expectations. The graph shows the difference between implied inflation expectations for the five-year period starting five years from now versus that of the next five years. As shown, a year ago the markets were concerned that the lockdowns were temporarily deflationary. As such five-year inflation expectations rapidly fell about 1% more than those five years in the future. Since then the tide reversed. Market prices now imply inflation will run .38% lower in years 2026-2031 than the next five years. We can use this graph to help determine if the market believes the Fed in that inflation will be transitory. Currently, bond investors concur with the Fed. If the difference continues to decline it will represent further confirmation.
The University of Michigan Consumer Sentiment Survey was strong for the month of March. The index was 84.9, up from 76.8 in February and above estimates of 83. 1-year inflation expectations were unchanged at 3.1%. The latest round of stimulus coupled with economic reopening and better than expected uptake of vaccinations is boosting consumer confidence. Interestingly, inflation-adjusted income expectations were 1.1%, the lowest since January 2017
Late Thursday afternoon the Fed announced, as of June 30th, they will remove restrictions on the ability of most banks to buy back their shares or increase dividends. The announcement should provide more upside impetus for the sector.
Mikael Sarwe of Nordea Markets recently published A Perfect Storm Brewing Part 2, in which he forecasts yields and inflation can increase significantly from current levels. The base of his argument is that the COVID-related recession will be short-lived and the amount of stimulus is unprecedented. To wit: “It is important to understand that the slump of 2020 was a disease-driven output shock and not a recession where economic imbalances got laid bare as central banks tightened policy by hiking rates. From a macro perspective, 2020 was nothing like the financial crisis, after which it took 10 years to close the output gaps created by the crisis. This time, as soon as the root cause of the output shock is cured, which will be very soon, the economies can be expected to get back to the starting point very quickly.”
In regards to CPI he wrote: “To me, there is a high likelihood of US core inflation spiking the coming months, falling back slightly over the summer but then reaching new highs in late 2021. Perhaps we will see the highest core CPI in almost 30 years?”
In his opinion, a strong recovery coupled with central bankers that will be slow to remove stimulus and aggressive fiscal stimulus is a recipe for more inflation and stronger growth. He does warn however that while his forecast may seem rosy for equity investors, there is a strong inverse correlation between the forward S&P P/E and the 5-year real yield. If real yields rise as he forecasts, forward P/E’s should decline, creating a headwind for stock prices.
The article is full of compelling graphs. We share two of them below.
Weekly Initial Jobless Claims fell to 684k. This marks the first week below 700k since the Pandemic started! The number of claims for Federal assistance also fell nicely from 284k to 241k. Continued improvement in the labor market should help reduce the number of continued state and federal claimants which remain near 19mm.
The Tweet and graph below from SentimenTrader show that “smart money” has been selling at a rate not seen in over 20 years. It is theorized that so-called “dumb money” buys or sells at the market opens on emotions, while “smart money” digests the day’s events and makes more calculated trading decisions later in the day. Click HERE to read more on the Smart Money Index.
The graph below shows that investor cash inflows on Tuesday into the Tech sector were the largest in nearly 20 years. The sector has recently fallen out of favor as interest rates have risen. Interest rates are now consolidating/declining and with that, it appears we are seeing investors rotate back toward the “safety” of technology from more risky sectors like energy, value, and small-caps.
The graph below came from a WSJ article entitled Everywhere You Look, The Global Supply Chain is a Mess. Shortages of raw and finished materials are causing inflationary pressures. Chairman Powell understands these problems are temporary and thus his belief that inflationary pressures are transitory. Per the article:
“The long-term economic impact remains unclear. Federal Reserve Chairman Jerome Powell said at a press conference Wednesday that he expects supply chains to adjust as economic growth accelerates. “It’s very possible, let’s put it that way, that you will see bottlenecks emerge and then clear over time…. These are not permanent. It’s not like the supply side will be unable to adapt to these things. It will—the market will clear. It just may take some time.”
It is worth noting that yesterday’s weak Durable Goods data and forthcoming manufacturing data will be negatively skewed as manufacturers, in many cases, are unable to produce enough to meet demand.
March 24, 2021
The Federal Reserve of Dallas surveyed 92 energy firms to arrive at the chart below showing the break-even price of oil required for said firms to operate profitably. The line represents the average price per region and the tops and bottoms of each bar represent the survey’s high and low prices. WTIC is currently trading at $60, above the mean for each drilling area below.
Late yesterday afternoon, Fed Governor Lael Brainard echoed Powell’s and Yellen’s comments from earlier in the day. The headline is as follows: “FED’S BRAINARD: WE HAVE SEEN SOME CLASSES OF ASSETS IN THE HIGH END OF THEIR HISTORIC RANGES.”
It is not a coincidence there are suddenly multiple comments on the topic of asset inflation. It serves as a warning, of sorts, the Fed will not be uber-reactionary to a small drop in stock prices. That said, a decline of 20% or more and they are likely to voice concern and possibly take action.
With inflation expectations on every investor’s mind, it’s worth remembering Goodhart’s Law. Charles Goodhart’s adage states when a measure becomes a target, it ceases to be a good measure.
The following paragraphs, Courtesy of Prometheus Capital, quantify how the Fed’s QE purchases have skewed the implied inflation markets higher by about .60% to .70%, limiting its value as a “measure” of potential inflation.
The Fed Stimulated The TIPS Market Disproportionately
Another strong market signal of inflation expectations is breakeven inflation. To calculate breakeven inflation, we subtract the yield on a TIPS bond from that of a nominal bond, giving us “what the market thinks” about inflation. Hence, there are two potential causes for higher breakevens, a higher nominal bond yield or a lower TIPS bond yield. Below, we show how we have seen more of the latter, i.e., lower TIPS yields:
Given that the TIPS rate is predominantly driving the breakeven rate, we think it makes sense to look at what is causing this move. In today’s treasury markets, the largest driver of market moves changes in the Fed’s share of an existing market. We show this for the TIPS market and nominal bond market below:
In response to the COVID-19 crisis, the Federal Reserve purchased large amounts of the outstanding treasury market. However, the distribution of these purchases was not entirely even. While the Fed initially both TIPS and nominal bonds at an equal rate relative to their market size, over time, the Fed ended up purchasing more of the TIPS market than the nominal bonds market. The divergence in these purchases has led to more downward pressure on TIPS bonds than on nominal bonds, i.e., it has driven breakeven inflation to higher levels. We can see this impact below:
In the above scatterplot, we are looking at the relationship between two items. The first is the relative change in the Fed’s market share of TIPS versus nominal bonds. We calculate this by taking the year-over-year change in the Fed’s share of the TIPS market, minus the year-over-year change in the Fed’s share of the nominal bond market. The second item is the year-over-year changes in breakeven inflation.
We observe that as the Fed increased its market share of TIPS faster than of nominal bonds, breakeven inflation rose. Hence, we don’t think the TIPS market is necessarily pointing to higher inflation; it is just telling us that there has been disproportionately more demand for the outstanding asset base.
March 23, 2021
Stocks weakened throughout the afternoon in part due to comments from Janet Yellen and Jerome Powell in which they said asset prices were elevated versus historical norms. While truthful, such statements are not typical from the head of the Fed and U.S. Treasury. The graphs below show the small/mid-caps, and the recent sectors outperforming the market took the brunt of the selling pressure.
Following yesterday’s weaker than expected existing home sales report, today’s new home sales data also struggled in February. Yesterday we mentioned weather as a factor along with higher mortgage rates and home prices. Interestingly, the weather story accounts for some weakness but prices and mortgage rates are also playing a big role. New home sales in the midwest fell sharply, but they also did in the Northeast and the West, where February’s weather was not a problem. The supply of new homes measured in months rose from 3.8 to 4.8. As shown below, the seasonally adjusted annual rate of new home sales is back to pre-COVID levels.
The Tweet below provides a 30 year perspective on the lower progression of U.S. Treasury yields and the shape of the yield curve.
https://twitter.com/i/status/1374315992780783620
According to Julien Bittel there is “no shortage of bulls out there.” His graph below shows the strong correlation between the University of Michigan (UM) survey of participants expecting stocks to rise and the price ratio of stocks to bonds (SPY:TLT). The current UM level, 65% of the participants expecting stocks to rise in the next year, is near 20-year highs. Per Julien: “Highest since Feb ‘20 & only 3 months in the last 20Y have we been higher.“
We expand on the current state of extreme bullish sentiment with the graph below, courtesy of Goldman Sachs. The graph shows short interest is back to the record lows last seen prior to the tech crash of 2000. Neither graph dictates that a sharp decline is imminent, but they do serve as a warning that everyone is on the same side of the boat. We will continue to respect the move higher but are careful not to get complacent to historical levels of sentiment and valuations.
March 22, 2021
The combination of higher prices and mortgage rates is starting to weigh on the housing markets. Existing home sales are still elevated but fell 6.6% last month to a six-month low. Even with the decline, the number of home sales is running about 700k more per year than pre-COVID.
The Chicago Fed National Activity Index unexpectedly fell sharply to -1.09 from .75. This was the first decline in the index since March of 2020. Prior to 2020, the last time the index was this negative was during the financial crisis. We must be careful not to read too much into the report as it may be an anomaly due to the cold snap in February.
Last Friday we noted that the Fed’s SLR exemption, temporarily removing capital requirements on bank’s reserves and U.S. Treasury holdings, was not extended and will expire at the end of the month. The graph below, courtesy of Bloomberg, shows bank balance sheets are bloated with reserves (from QE) that will now require capital. To accommodate the reserves, banks can sell assets to free up capital or raise capital via equity offerings. Also, the banks may sharply reduce loan loss reserves in the current quarter which will increase profits, thereby increasing capital.
Jerome Powell is taking to the media to clarify the Fed’s recent FOMC meeting and better justify continued aggressive monetary policy despite solid economic recovery. On Friday, the WSJ published an editorial by Powell in which he reviews his actions over the last year. He ends as follows: “But the recovery is far from complete, so at the Fed we will continue to provide the economy with the support that it needs for as long as it takes. I truly believe that we will emerge from this crisis stronger and better, as we have done so often before.”
Jerome Powell will also speak This morning, Tuesday, and Wednesday. With the Fed out of their self-imposed blackout period, Fed members will again be active on the speaking circuit.
Existing and New Home Sale data for February will be released today and Tuesday respectively. Other economic data due out this week include Personal Income and Spending, February PCE price index, and Durable Goods.
Despite all the hoopla about spending on clean energy, the growth of new investments in clean energy has not really increased over the last five years, as shown below courtesy of The Visual Capitalist.
To some surprise, the Fed decided to let the Supplementary Leverage Ratio (SLR) expire on March 31. The SLR essentially allowed banks to avoid holding capital on reserves and Treasury bonds. We assume the banks knew of this ruling in advance and sold bonds. This may explain yesterday’s decline in bond prices. Stocks, led by the financial sector, are trading weaker this morning. Bond yields are up a few basis points, with the 10-year UST yield back to yesterday’s high of 1.75%.
Today is quad-witching today in the options market, so expect some volatility, especially at the open.
The graph below of real GDP helps put context to the market’s trepidation around the Fed’s new economic forecasts and current monetary policy. The Fed now expects real GDP growth of 6.5% in 2021 but intends to keep interest rates at zero and QE humming for two more years. It has been about 35 years since the U.S. experienced such strong economic growth. Running the economy hot with massive monetary and fiscal stimulus is a recipe for inflation, of which the bond or stock market is not priced for.
From a sector allocation perspective, the question we continue to grapple with is whether we expose ourselves more toward the inflation/reflation trade or the deflationary trade. Recently, that translates into deciding between the Dow (DIA) and the Nasdaq (QQQ). The graph below is a ratio of the price of QQQ to the price of DIA. It shows the ratio has consolidated in a very wide range over the last 8 months and is forming a megaphone pattern. If the ratio breaks lower out of the pattern, the inflation trade may have legs to the benefit of the DIA. If the ratio respects the pattern, tech/growth (QQQ) may have a period of nice outperformance. The MACD and RSI are grossly oversold pointing to the likelihood the ratio bounces in the coming weeks. The gray area from 2016-2017 shows a period when both indicators were deeply oversold.
The graph below charts Peter Lynch’s popular rule of 20 valuation method. His rule deems a P/E of 20 less CPI to be fair value. As shown, the metric just surpassed the highs of the dot com bubble and sits at 65+ year highs. The current flaw in his model is that it uses trailing earnings that are highly depressed from the pandemic and not necessarily representative of the current earnings potential.
March 18, 2021
**Lance Roberts is taking a much-needed vacation this week. Three Minutes on Markets will resume next week**
Markets fell in part due to crude oil but also a new lockdown in Paris France. They just announced that all shops will close on Saturday and remain closed and residents are advised to stay indoors. This is expected to last for 4 weeks.
Crude Oil fell sharply today with futures closing at $60 per barrel down over 7% on the day and nearly 15% from its recent highs. If the decline is sustained in the coming weeks, it draws into question the inflationary mindset driving markets.
The Philadelphia Fed Business Outlook soared to 51 from 26, the highest level since 1973. Within the report, the Prices Paid Index rose to levels last seen in 1979. Despite the rosy report on the economic outlook and continued economic reopening across the country, Initial Jobless Claims continue to languish. Initial Claims for the week rose to 770k up from 725k last week.
After a slow reaction, the bond market appears to have heard yesterday’s Fed’s message loud and clear. The ten-year UST yield jumped to 1.75% this morning. Jerome Powell stated that the economy was improving more quickly than expected, resulting in an upgrade of the Fed’s GDP, employment, and inflation forecasts. Of concern, despite the improved outlook, the Fed appears to be locked into its current policy for two more years. The Fed Funds market is not buying it. Fed Funds futures in late 2022 are now priced for a 50% chance of rate increase before year-end 2022. Higher rates, which will depress economic activity, and increasing odds the Fed tightens sooner than expected are likely to continue weighing on equity prices.
Below are 5 & 10-year real UST yields. As shown, both have been moving higher recently, resulting in marginally tighter financial conditions. While both real yields remain deeply negative, the recent increase provides some ballast to the Fed’s aggressive monetary actions. Tighter financial conditions will counter some inflationary pressures providing leeway for the Fed to keep monetary policy aggressive. This dynamic might help explain why the Fed seems unconcerned with rates rising in an “orderly” fashion.
The graph below provides guidance on where commodity prices may be headed over the next year. The blue line is an average of commodity pricing curves. It shows that current (spot) prices are higher than futures prices by about 10% on average. In other words, producers of commodities are financially incentivized to bring as much product to the market today instead of waiting. The black line shows spot commodity prices on a one-year lag. Not surprisingly there is a tight correlation of commodity prices to the shape of the futures curves from a year ago. If the correlation holds up over the next year we should see a steep decline in commodity prices as supply will ramp up quickly given the current price incentives and strong demand.
March 17, 2021
The Fed statement reads similarly to the last statement. The only difference of note is their forecasts for this year were increased. They see PCE inflation running at 2.4% for 2021, up from 1.8%. They believe it then falls to their target of 2.0% in 2022 and to 2.1% in 2023. They also upgraded 2021 GDP growth to 6.5% from 4.2%. 4 of 18 Fed members think they will hike rates in 2022, rising to 7 in 2023. The graphic below shows the Fed only made minor changes to the prior statement from January.
Stocks, oil, and gold are rallying on the statement, while bonds continue to sell-off and the dollar trades lower.
**Lance Roberts is taking a much-needed vacation this week. Three Minutes on Markets will resume next week**
Housing Starts were much weaker than expectations coming in at 1.42 mm units annualized versus expectations of 1.57 mm and a prior month reading of 1.584 mm. Starts hit a 14 year high in December at 1.677mm units. New Home Permits are also showing weakness, coming in about 200k units below last month’s level. Higher mortgage rates and inflation in timber, copper, and other goods used in housing construction are starting to weigh on homebuilders’ incentives to build new homes.
Today, the Fed will conclude its Federal Open Market Committee (FOMC) meeting and update its monetary policy stance. The statement, due for release at 2:00 pm ET, is likely to be very similar to last month’s statement. Jerome Powell will follow it up with a press conference at 2:30 pm. Investors are looking for any signs the Fed is concerned with inflation or inflation expectations. We suspect, they will continue to view any inflationary pressures as transitory. It is likely the Fed views the recent uptick in rates as a financial tightening, which gives them further room to keep the monetary pedal to the metal.
The graph below compares Retail Sales data from the Census Bureau and First Merchant Services credit card spending data. The two data series were very well correlated before COVID. Since then, the correlation has faded. There are two curious things worth noting about the chart. One, there is a divergence between the last data points. This may be a one-off effect from cash spending due to the latest round of stimulus checks. Second, data from First Merchant has not recovered as Retail Sales have. This is surprising because online spending accelerated during COVID lockdowns, and said spending requires a credit or debit card. The counterargument comes from the CEO of Brinks via CNBC- “Cash usage is up in the U.S., despite the coronavirus pandemic’s impact on the economy, cash management company Brinks CEO Doug Pertz said Tuesday.”
March 16, 2021
Today’s weak Retail Sales and Industrial Production data pushed the Atlanta Fed GDPNow forecast lower from over 8% to just under 6%. 6% is still very strong but more in line with Wall Street estimates.
Just as a reminder of how far the markets have come in the last year, we share a screenshot from CNBC from March 16, 2020.
As shown below February Retail Sales were weaker than expected, however, last month’s data (January) was revised decently higher. This data is difficult to assess due to seasonal quirks and the timing of the last round of stimulus checks versus when the data was collected. Also, the cold snap through the midwest and south, along with numerous snow/ice events on the east coast also dampened activity.
Last weekend David Brooks wrote an editorial for the New York Times, Joe Biden is a Transformational President, which is receiving a lot of attention. He basically applauds large federal spending packages designed to help the lower classes and shrink the wealth gap. Regardless of your politics, the paragraph below is worth reading closely to better understand the emerging mindset of economists and the Fed. Brooks essentially claims massive federal debts and aggressive Fed actions to “fund” the debt is not inflationary. In our opinion, this editorial is an important step toward acceptance of MMT (modern monetary theory). For more on MMT, we share a two-part article Lance Roberts wrote last year- The Theory Fall Flat When Faced With Reality.
“It was assumed, even only a decade ago, that the Fed could not just print money with abandon. It was assumed that the government could not rack up huge debt without spurring inflation and crippling debt payment costs. Both of these concerns have been thrown out the window by large numbers of thinkers. We’ve seen years of high debt and loose monetary policy, but inflation has not come.”
Will this time be different with “the restraints cast aside” as David Brooks puts it?
The graph below, comparing the Baker Hughes North American Rig Count to the price of crude oil, paints a bullish picture for the price of crude oil. As shown, oil is back to nearly $70 a barrel, similar to where it was in 2018 and 2019. Rig counts, on the other hand, are less than half the level they were at during those same periods. The combination of weak growth in the number of oil rigs employed and sharply growing demand for oil as lockdowns end argue for higher prices ahead.
March 15, 2021
SentimentTrader put out the following statistic this afternoon- “This is only the 7th time since 1897 that the Dow Industrials set 4 record highs in a row, gaining at least 0.5% each day. 3 of those triggered before 1900.“
With the $1.9 trillion stimulus deal signed, Biden is looking ahead to the next package. Unlike the prior bill which relies fully on debt to fund spending, the new deal is said to include funding via tax increases. Any tax increases will likely fall on the shoulders of the wealthy and corporations. The 2018 corporate tax cuts are set to expire in 2025, but it’s possible Biden reverses them sooner. Further chatter about corporate tax hikes is likely to provide a headwind for stocks, just as the tax cuts three years ago provided a boost to prices.
The graph below shows the surge in used car prices occurring over the last 9 months. The most recent jump in prices appears to be a result of the late 2020 stimulus checks. With another round of stimulus checks coming we should probably expect the index to keep rising. Used car prices are not a relatively important component in inflation calculations, accounting for only 2.53% of the BLS CPI model.
There will not be any Fed speakers until after the Fed’s FOMC meeting on Wednesday. However, by early next week, we will likely see a wave of Fed members clarifying the Fed’s latest monetary policy statement. On the heels of the meeting, investors will no doubt pay close attention to any mention of how higher interest rates might affect Fed operations or economic activity.
On Tuesday, the Census Bureau will release February’s Retail Sales. It is expected to decline following last month’s surprise 5.3% increase. The gains last month were in large part due to the stimulus checks released in late 2020. On Wednesday, Building Permits and Housing Start releases will be the first chance to see if higher interest rates are affecting plans to build new homes. The NAHB Housing Market Index on Tuesday is expected to decline slightly. Zero Hedge recently published an article in which they discussed how rising commodity prices are adding to the costs of building new homes. Since early 2020, before COVID ravaged the economy, Copper has risen 161% and Lumber by 216%.
Like the CPI report on Wednesday, today’s PPI report was near consensus expectations. Year over year PPI is now running at 2.8% versus 1.7% last month. Annual data is starting to capture the initial price declines from the COVID shutdowns last February, which elevates the year-over-year change.
Consumer Sentiment rose nicely to 83 from 76.8. The recent round of stimulus checks, another check coming, and vaccinations should help sentiment continue to improve through the spring months.
In the Tweet below, Jim Bianco asks and answers the most important question facing investors of all asset classes.
Q: “When does this stop?”
A: “When something breaks.”
His question and answer are based on Treasury yields from the last 40 years. Spurts higher in interest rates have more often than not resulted in financial and/or economic crises. Next Wednesday we will publish an article that quantifies how much more rates can rise before “something breaks.” The graph below the tweet shows relatively small increases in rates and the various crises associated with them.
Bond yields are rising sharply this morning despite relatively well bid 10 and 30-year auctions on Wednesday and Thursday. The 10-year UST yield is back to 1.60%, the recent high from Monday. Given the wedge-like pattern forming in the 10-year, it is becoming more likely it will break higher over the coming days/weeks. The dollar is trading higher, gold lower and stocks are mixed. As we have been seeing, higher yields are pushing NASDAQ futures down 1.5%, while the Dow Jones is slightly higher and the S&P falling in between the two indexes.
Does value beat growth in a rising yield environment?
At first blush, we would answer with a resounding yes. Our justification is value companies tend to use less leverage making profits not as sensitive to higher interest rates.
To help answer the question, we assessed nearly 100 years of data courtesy of Dartmouth (French/Fama). We created several statistical models and found no significant correlation between the value/growth trade and yields.
It turns out the task was simpler than we thought. All we needed to do was compare a value/growth index versus 10-year yields. The answer: value consistently outperforms growth, regardless of the rate environment.
The red shaded area denotes the last environment with consistently higher yields. The green period highlights the yield decline over the previous forty years. The second graph shows rolling five-year annualized returns of value versus growth.
Note- the last decade, in which growth has beaten value, is the anomaly, not the rule. Just as we started with a question, we leave you with one: are we entering a new paradigm?
March 11, 2021
The graph below helps answer a question that we have been asked numerous times over the past month- How do higher interest rates affect housing affordability? The graph compares mortgage rates in blue with the amount of home one can buy with a $3,000 monthly payment. Since January, mortgage rates have risen 41 basis points. During that period the amount of house which a $3,000 monthly payment could buy fell from $744k to $706k. Broadly speaking, for each 1% increase in mortgage rates affordability drops by 12%, and for each 1% decline in rates, a buyer can afford a 14% higher price.
The European Central Bank (ECB) surprised markets this morning by increasing its pace of QE “significantly.” To wit- “purchases under the PEPP over the next quarter to be conducted at a significantly higher pace than during the first months of this year.” Bond yields in Europe are falling as is the Euro versus the dollar. U.S. bond yields are declining slightly in sympathy and equities are rallying on the news. It appears the recent uptick in European bond yields, even though still negative in many cases, was enough to spook the central bank. The German 10yr-Bund yield which peaked at -0.23% a week ago, is now trading at -0.34%.
The term SLR is likely to become popular over the coming weeks. The SLR or Statutory Liquidity Ratio is the Fed’s regulatory mandate to banks quantifying the amount of capital they must hold for each asset type. In March of 2020, the Fed allowed banks to hold U.S. Treasury securities without any capital. The temporary ruling allowed the banks to more easily absorb the massive supply of Treasury issuance. Now, a year later, and the temporary ruling is set to expire (March 31st). If the change does not get extended, the banks will likely need to sell U.S. Treasuries to meet the SLR.
The graph below shows the ratio of the price of crude oil to the price of IEF, the 7-10yr UST bond ETF. As shown, the ratio is hitting a trend line that has reliably proven to be of strong resistance in the past. The graph argues yields and crude oil prices may be peaking.
March 10, 2021
The Game Stop games are happening again. GME closed last Friday at $137. This morning it rose $100 to touch $350. Within 15 minutes of hitting $350, the stock tumbled to $200. For a few minutes, GME was the largest stock in the Russell 2000 Index. GME is not for the faint of heart!
CPI came right on the screws as shown below. Helping moderate prices is the way the BLS calculates home prices. The BLS uses an implied rent model, which is currently at 10-year lows on a year over year basis. Case-Shiller and other respectable home price indexes are up over 10% the last year.
US CPI 0.4%, Exp. 0.4%
CPI Core 0.1%, Exp. 0.2%
CPI YoY 1.7%, Exp. 1.7%
CPI Core YoY 1.3%, Exp. 1.4%
The Fed has a 70 percent limit in regards to how much of any Treasury issue they are allowed to own. The quote and table below show the Fed, despite ongoing massive QE operations, has plenty of ability to keep buying. The declaration not only includes the $80bn a month in Treasury purchases via QE, but flexibility, as well, if they are to invoke Operation Twist. This morning we wrote on Operation Twist and what it may mean for markets – It’s Time To Do The Twist Again!
Per Danielle DiMartino Booth and Bloomberg: “The Fed “has >$1.3T of firepower left in securities w/> 7 years to maturity, w/$725B in 20-30-year sector. Looking at TIPS market, the Fed has $600B left before owning 70% of it (1-30 years)”
The graph below highlights how investors continue to rotate into and out of inflation/deflation sectors at a fierce pace. Yesterday, Technology was up over 4% and is still down 3.4% for the last 5 days. Conversely, Energy was down 1.29% yesterday and is up 4.48% for the last five days.
CPI will be released at 8:30 this morning. Yesterday, we suggested CPI Y/Y could rise 2.3% based purely on the price of crude oil. It is worth noting, our model uses month-end prices while the BLS takes an average of prices during the month. Given the sharp decline in oil prices in February, our model is likely to project a higher CPI Y/Y than the BLS.
March 9, 2021
One of the biggest storylines of the last few weeks is the strong correlation between bond yields and the NASDAQ. The graph below shows the running 20-day correlation between ten-year UST yields and QQQ. Note the current correlation is -0.92, meaning 92% of the price change in QQQ can be explained by yields. Today’s reading is the strongest bout of negative correlation in at least the last decade. Interestingly, the current 20-day correlation between the Dow Jones Industrial Average and bond yields is slightly positive, as energy and financials, which are more heavily weighted in the Dow, benefit to some degree from higher yields and rising inflation.
As shown below, the NFIB Small Business Optimism Index upticked last month but still remains at somewhat depressed levels. The table of the components helps better assess the employment situation for small businesses, which account for more than 50% of employment in the U.S. As shown, Plans to Increase Employment remain low at 18% (% planning to increase less % planning to decrease) but current job openings rose nicely to 40%. As economic reopening speeds up, small businesses will hopefully see a marked improvement in hiring plans.
The scatter plot below highlights the strong correlation between the annual change in crude oil prices and the annual change in CPI. The r-squared is statistically significant at .54. The orange dots show where the next four months of CPI should print based on the current price of oil and the model’s regression formula. The model’s estimate for tomorrow’s CPI year-over-year change is +2.3%. The estimate rises sharply to 4.8% in March and peaks at 8.9% when April’s data is released in May.
Driving the large inflation forecast are the plummeting oil prices from last spring and the resulting annual change. The coming huge percentage changes in many CPI components is one of the reasons the Fed has been very outspoken that the current bump in inflation is transitory.
March 8, 2021
Last week we wrote on negative repo rates and how it implied large short positions in ten-year Treasury notes. The chart below confirms our suspicions.
In an MSNBC interview, Janet Yellen parrot’s recent Fed member comments on inflation being transitory. Per Bloomberg- “I really don’t think that’s going to happen,” Yellen said in an interview with MSNBC Monday, when asked about concerns that consumer-price pressures could surge as a result of deploying the stimulus despite the economy already gathering pace. Inflation before the pandemic “was too low rather than too high,” she noted.
This is important because Janet Yellen has Biden’s ear. As such, he will be more likely to support the Fed letting inflation run hot.
The economic spotlight will be on inflation this week. CPI will be released on Wednesday followed by PPI on Friday. The data is for February. Because of the very weak economic activity last February it is likely annual inflation measures will spike.
On Wednesday the Treasury will issue ten-year notes and on Thursday 30-year bonds. Everything else equal, these auctions will weigh on the bond market as banks hedge themselves in anticipation of buying a lot of this debt. The Fed should be relatively quiet as they enter their pre-FOMC blackout period. The next Fed meeting is March 16-17th.
We have been outspoken about equity valuations, so instead of beating on the same drum, we thought it might be helpful to share a message from our friend Eric Cinnamond, small-cap equity portfolio manager and owner of Palm Valley Capital Management (PVCMX). Per his note:
“Small cap stocks have been on a wild ride over the past year. We’ve been managing small cap portfolios for nearly three decades, and frankly, we’ve never seen anything like it. After declining 40% from its early 2020 highs, the Russell 2000 has increased 130% from March 2020 to February 2021! Based on current valuations, we believe our opportunity set has never been more expensive and risks never this elevated. Therefore, finding value in the current small cap market has become extremely challenging.”
January Consumer credit data released this afternoon continues to show declining credit card balances (revolving debt) and increasing non-revolving debt such as student loans and auto loans. Total consumer credit is slightly lower than last year. Non-revolving debt makes up about 75% of total consumer credit, yet a nearly 3.75% gain was not enough to counter an 11.60% decline in revolving debt. Seemingly, like most other economic data, trends are unlike what we were accustomed to prior to COVID.
The BLS Employment report was much stronger than expected at +379k jobs versus 49k last month and a consensus estimate of +175k. The U3 Unemployment Rate fell from 6.3% to 6.2%. Hourly earnings were up 0.2%, up from 0.1% last month. The only concerning piece of data in the report was hours worked fell from 35 hours per week to 34.6.
Stocks are rallying on the good news but bonds are selling off. The 10-year yield is back up to 1.60%, its high point from last week.
The graph below, courtesy of Brett Freeze, marries hours worked, the number of employed persons, and hourly earnings to produce an aggregate estimation of total income. As shown, the index fell for the first time since the recovery started. One month does not make a trend but his estimate bears watching.
Per the chart below from Gavekal, stock investors betting on inflation may want to rethink their strategy if inflation is truly to take hold. If you fall into this camp you should consider concentrating bets in sectors that benefit from rising prices and avoid most other sectors. Passive/Index investing strategies are likely to disappoint if inflation is not transitory.
Overnight repo rates on ten-year Treasury notes have been trading in negative territory. Essentially, the repo market is where those holders of bonds can lend bonds overnight to those that are short bonds. This them to make good on their short and deliver bonds to the entities they shorted bonds to. When a repo rate trades negative it means the supply of bonds being lent in the repo markets is scarce. The combination of aggressive Fed buying and aggressive short selling by investors is a key contributor to this problem.
The issue can resolve itself in a number of ways as listed below:
Similar to GameStop, the shorts get squeezed by onerous overnight borrowing rates and cover their shorts.
Treasury yields start falling and short investors cover their positions. Given a large number of short positions outstanding, this could cause a sharp move lower in yields.
The Treasury will auction new ten-year notes next Wednesday which will should help alleviate the supply problem.
The Fed can lend their ten-year notes to the repo markets and normalize the lending rate.
The Fed shows concern for higher interest rates, which they have yet to do. This would result in short traders covering their positions on concerns the Fed will do “Operation Twist” or commit to buying more longer-term bonds.
March 4, 2021
Jerome Powell spoke and the bond market wasn’t thrilled. The ten-year UST is now trading back above 1.50%. Bond investors were hoping for some discussion on Operation Twist or at least heightened concern about rising rates. Instead, it appears he is comfortable with rising rates to some degree, as long as they rise in an orderly fashion. Stocks reversed gains and are trading weaker in sympathy with bonds.
“The rise in rates caught my attention”
“I would be concerned by disorderly conditions or a persistent tightening in conditions that threatens our goals”
“If we do see a transitory increase in inflation I expect we will be patient”
Crude Oil is trading over 5% higher this morning at just under $65/barrel on news leaks that OPEC will not boost production by 500,000bpd in April as was widely expected. It is also rumored that Russia will be granted an exception allowing them to increase production by 130kbpd. The price of oil has fully recovered from the losses of the past year. As of noon, XLE is leading the market higher, up 3.5% on the day.
The number of weekly job layoffs remains high. Initial Jobless Claims for the week were +745k, up slightly from 736k last week. The Challenger Job-Cut report, measuring mass corporate layoffs was only 34.5k, down from 79k last month. Based on the recent trends in these two data sets it appears that smaller businesses account for the large chunk of weekly layoffs.
The graph below shows the number of weekly state and Federal jobless claims show no improvement since last Fall.
Fed Chairman Powell will speak at noon ET today. It’s likely that he will reiterate recent comments made by Fed Governor Lael Brainard. On Tuesday she said the recent surge in bond yields is being monitored and that she would be concerned by disorderly conditions in the bond market. She also said the Fed is not close to reaching its employment and inflation goals. To that point, she quoted the U6 unemployment rate of nearly 10%, not the more popular U3 rate at 6.3%. She also reminded us that inflation has been running below its target for nearly a decade.
We have little doubt Powell will once again say current inflationary pressures are temporary and he wants to see inflation above target for a period of time before the Fed even talks about changes to monetary policy. We think the odds of Operation Twist are increasing and will be on the lookout for any mention of it in his speech. We will share more on the Twist and what it may mean for bond and stock markets in an article next week.
March 3, 2021
After consolidating for a few days, bond yields are heading higher once again. Of concern to the equity markets are the 5, 7, and 10-year sectors. These sectors, most affecting the economy, are leading today’s charge higher. 10-year notes eclipsed the 1.50% yield on February 25th but quickly fell back below that level. This morning they are again approaching that level. Sustained trading above 1.50%, points to 1.75% as the next line of resistance.
The ADP employment report was weaker than expectations at +117k, versus expectations of +165k and a prior month reading of +174k. The report will put some downward pressure on expectations for Friday’s BLS employment reports.
The MBA mortgage purchase and refi indexes stabilized this past week, after falling sharply with higher yields over the prior few weeks.
Fed Governor Lael Brainard acknowledged the Fed is paying attention to the recent volatility in the interest rate markets. Per the New York Times: “I am paying close attention to market developments — some of those moves last week and the speed of those moves caught my eye,” Ms. Brainard said, speaking at a Council on Foreign Relations webcast. “I would be concerned if I saw disorderly conditions or persistent tightening in financial conditions that could slow progress toward our goal.”
Materials and energy have been the hottest sectors over the last few months as investors’ concern for inflation rises. The graph below, courtesy of Jim Bianco, shows that the Goldman Sachs Commodity Index (GSCI) is already up over 16% this year and the second-best start to year since at least 1973. The highest annual return over this period was 50%, so if the inflation theme holds up throughout the year, the trend may have a ways to go.
March 2, 2021
Per Fox News, Democrats are pushing Biden to make stimulus payments to individuals recurring. If the proposal gains in popularity, we might see the dollar fall and bond yields head north. Turning one-time stimulus into what essentially is universal basic income (UBI) would not only add further to the massive deficit but produce more inflationary pressures.
The graph below, courtesy of Axios Markets, shows the battle between clean energy stocks (ICLN -ETF) and oil producers (XOP – ETF). While the divergence in performance over the two periods is stark, the reality is that many companies in the XOP ETF are investing massive amounts of money in clean energy. Either, XOP is catching up to clean energy as the market finally recognizes their investments, or it considers them direct competitors and the higher price of oil is winning 2021 for now.
The graph below, courtesy from an American Banker article entitled CRE lenders’ growing fear: Office workers won’t come back, shows the huge decline in net office space usage. This should not be surprising given the shutdowns due to COVID. The big question when looking forward, in regards to the health of commercial real estate, is how predominant will the shift to “work from home” be?
Yesterday, the ISM (manufacturing) Prices Paid Index hit a ten-plus year high of 86. As shown below, the index has a strong correlation with CPI and tends to lead it by 3 months. If CPI follows ISM’s lead we may be looking at CPI running over 3% this spring. One of the drivers of higher prices is order backlogs. The Backlogs Index, within ISM, is at its highest level since 2004. Further opening of the economy should help alleviate the backlogs (supply line problems) and in theory, reduce pricing pressures.
The graph below, courtesy of the New York Times, shows that the number of houses for sale is running less than half of what has been normal. Coupling the limited supply with sharply lower mortgage rates makes the double-digit increase in house prices more understandable. If mortgage rates keep rising and higher prices bring more supply to the market some of the recent price increases may moderate or possibly decline slightly.
The Reserve Bank of Australia (RBA) was the first central bank to show concern about steeply rising interest rates. Last night they bought $4 billion of longer-term maturity bonds. The amount was more than double the amount they had been buying. The yield on their 10-year bond fell 27 basis points as a result. In a Bloomberg Article, Eric Robertson (Chief Strategist- Standard Chartered Bank) summed up the problem facing the world’s central bankers well. To wit- “The RBA is in the same camp as every major central bank — they want their economies to recover but they’re more and more dependent on low-interest rates.”
On Friday, the Chicago Area Purchasing Managers report showed continued expansion in the manufacturing sector but at a slightly slower rate than in January. This week, the ISM survey is expected to show a similar decline in the manufacturing sector’s expansion from 59.2 to 58.5. The prices sub-component, which will garner a lot of attention, is expected to fall from 82.1 to 75. If that holds up, it means there are fewer of those surveyed seeing rising input prices than those surveyed last month.
Importantly this week will be key for employment data. On Wednesday, ADP is expected to show tepid job growth of +155k jobs as compared to +174k last month. The BLS jobs report will be released on Friday. We will have a summary of expectations before then.
Currently, the yield spread between high-yield corporate bonds and Treasury bonds is at its lowest levels since 1989. Typically such low levels occur 3-4 years after a recession when economic growth tends to peak. Given we are achieving these levels in the midst of a recession and yields rising rapidly, we offer caution for those holding high yield bonds.
As shown below, Personal Income was up 10% last month. The increase is entirely due to the latest round of stimulus checks. The graph to the right shows that Personal Income actually fell 2% last month when transfer payments (government checks) are excluded. The PCE price index is the preferred inflation index for the Fed. As shown in the table there is little reason for concern.
2/25/2021 Fed’s Bullard: “The rise in bond yields is a good sign so far.”
Fed’s Esther George “LONG-TERM YIELD RISE DOESN’T WARRANT MONETARY RESPONSE”
*FED’S BOSTIC SAYS `I AM NOT WORRIED’ ABOUT MOVE IN YIELDS
*BOSTIC: FED DOESN’T NEED TO RESPOND TO YIELDS AT THIS POINT
Jerome Powell, Jim Bullard, Esther George, Raphael Bostic, and other Fed members are steadfast in their determination to use an excessive amount of monetary stimulus to promote inflation and growth. The reflationary trade and weak dollar over the last few months are confirmation that investors believe the Fed is making headway toward its goals.
The problem is that bond investors also believe they are making progress. On Tuesday and Wednesday, Jerome Powell said, in no uncertain terms, he is not concerned about inflation and will keep the monetary pedal to the metal. The quotes above show a level of comfort with rising interest rates as well. These are all good reasons for bond investors to keep selling.
Selling in the bond market became problematic this week as yields in the economically sensitive 5 and 7-year sectors rose precipitously, as shown below. Prior to this week, it was 10 and 30-year bonds taking the brunt of selling activity. The shorter, intermediate sectors largely determine mortgage, corporate, and auto borrowing rates. They steer economic activity. While the Fed is running uber-easy monetary policy, the market is increasingly imposing tighter monetary conditions.
The Fed has a choice, they can watch bond yields rise, to the detriment of economic growth and ultimately inflation, or they can walk back monetary policy. Doing so requires them to taper QE or talk about raising rates. Either action can pose problems for the equity markets which rose to record valuations on the tailwind of easy monetary policy.
To put it bluntly, the Fed is walking into a trap where, at some point, they will be forced to decide between rescuing the bond market or the stock market.
February 25, 2021
The sell-off in bonds is worsening as it appears the Fed is comfortable with yields rising. At the peak of the decline today, the yield on the 5 year UST was up .25%.
2/25/2021 11:55am – Fed’s Bullard: “The rise in bond yields is a good sign so far.”
Today’s sell-off in bonds is a little more problematic than we have seen, as yields are rising the most in the intermediate maturities (5-7 years). These maturity sectors have the largest effect on economic activity. We will have a complete write-up on this and what it may mean for the Fed in the morning.
Economic data was strong this morning. Initial Jobless Claims fell sharply to 730k versus estimates for 845k. The previous week saw 841k new people file for claims. Claims data has been volatile the last few weeks. Durable goods orders were also better than expected at +3.4% growth, more than triple expectations for 1.1% growth. The gains came largely from defense and airplanes. Excluding those two sectors, durable goods rose 0.5% versus expectations for a gain of 0.8%. Durable goods are now back to pre-COVID highs.
The total return on the 30-year U.S. Treasury bond has only started a year worse than 2021 twice, 1980 and 2009. 2009, like today, marked a period with massive fiscal and monetary stimulus and economic recovery. At that time, many investors were concerned that QE, new at the time, was inflationary. If 2009 is the correct analog for bonds, we may only be in the mid-innings of the current bond rout.
As shown below, rising interest rates are not just a U.S. phenomenon. It will be interesting to see which central bank flinches first about higher interest rates.
One of the biggest macro questions facing the equity markets is how much more can it increase alongside rising bond yields. The 10-year yield graph below helps put some context to the question. The gray shaded area represents a likely answer. The problem, however, is the band is wide- it ranges from current levels of 1.40% to 2.00%. The vertical dotted lines represent the last three times that yields were as overbought (RSI and MACD) as today. In two of the three instances, yields fell. In the 2018 period, yields consolidated for six months, and then rose before triggering another strong signal in which yields fell from 3.20% to .40%. The equity market seems increasingly nervous with each tick higher in bond yields. Might a round number like 1.50% or 1.75% be the yield that reverses the trend in equities?
February 24, 2021
Just when you thought the GME saga was over it reappeared. GME closed at $91.71 up 104% on the day and another 50% to $137 after-hours. Call option volume was massive. We shall see if AMC, BBBY, and others caught in the prior short squeezes follow suit.
The chart below of the Dow Jones, annotated by Sven Henrich, affirms our view and the market’s view that Powell is comfortable with more inflation. The Dow has more exposure to companies that benefit from inflation, than the S&P and NASDAQ. Accordingly, it has done well after his two speeches to Congress this week.
A few notable quotes from Chairman Powell at today’s Congressional testimony:
“Could Take More Than Three Years To Achieve Inflation Goal”
“Some Asset Prices Appear Elevated”
*POWELL SAYS THIS WILL BE THE YEAR IN WHICH THE FED ENGAGES WITH PUBLIC ON DIGITAL DOLLAR
*POWELL: U.S. HAS 10 MLN FEWER PEOPLE WORKING THAN A YEAR AGO
Like yesterday, the Chairman appears to believe there is no significant inflation pressure and the jobs market is worse than is commonly believed. As such, he remains intent on continuing monetary stimulus at its current pace until jobs and inflation are closer to their objectives.
One of the bright spots in the recovery has been housing. To wit, new home sales, reported this morning, was 923k, well above expectations for 855k. That compares to 700k before the recession and a low of 570k last spring. If rates keep moving higher the housing party may come to an end. On a weekly basis, the Mortgage Bankers Association (MBA) puts out a gauge on mortgage activity. As shown below, higher rates are resulting in a decent drop in both new purchase activity as well as refinancings.
A few subscribers asked why the possibility of inflation has begun to weigh on the Tech sector. The answer is two-fold. First, many tech companies are heavily leveraged and dependent on debt to develop new products and achieve their growth targets. As inflation increases so do interest rates. With it, their cost of borrowing increases and effectively reduces their financial leverage.
Second, higher rates of inflation reduce the expected real (after inflation) returns on new investments. For more on this concept, we lean on a Warren Buffett article from 40 years ago. As you read it, keep in mind, inflation today versus 1980 is much lower. But, in some people’s opinions, it could break through the upper range of the last decade and become more problematic. The Buffett quote below comes from a tweet from Michael Burry. Burry was made famous for his role in the movie/book The Big Short. He has recently been vocal about the potential for hyperinflation.
February 23, 2021
**POWELL SAYS DOES NOT SEEM LIKELY THAT INCREASE IN SPENDING WOULD LEAD TO LARGE OR PERSISTENT INFLATION
The Fed continues to believe a boost in economic activity will not lead to inflation. The interest rate markets and, more recently, the stock market are getting increasingly nervous that the Fed is wrong.
Yesterday the Dow Jones was slightly higher while the S&P and NASDAQ sold off decently. Those trends, as shown below, are continuing in the overnight session. Also of note, crude oil was up sharply yesterday and trading higher again today. Gold and silver also traded well. Based on the winners and losers, the rotational trade appears to be inflation-based, therefore the Dow, with more exposure to energy, materials, and financials outperformed. The second chart shows yesterday’s gains and losses by sector.
As interest rates rise and inflation perks up, the market is anxiously following the Fed for any signals they might start to lean toward a more hawkish policy stance. The graph below charts Fed Funds futures over the next three years. As implied by the market, traders believe there is only a 66% chance the Fed raises rates 25 basis points by the end of 2023. The odds of a rate hike do not even begin to increase until early next year. For now, the Fed has made it clear they will let inflation run hot and higher rates are not bothersome to them. Changes to this graph over the coming weeks and months will allow us to monitor if the market continues to believe the Fed or starts to call their bluff. Fed Funds futures data can be found at the CME.
Typically investors buy gold mining stocks because they think the price of gold will increase, and miners are effectively a leveraged play on gold. Gold miners are businesses and regardless of the price of gold or its prospects, we must always consider valuations. The graph below shows that even though gold miners and the price of gold have risen nicely over the last year, gold miner valuations are well below any point in the last 7 years. Even if the price of gold declines marginally, miners still offer value.
February 22, 2021
As Bitcoin surges it is grabbing the attention of central bankers and governments. For instance, Treasury Secretary Janet Yellen was interviewed by CNBC this morning and stated: “To the extent it is used I fear it’s often for illicit finance. It’s an extremely inefficient way of conducting transactions, and the amount of energy that’s consumed in processing those transactions is staggering.” We expect more government officials to come out against BTC as it represents competition to fiat currency. If governments can not control their currency they can not conduct monetary or fiscal stimulus effectively, thus BTC or some other crypto-currency reduces their power.
As shown below, rising interest rates are not just confined to the U.S. Over the last few months, the amount of negative-yielding debt worldwide, mainly in Europe and Japan, has fallen by over $4 trillion.
The Fed takes center stage this week with Jerome Powell testifying to Congress on Tuesday and Wednesday. We presume he will push for more fiscal stimulus and promise to keep monetary stimulus flowing. As we have been doing, we will continue to look for signals he is concerned about higher interest rates or inflationary pressures. Based on his comments and those from other Fed speakers we are not expecting any surprises. There are a host of other Fed speakers this week including Vice Chair Clarida on Wednesday.
On Tuesday Case-Shiller and FHFA will release their home price indexes. Both reports should show annual gains in the 10% area. On Friday the BEA will report Personal Income and Spending, as well as the PCE price index. This inflation gauge, used in the GDP report, is the Fed’s preferred source for monitoring inflation. The index is expected to rise 1.5% versus 1.3% last month. While higher, it would not be worrisome for the Fed or confirm inflationary pressures as we are witnessing in consumer and manufacturing surveys as well as in commodity prices.
The chart below quantifies how sharp the recent interest rate increase has been. Weekly TLT prices, representing 20-year UST bonds, are shown in blue and its 20-week rate of change (ROC) overlays it in orange. Over the last 20 weeks, the price of TLT has fallen by 13%. We highlight five other periods with similar declines over the last 15 years with blue dotted lines. Excluding the instance in 2009, the four other periods, with similar negative ROCs, resulted in higher prices shortly after the indicator troughed. We believe that will be the case this time as well, but the million-dollar question is when/where will the ROC trough.
The real estate market continues to do very well with Existing Home Sales growing 0.6% last month and over 23% versus January of 2020. With little supply on the market, home builders are very active. Housing Start Permits, released yesterday, were 1.881 million units (annualized), about 200k more than expectations. The prices of raw commodities used in housing, particularly lumber and copper, have been soaring. It will be interesting to see if the housing market stays hot enough through the spring and summer, allowing home builders to fully pass on these costs.
“No matter how risky I find sentiment/valuation indicators and how certain I am that I am “right” about this longer-term, I believe in trying to make money that one must follow the weight of all the indicator evidence.” -Ned Davis
The quote from Ned Davis appropriately describes our current portfolio management psyche. We fully understand that equity valuations, as we frequently show, are at or beyond the record levels of 1929 and 1999. When looking out over longer time frames periods, high valuations are always met with long periods of low or even negative returns. However, we also know that valuations are a poor market-timing tool.
There are many factors that account for the market’s ascent higher. Whether we think they are valid or not is irrelevant. As such, we must understand and quantify these factors and make them a part of our analysis. Currently, have a quick trigger finger as the long-term risk/reward is poorly skewed, but at the same time hold positions for the short term that we expect to do well under the current regime.
February 18, 2021
Initial Jobless Claims popped back up to 861k from 848k last week. If you recall the number of claims dropped sharply to 793k last week. It was revised in today’s report to 848k. On the positive side, the number of claimants for Federal assistance fell from 7.9mm to 7.7mm.
The merits of Bitcoin as a currency are hotly debated in financial social media outlets. To be a legitimate currency, a currency must be able to be a medium of exchange. The following comments, from Eric Holthaus, provide context to the question of whether it’s possible for Bitcoin to become a widely used currency.
“Bitcoin uses 0.5% of the world’s electricity on just 350,000 daily transactions. At that rate, Bitcoin would require 14x of the world’s electricity to replace all daily credit card transactions. Bitcoin is not just inefficient, it’s actively anti-efficient.“
Yesterday, in no uncertain terms, the Fed minutes claimed that the recent increase in prices is transitory. The chart below, from Julien Bittel at Pictet Asset Management, adds some historical credence to their logic. As he shows, the annual change in the Bloomberg Commodity price index tends to closely follow the change in the ISM Prices Paid Index. The ISM Prices Paid index is currently at 82, which is not far off from its recent 15-year high. The Index is a survey that quantifies what percentage of purchasing managers saw prices rise in the current month versus last month. Julian points out that the index hit 90 in 2008 and tumbled. Commodity prices followed, falling 53% in the next 6 months. The dotted green line projects what that may look if the spike in the survey proves again to be short-lived.
With interest rates ticking up it’s worth revisiting the relationship between mortgage rates and home affordability. To quantify the relationship we turn to an article we wrote in 2018- The Headwind Facing Housing.
When we wrote the article, interest rates were moving higher, resulting in higher mortgage payments for new homeowners and weaker home sales. 30-year mortgage rates were 4.50% at the time. As shown below, a 4.50% mortgage affords a buyer a $500,000 house with a mortgage payment of $2,333.
With current mortgage rates at 2.50%, the same $2,333 payment allows a buyer to purchase a home worth $641,000, 28% higher. The recent 10% increase in home prices is predominately due to the substantial decline in mortgage rates. The problem facing the housing markets today is mortgage rates have a limited ability to decline and spur house price increases. Further, any sustained increase in mortgage rates has the reverse effect on affordability and will weigh on home prices and sales.
February 17, 2021
**Due to the blackouts in Houston, we aren’t able to record Three Minutes on Markets & Money. We hope to be up and running shortly.
The following quote, from today’s release of the FOMC’s minutes from the January meeting, tells us in no uncertain terms that the Fed is not worried about inflation and considers any uptick inflation to be transitory.
“Many participants stressed the importance of distinguishing between such one-time changes in relative prices and changes in the underlying trend for inflation, noting that changes in relative prices could temporarily raise measured inflation but would be unlikely to have a lasting effect.”
The Atlanta Fed revised their Q1 GDP forecast higher from 4.5% growth to 9.5% annualized growth as shown in the first graph. Personal Consumption accounts for about two-thirds of GDP, so with today’s great retail sales data, the upward revision should not be surprising. The bulk of the increase came from consumer spending as shown below in the Fed’s supplemental bar chart showing changes to the forecast.
Retail Sales blew the doors off of expectations rising 5.3% versus expectations of a 1.1% gain. Excluding auto and gas sales they rose 6.1%. PPI was also much higher than expectations at +1.3% versus +0.4%.
Both releases point to an increase in economic activity and reflation. Stocks are slightly lower on the news, in part because it signals the Fed may be closer than they acknowledge to tapping on the monetary brakes. Again, we will listen closely to the Fed speakers this week for any signs that they are concerned about higher rates or inflation.
The FOMC minutes from the Fed meeting 3 weeks ago come out at 2 pm. It will be interesting to see how they edit minutes to reflect recent data.
This is a follow-up to yesterday’s discussion on the recent increase in intermediate-term yields. The graph below compares the popular investment-grade corporate ETF (LQD) versus the S&P. They closely followed each other through the February swoon and recovery over the last year. However, as circled in blue, the two are beginning to diverge. This divergence will become increasingly important to watch if yields keep on rising. We suspect higher intermediate and long-term yields will begin to hamper the upward momentum of the stock market.
The latest chart to show extreme market conditions comes courtesy of All-Star Charts. As shown, the number of new (record) highs on the NASDAQ and S&P 500 is well above the prior market peaks of 1999 and 2007.
February 16, 2021
Stocks gave up large gains this morning as bond yields continue to climb. Longer maturity yields have been rising for a while, but we are starting to see intermediate-term yields rise as well. Mortgages and corporate debt tend to be heavily concentrated with durations of 3 to 7 years. As such, further increases in intermediate yields will begin to dampen the economic recovery. It’s likely the market will continue to push on the bond market until the Fed cries uncle or the recovery shows signs of faltering.
The record cold snap, crippling Texas and the Plains states is causing a spike in energy usage resulting in rolling blackouts in many parts of Texas. As a result, natural gas is opening this morning up 6% from Friday’s close and is about 30% higher than late January levels. The unusual cold is also forcing some refineries to shut down which will result in less refined products, like gasoline. Gas is set to open up 4% this morning to $1.71 a gallon. It started the month at $1.56.
Tomorrow is shaping up to be a busy day on the economic front, with PPI and Retail Sales due out at 8:30. Retail Sales are expected to grow following three straight months of declines. Like CPI last week, PPI is expected to be in line with last month’s figures which do not point to inflationary pressures. Given PPI measures raw commodities and input prices for manufacturers, we should expect PPI to uptick before CPI takes hold.
Later in the day, the Fed will release the minutes from their January meeting. The Fed may take this opportunity to clarify or stress its stance on inflation, the labor market, higher interest rates, or monetary policy. We will also look for any mention of the drawdown of Treasury’s cash balances and the effect it will have on short term yields. For more please read our latest Can The Fed Both Tap On The Brakes And Floor The Gas? There are numerous Fed speakers throughout the week that may also shine a light on the Fed’s current thinking.
A slew of housing data will be released Thursday and Friday.
**U.S. Markets will be closed on Monday in observance of Presidents Day
The graph below shows investors’ recent preference for risk. Relatively safe S&P volumes sit near four-year lows, while much risker options and penny stock volumes are multiples of prior norms.
The graph below shows that 5-year UST yields have risen from .36% to .45% since January first. Over the same period inflation expectations rose 36 basis points from 1.95% to 2.31%. As a result, 5-year real yields fell 27 basis points and stand at -1.86%.
The University of Michigan Consumer Survey points to continued weakness in sentiment, falling from 79 to 76.2. Consumers may be worrying about their purchasing power get squeezed due to inflation. Inflation expectations rose from 3 to 3.3%. Inflation expectations are now at the highest level since 2014.
In February 2019 we wrote MMT and its Fictional Discipline. The intent was to show how inflation, the regulator for MMT spending, is a flawed indicator and easily manipulated. In the article, we provide housing inflation as one example. To wit: “In 1998, the Bureau of Labor Statistics (BLS) changed the way they calculated real estate prices within CPI. The BLS replaced an index based on actual home prices with what is now called owner’s equivalent rent (OER). OER is a rental equivalence that calculates the price at which an owned house would rent.”
Since 2019, OER has risen 5.12% while the Case-Shiller Home Price Index (CS) is up 13.73%. OER comprises nearly a quarter of the CPI calculation. The graph below replaces OER with the CS Index in the CPI calculation to show how inflation is understated due to the sharp divergence between actual home prices and the BLS methodology to impute home prices. Per the graph, CPI would be 2.62% and rising, versus .96% and trending lower. The low CPI reading provides cover for the Fed to keep printing, but at what cost?
February 11, 2021
We constructed the graph below to impress upon you the horrific weekly initial jobless claims data. As shown in red, instances of more than 600k people losing their jobs in any week are few and far between. In five weeks we will more than likely have a full year of weekly job losses north of 600k.
Weekly Initial Jobless Claims continue to show little improvement. Last week, 793k new people filed for jobless claims, down slightly from 812k (revised higher since last week) and 33k above the expectation of 760k. Including Federal unemployment programs, the number is over 1 million. It’s hard to see how we get much improvement in the monthly BLS employment data with this weekly indicator of the job market stuck at current levels.
Bill Dudley, ex-New York Fed President, wrote an editorial in Bloomberg in which he appears to side with Lawrence Summers in offering caution to Jerome Powell. Importantly, he is concerned the Fed will continue to keep monetary stimulus running at full blast while inflation runs hotter than the Fed expects. To wit: “…the Fed, despite its desire to be accommodative and boost employment, might have to pull back on stimulus sooner and with greater force than anticipated to keep inflation in check.”
To say interest in equity trading has upticked over the last year is a gross understatement. The graph below, courtesy of Crescat, shows share volume on the NASDAQ exchange is over four times greater than what was normal over the prior 25 years.
After showing the speculative excesses in the junk bond market yesterday we thought we would pile on today with SPACs and small-cap stocks.
The data below, courtesy of Charlie Bilello, shows that SPAC (Special Purpose Acquisition Companies) issuance is off the charts. These risky investments, also known as blank check companies, are essentially public investments in investment managers seeking to buy non-public companies. Former sports stars Alex Rodriguez and Shaquille O’Neal are now issuing SPACs if that tells you anything about the burgeoning demand for SPACs.
US SPACs- IPO capital raised…
2013: $1 billion
2014: $2 billion
2015: $4 billion
2016: $3 billion
2017: $11 billion
2018: $9 billion
2019: $13 billion
2020: $83 billion
2021 YTD: $38 billion (a billion a day)
Since March 23, 2020, the small-cap Russell 2000 Index has been on a tear, up over 130%. As shown below, the index now sits 36% above its Pre-Covid highs and at a 40% premium to its 200-day moving average. The Index may certainly keep defying historical norms, but we urge caution as it severely deviates from its 200-day moving average.
The next graph shows that the surge in the Russell 2000 occurred despite a fundamental basis. Accordingly, current valuations using the measure below are now well above prior highs.
February 10, 2021
Based on today’s speech at the New York Economic Club, Jerome Powell has no intentions of easing up on monetary policy. Here are two takeaways that lead us to that assumption:
“After rising to 14.8 percent in April of last year, the published unemployment rate has fallen relatively swiftly, reaching 6.3 percent in January. But published unemployment rates during COVID have dramatically understated the deterioration in the labor market. Most importantly, the pandemic has led to the largest 12-month decline in labor force participation since at least 1948.”
“Our January postmeeting statement on monetary policy implements this new framework. In particular, we expect that it will be appropriate to maintain the current accommodative target range of the federal funds rate until labor market conditions have reached levels consistent with maximum employment and inflation has risen to 2 percent and is on track to moderately exceed 2 percent for some time.”
As shown below, CPI was at or slightly below consensus expectations as well as last month’s readings. Also of note, China reported its CPI fell 0.3% year over year. This is a deflationary pressure on the U.S. given the large number of goods we import from China.
Yesterday we noted that Barclay’s junk bond index fell below 4%. Last night Zerohedge put out an excellent article – Never Seen Anything Like This – on the “buying spree” in the high yield arena. The chart below, in particular, caught our attention. It shows the spread of the junk bond index to U.S. Treasuries is near its lowest levels in at least the last 25 years. At the same time, the amount of leverage/debt being taken on by the underlying companies is soaring. Simply, the ability to pay off the debt is becoming troublesome, yet, investors are settling for less yield.
Dear Mr. Powell, this is another of many market dislocations signaling that a zero interest rate policy warps investor mindsets.
Jerome Powell will speak and take questions at the New York Economics Club this afternoon. It will be interesting to hear his take on rising inflation expectations and the recent speculative antics pushing markets higher. In particular, we are on the lookout for any discussion around the coming reduction in Treasury cash balances. For more on the Fed’s coming dilemma, this morning we published Can The Fed Both Tap On The Brakes & Floor The Gas?
Yesterday, we wrote about Lawrence Summer’s concerns over a consumption-driven, stimulus plan. Will Powell opine on his preferences for fiscal stimulus? Keep in mind, Powell and the Fed will have to reduce QE and possibly raise rates if a big stimulus plan generates too much inflation, per Summer’s warning.
February 9, 2021
The Barclays U.S. Corporate High Yield (junk bonds) Index dipped to 3.96% after six straight days of yield declines and it now sits below 4% for the first time ever.
January’s NFIB Small Business Optimism Index fell to 95 versus 95.9 in December. Despite other surveys of larger companies pointing to optimism, an important sub-component of the NFIB survey shows that expectations for better business conditions hit their lowest level since 2013. 8% of the employers surveyed think now is a good time to expand and only 17% anticipate job creation. This jibes with the Paychex small business employment report we showed on February 5th and recent consumer sentiment surveys.
Biden’s fiscal stimulus plan is getting pushback from within his own party. Lawrence Summers, a strong voice in the party, is arguing that Biden needs to be thoughtful in assessing the size of the fiscal stimulus package but equally importantly, how the money is spent. In a recent Washington Post Editorial, Summers argues that Biden’s current proposal, which is not only massive in dollars but focused heavily on current consumption, carries big risks that may cause more harm than good. To wit:
“First, while there are enormous uncertainties, there is a chance that macroeconomic stimulus on a scale closer to World War II levels than normal recession levels will set off inflationary pressures of a kind we have not seen in a generation, with consequences for the value of the dollar and financial stability.”
The corporate earnings calendar is slowing down but there are still quite a few earnings announcements slated for this week.
February 8, 2021
Dogecoin is the latest crypto craze, having doubled in price over the last few days as Elon Musk tweeted its name. The following LINK to a WSJ article discusses this particular currency. The article will help to appreciate some of the absurdity behind what is going on in the crypto markets.
30-year U.S. Treasury yields eclipsed 2% this morning before falling back, as 10-year implied inflation expectations rose to a seven-year high of 2.21% and Brent Oil popped above $60 a barrel. The big question for equity markets is how long will the Fed sit quietly by and ignore mounting inflationary pressures? Jerome Powell will speak on Wednesday and we will be on the lookout for any clues he mentions regarding inflation.
From Tesla’s 10-K SEC filing “.. we invested an aggregate $1.50 billion in bitcoin under this policy and may acquire and hold digital assets from time to time or long-term. Moreover, we expect to begin accepting bitcoin as a form of payment for our products in the near future ..”
Inflation data takes center stage this week with the January CPI scheduled for Wednesday morning. Current expectations are for no change from December. Chairman Powell is scheduled to speak at 2 pm on Wednesday. The Treasury will auction $41 bn 10 year notes on Wednesday and $27 bn 30 year bonds on Thursday. Both auctions are the same size as the prior month. All else equal, the auctions will likely weigh on bond yields in the early part of the week.
We stumbled upon this interesting graph over the weekend. Neal Falkenberry, its creator, plots the popular valuation ratio of Enterprise Value to Earnings (EBITDA) in gray. The red line, corresponding to the inverted y-axis on the right side, shows what the following ten year annualized returns were for each instance of the valuation. For example, in 2000 the ratio peaked around 14, and the future returns over the next ten years were near zero. Currently, the valuation ratio is near 20. If the correlation holds up, the strong correlation portends horrendous returns for the next ten years. Valuation ratios are poor timing tools but over the longer term, they do a good job of predicting returns.
The graph below, courtesy of Brett Freeze shows that consumer borrowing continues to decline, led by a sharp decline in revolving credit.
This morning the two-year U.S. Treasury yield matched its record low from March 2020 of .10%. The yield on the one-month Treasury bill is trading 4 bps lower to 0.03%. At the same time, longer-term yields continue to leak higher as shown below. As we have discussed, the U.S. Treasury will sharply reduce Treasury debt issuance over the coming months. The greatest effect should be in the Treasury Bill sectors. The implications for this coming wave of liquidity will have implications for the markets. We will have more on this in an upcoming article.
The BLS employment report was a mixed bag. The headline number was right on consensus with a +49k gain in payrolls, however, last month was revised from -140k to -227k, and November was revised lower by 72k jobs. The unemployment rate fell nicely from 6.7% to 6.3%, but some of the gains were attributable to a smaller workforce as the participation rate fell from 61.5% to 61.4%. As a point of reference, it was over 2% higher than before COVID. Average hourly earnings were concerning as they only rose 0.2% versus 1% last month. That said, the average workweek rose to 35.0 hours versus 34.7 last month.
In prior Januarys, the economy typically loses between 2.5 and 3 million jobs as temporary holiday workers are let go. The BLS employs seasonal adjustments to account for this. Given that the number of temporary holiday employees was much less than normal in 2020, the number of firings should also be much less than normal in January. If they do not adjust properly reduce the adjustment, we could see a large payroll number today, purely due to this seasonal adjustment quirk. The current expectation is for a gain of 50k jobs. The range of estimates is -250k to +400k.
Earlier in the week, we pointed out that employment seems to be picking up in large manufacturer businesses. As the chart below shows, courtesy of Paychex, smaller businesses that account for more than half of employment continue to struggle.
Initial Jobless Claims fell to 779k, which is the lowest level in nearly two months. The problem is that there are still nearly 18 million people collecting unemployment benefits as compared to 2 million pre-COVID.
There was a sharp 4.8% decline in fourth-quarter productivity which is the worst since 1981. At the same time, unit labor costs accelerated to +6.8%. The data points to sharp margin contractions for corporations, however, this economic data and most data remain volatile. The effects of COVID-related lockdowns and massive stimulus continue to make data difficult to assess.
Short squeezes are all the rage these days, but as shown below there is little fodder to keep the antics up. The median short-interest ratio is now at levels last seen in the days before the dot.com bubble popped.
The following headline hit the wires from a speech from Fed Governor Evans -*EVANS: CRITICAL FOR FED TO SEE THROUGH TEMPORARY PRICE INCREASE.
Essentially he states that price increases we are seeing today are temporary, related to warped supply lines, changing consumption habits, and the opening up of economies. He may be correct and the Fed would be best served to ignore them. However, if he is wrong and inflation proves not to be transitory, the Fed will be forced to aggressively remove stimulus. As a reminder, valuations sit at record highs. Gains over the last nine months are almost solely attributable to massive monetary and fiscal stimulus. Removal of said stimulus would likely have the opposite effect.
We present a piece of bullish technical analysis from Troy Bombardia as follows:
Breadth thrust: NASDAQ Up Issues Ratio exceeded 74% for 2 days in a row. Historically, this almost always led to more gains for stocks over the next 3-12 months. NASDAQ up an average of:
+5.5% 3 months later
+12% 6 months later
+15% 9 months later
+19.4% 12 months later
February 3, 2021
After a short break, longer-term Treasury yields are resuming their march higher. The 30 year UST bond, shown below, is quickly approaching 2%. Weighing on yields are rising inflation expectations, a heavy supply of new issuance coming, and prospects for significant deficit spending in 2021. The Fed has yet to balk at higher rates, so barring any significant changes to economic activity or stress in the financial markets we must respect the move higher. At some point, however, higher yields will drag on economic growth and the Fed will likely take actions to cap rates.
The ADP Employment report came in stronger than expected at +174k. This bodes well for Friday’s BLS employment report. The one caveat is December and January tend to have large seasonal adjustments due to the holidays so the data on a seasonally adjusted basis can be skewed. Given COVID-related lockdowns, that is even more true this year.
The graph below, courtesy of John Hussman, shows the median price to sales ratio for the S&P 500 broken down into ten deciles ranked on the price to sales ratio. While hard to see, all ten deciles are now at the highest levels since at least 1984. In the late ’90s the lower deciles were not trading at records as the upper deciles were. As such, the takeaway is that value, even in the “cheapest” S&P 500 companies, unlike 2000, is hard to find.
The ADP jobs report, due at 8:30 am, is expected to show a net gain of 50k jobs. While Monday’s ISM Manufacturing report was slightly below expectations, the jobs component rose nicely, signaling continued manufacturing jobs growth.
Also worth noting in the ISM report, it was the first time since 1978 that every firm surveyed saw an increase in prices. Commodity prices are rising, but we do not know whether it is temporary due to supply lines and speculative trading in some commodity futures.
February 2, 2021
Per Sentimentrader- “There may be cash sitting somewhere on the sidelines, but it’s not in the hands of investment managers. Mutual fund managers have less than a 2% cash cushion for the first time in history. Pension fund managers have 2.6% in cash, lowest ever.”
Almost half of the SP 500 companies have reported Q4 earnings. Based on the data thus far, sales are lower by -.54% and net earnings are up +3.4%. Margins have expanded decently as companies, in general, have reduced their workforce, other expenses, and capital investment to prop up earnings. Without stronger growth in sales, it will be hard for the nation’s employment situation to improve rapidly.
The U.S. Treasury has an estimated $1.5 trillion of cash held at the Federal Reserve. The surplus represents funds raised for various CARES Act programs that were not fully used. Due to the excess cash, the Treasury expects to borrow $853 billion less than they had expected in November 2020. The cash balance at the Fed should fall to about $500 billion, which is high but not extreme.
As a result, the Treasury will issue less debt, particularly in the Treasury Bill sectors. This might lead to some problems. The combination of greater collateral needs related to recent equity trading (typically T-bills are used as collateral) and lower issuance might push short-term rates, including Fed Funds, negative. If so, will the Fed take action to get Fed Funds back to its target range? Actions might include a reduction of QE or, more likely, a heavier focus on purchasing longer-term securities and possibly selling shorter-term securities, aka Operation Twist.
As shown below, the 1-month Treasury Bill has been trading slightly below its range of the last 6 months. Thus far it is not indicating much stress.
As we noted yesterday, expectations for tomorrow’s ADP report and Friday’s BLS data are weak. Initial jobless claims data over the last four weeks points to over 3 million people that lost jobs in January (seasonally adjusted). The chart below, courtesy of Arbor, provides another clue that this week’s labor reports may live up to their poor consensus expectations.
February 1, 2021
Silver, and in particular the $SLV ETF, is the squeeze du jour. It is important to understand that the dynamics behind squeezing SLV is different than GME or other short stock squeezes. SLV is an ETF, meaning that large dealers can create shares easily. Such makes it more difficult to squeeze. However, in order to create shares, the dealer must deliver silver in exchange for the new shares. While GME and others, by and large, only affect the longs and shorts of those stocks, SLV is affecting the price of silver itself. If this continues, it will brighten the outlook for silver miners but also raise input costs for manufacturers that use silver in their production process. Silver is required to produce many high tech goods. The graph below courtesy of the Financial Times shows the creation of SLV shares recently is massive.
Per Dow Jones: DTCC THE MAIN U.S CLEARINGHOUSE FOR U.S STOCK TRADES RAISED THE CAPITAL REQUIREMENTS INDUSTRYWIDE TO $33.5B FROM $26B THURS, A 30% INCREASE
This action requires brokers to put up more capital and/or sell assets to abide by the increased margin requirements. It was likely responsible for Friday’s decline. It also explains why Robin Hood and others are limiting or excluding shares in which clients can purchase. Recent activity in GME and other popular short squeezes are a sign that margin debt was at its limits.
This week will provide fresh employment data. On Wednesday, ADP will release their jobs report. Expectations are for a gain of 40k jobs. While better than the -123k last month, it would point to very tepid growth in the labor market. Expectations for the BLS report on Friday are equally weak with a gain of 20k jobs expected.
The national manufacturing and service sector surveys will also come out this week. In general, manufacturing is expected to show slight increases, while services retreat. Both should remain well in expansionary mode.
Fed members are out of their media blackout periods. It will be interesting to hear their take on recent market volatility, weak inflationary data, and any discussion on why they ended the repo funding program. Earnings reports will continue this week, with larger companies shown below.
We leave you for the weekend with a timely quote from Bernard Baruch:
“The main purpose of the stock market is to make fools of as many as possible.”
9:30 am ET
REVISED. We had a bad data feed earlier this morning and deleted our prior commentary on personal income and spending. The correct data is as follows: Personal income rose .6% and Personal Spending only fell 0.2%. The Employment Cost Index was +.9% versus +0.4% last month. This gives us hope that payrolls, reported next Friday, will be back on the upswing.
Last week we published The Fed’s Inconvenient Truth- Inflation is M.I.A. The gist of the article is that while the money supply is soaring, the velocity, or turnover, of the money is plummeting. To wit: “Herein lies an inconvenient truth for the Fed. They are boosting the money supply, and it’s having an equally negative effect on velocity. As such, it’s hard to forecast much inflation given current Fed policies.”
With yesterday’s GDP data we now have fresh velocity data for the fourth quarter. The graph below is updated to show that velocity (orange) fell sharply once again and counteracted the sharp rise in the money supply. Not surprisingly, the GDP deflator (change in prices) fell short of estimates at 1.9% versus expectations of 2.5%.
7:15 am ET
The short squeezes that got crushed yesterday recovered strongly overnight. GME and AMC are up 100% and 50% respectively. Janet Yellen is scheduled to brief Joe Biden at 11 am ET today about the situation in the financial markets. It appears yesterday’s actions by the brokers to restrict trading was possibly the one thing Democrats and Republicans can agree on- Per The Street: Rep. Ocasio-Cortez (D-New York) called Robinhood’s trading restrictions ‘unacceptable.’ Sen. Cruz (R-Texas) responded: ‘Fully Agree.’
We start the day with a graph from Jeff Gundlach at Doubline. The chart below shows that passive investing and buying and holding, despite recent popularity, may not always be winning strategies. As shown, Japan’s Nikkei 225 Index peaked in 1990 and has yet to get back to that level. Europe’s STOXX 50 and the MSCI Emerging Markets Index peaked in 2000 and 2007 respectively and similarly have yet to return to said levels. This is not a dire warning that the U.S. markets are peaking but it should serve as notice that markets can go long periods without reaching new highs. Valuations do matter in the long run!
January 28, 2021
1:05 pm ET
Is the short squeeze game over? Interactive Brokers and other trading firms, including Robin Hood, are not allowing their clients access to trade some of the “hot” short squeeze stocks and, even worse, in some instances they are forcing them to sell. As a result, GME is down 50% from this morning’s high of $500. Other “favorites” have similar losses. The broker’s trade limitations and forced liquidations expose their clients to massive risks. These actions may have lasting consequences.
“Interactive Brokers has put AMC, BB, EXPR, GME, and KOSS option trading into liquidation only due to the extraordinary volatility in the markets. In addition, long stock positions will require 100% margin and short stock positions will require 300% margin until further notice.“
*ROBINHOOD RESTRICTING TRANSACTIONS FOR GME, AMC, BB, OTHERS – Bloomberg
9:35 am ET
GDP was slightly weaker than expected at +4.0% annualized growth for the fourth quarter. While the economy has recovered nicely, the 2020 growth rate declined by 3.5%, the worst since 1946. As a point of reference, the “great recession” of 2008/09 only saw GDP decline by 2.5%.
Personal Consumption, typically accounting for 2/3rds of GDP, only contributed 1.7%, down sharply from over 25% last quarter. Given the last two retail sales data points and the increase in COVID restrictions late last year, this should not be surprising. Inflation is not showing to be problematic. The GDP deflator (implied price changes) rose 1.9%, versus a forecast of 2.4% and prior quarter reading of 3.7%.
Per Zero Hedge here are the main contributors to GDP:
Personal Spending added 1.7% to the bottom line in Q4, down from 25.44% in Q3
Fixed Investment added another 3.02%, also a drop from the 5.39% last quarter
Private Inventories contributed 1.04%, down from 6.57% in Q3
Net Trade subtracted -1.52% from the bottom line print, down from -3.21% in Q3
Government reduced GDP by -0.22%, vs -0.75% in Q3.
Fourth-quarter GDP, due out at 8:30 am, is expected to show an annualized 4.1% growth rate. The Atlanta Fed GDPNow forecast expects significantly more growth (+7.5%). Initial Jobless Claims, also due at 8:30 am, is expected to show 875k jobs were lost last week.
The graph below, courtesy of Jim Bianco and Goldman Sachs, speaks volumes about the last short squeeze fad on Wall Street. Many of the most shorted companies in this index, like Game Stop, AMC Theaters, and Bed Bath and Beyond are the most shorted for a reason- they are on the verge of bankruptcy.
January 27, 2021
2:10 pm ET
The Fed Statement was largely left intact from the last meeting 6 weeks ago. They did, however, alter their assessment of the recovery by saying the pace of recovery has moderated. Further, the Fed announced they are taking a first step in removing liquidity by ending overnight repo operations at the end of the month. The redlined text is shown below, courtesy ZeroHedge.
1:35 pm ET
We promise this is our last note about Game Stop (GME). The following headline just crossed the wires. *BIDEN TEAM IS ‘MONITORING THE SITUATION’ WITH GAMESTOP
11:15 am ET
China is the only developed nation to experience a full economic recovery from COVID. Given they are the second-largest economy in the world and their growth rate has been running well above other developed nations, they are, and have been, a tailwind for global economic growth.
Over the last week China’s short-term borrowing rates, a measure of supply and demand for cash, have spiked to five-year highs as shown below. The rate can be volatile at times so be careful reading too much into the recent action. That said, if this is truly signaling a cash crunch in China, the dollar may start rising which will bring with it negative side effects for many other asset markets. The dollar index is up .50 cents this morning and approaching a one month high. Technically it has stabilized from a 9-month downturn but has yet to fully signal the trend is broken.
10:30 am ET
The only decent explanation for this morning’s decline that we have seen is that some hedge funds are being forced to liquidate long positions to cover losses on the short side of their books. We wonder if some of the sell-off is also based on concerns for what the Fed may say regarding recent trading activity. We will share more as we learn more. Stay Tuned!
Per CNBC- Mar 21, 2018 — Fed Chair Powell warns some asset prices are ‘elevated’ including stocks.
Per CNBC Dec 16, 2020 – Powell says that stock prices are not necessarily high.
Unfortunately, the data shown below, courtesy Macrobond and Nordea, argues that asset prices/valuations are much higher today versus his comments from 2018. Will Powell and the Fed change their stance at today’s meeting/press conference?
7:25 am ET
The Fed will conclude its two-day policy meeting at 2 pm ET with the FOMC statement and Jerome Powell press conference at 2:30. We do not expect much new in the statement; however, we will pay close attention to any changes in how they characterize rising inflation and inflation expectations. In recent weeks, they have backed off their “letting inflation run hot” mantra, instead of retreating to their standard 2% target.
The press conference could be a little more interesting, especially if Powell is asked about recent bouts of excessive risk-taking in the equity markets, higher interest rates, and/or details on how or when the Fed will taper in the post COVID economy.
Quick update on $GME: it is now trading at $250 a share this morning, up over $150 from where it was trading at noon yesterday.
January 26, 2021
2:10 pm ET
A little more perspective on today’s consumer confidence number.
11:00 am ET
Consumer Confidence rose from last month’s level (87.1 -revised) and slightly beat expectations (88.5) at 89.3. The combination of vaccines, the new round of stimulus checks, and rising home prices are brightening the mood of consumers.
The Richmond and Dallas Fed Manufacturing Indexes were both slightly lower on the month.
The Case-Shiller home price index rose 9.1% year over year. The graph below shows pricing trends in the 20 largest metropolitan regions.
As we have mentioned on a few occasions, SPACs (Special Purpose Acquisition Companies) have become very popular over the last year. These private equity-like public stocks raised over $21 billion in January alone. Compare that to $83 billion for all of 2020, and $9 billion for 2019. While the potential returns of these entities are large, the expenses and risks are outsized. Like record-breaking call buying, cryptocurrencies, short squeezes, SPACs help us quantify the massive risks investors are more than willing to take on.
7:20 am ET
A brief update on GME, which we discussed in yesterday’s comments. After opening up yesterday in the mid-90s (+40% from the prior close) it rose to 159. Within two hours it fell back to 62, before closing the day at 77. Melvin Capital, a $12.5 billion hedge fund is one of the short-sellers that suffered from the surge in GME. Per Bloomberg, Citadel and Point 72 Capital are investing $2.75 billion into Melvin to help it stay afloat. Melvin is purported to have lost 30% of its principal year to date.
Will the Fed finally generate inflation up to and beyond their 2% target rate? That is the million-dollar question facing investors. Making answering the question tricky is so-called transitory inflation. Transitory inflation refers to temporary bouts of inflation that are likely not to be persistent. The Washington Post published a great article (Why the pandemic had driven global shipping costs to record highs) explaining how COVID and changes in consumption habits due to COVID have wreaked havoc on supply lines and shipping. The result is higher prices. We believe these cost increases are transitory but likely to persist until the vaccine is widely distributed worldwide. The Fed may have some comments on this topic at tomorrow’s FOMC meeting.
January 25, 2021
4:30 pm ET
Today provided further hints that the reflation trade may be fading. The graph below is a heat map, courtesy of FINVIZ, showing how S&P 500 sectors and individual stocks fared on the day. Note that Utilities, Real Estate, Consumer Staples had good days, while Financials, Industrials, Energy, and Materials were lower. Bond yields were also notably lower on the day. The recent activity does not necessarily mark the end of the reflation trade. It could easily be a healthy decline/consolidation before the reflation trade picks back up again.
On Friday, Game Stop (GME) rose over 50%. This morning it is trading up an additional 40%. What was a $5 stock last fall is now worth $100. The reason is not good earnings, a takeover, or even positive news. What appears to be driving GME higher, as well as some other notable stocks such as BBBY and DDD, is a short squeeze. Short interest in these stocks is huge as their fundamentals are poor and many investors are betting on lower prices if not bankruptcy in some cases. The first graph below shows that while companies like GME and BBBY may have poor outlooks, their price performance has been stellar.
What we are witnessing is the latest market craze. While some investors are short, other investors see the massive short interest and try to squeeze the shorts. They try to push the stock higher, which in turn creates losses and margin calls for the shorts. In turn, this forces many shorts to cover and can drive the price significantly higher in some cases. Investors on the long side are not buying fundamentally sound or cheap companies but simply playing them in hopes of squeezing short investors.
Making short squeezes even easier than in the past are Gamma Squeezes. For more on how traders are able to push GME higher, squeezing options traders, and then short traders we recommend the following article- Game Stop and the Dangerous Game of Gamma Squeezes.
7:15 am ET
This week is shaping up to be a busy one with a lot of economic data, the Fed meeting on Wednesday, and plenty of corporate earnings reports scheduled throughout the week.
On the economic docket, the health of the manufacturing sector via the Dallas and Richmond Fed surveys will be released on Tuesday, and the widely followed Chicago PMI on Friday. All three are expected to decline but remain in expansionary mode. Also of note, will be today’s release of the Chicago Fed NAI, a broad measure of economic activity, the Case Shiller Home Price Index on Tuesday, Durable Goods on Wednesday, Jobless Claims and GDP on Thursday, and Personal Income and Spending on Friday.
The Fed will meet on Tuesday and Wednesday, followed by the standard FOMC statement and press conference by Jerome Powell.
A large number of corporations announce Q4 earnings as shown below.
Existing Home Sales were very strong once again rising to the highest level in nearly 15 years. The median selling price was up 13% on a year over year basis. While the housing market is on fire, the report had an interesting bearish comment that accompanied it. Per Lawrence Yun, Chief Economist for the National Association of Realtors, stated the following: “Today’s market is unhealthy, people are making hurried decisions and prices are rising way above income growth,”
9:30 am ET
Today we introduce a lesser followed inflation expectation measure published by the Fed. The 5×5 Forward Inflation Expectation Rate compares 5yr and 10yr nominal and TIP bonds to arrive at an average implied inflation rate that covers the 5 year period starting 5 years from now. What we find interesting about the index, as shown below, is its high correlation to the price of crude oil. Crude oil is used directly and indirectly in many facets of the economy. It is therefore not surprising that energy prices play a large role in the market’s inflation expectations. As such, we recommend following the price of crude oil, along with bond yields, consumer/manufacturing inflation surveys, and implied breakeven inflation rates to help form opinions on the rate of inflation going forward.
Yesterday, the 10-year implied inflation rate hit 2.18%, a level which was last seen in 2017 and 2018. As shown in the box below, the Fed was aggressively raising rates at that time. Today, despite similar implied inflation levels and an upward trajectory, the Fed insists on keeping rates at zero for a long time. With unemployment still high and a desire to run inflation hotter than their 2% target, this should not be surprising. The question, however, is how high do inflation expectations have to rise before the Fed reacts?
January 21, 2021
2:00 pm ET
We stumbled across this valuable table below on Twitter which serves as a good identifier of companies involved in the “green trade.”
10:00 am ET
The following commentary from Tom Demarco of Fidelity may help explain some of yesterday’s euphoria-
“Yellen’s Senate confirmation hearing received a lot of focus on Tuesday, but none of her remarks were surprising. That said, her commentary on taxes was a big relief for the market in my opinion. Yellen wants to “go big” on fiscal policy as low rates for a long time should mean the US has the capacity for such a program. She felt the initial focus should be on bolstering economic growth instead of raising taxes. Somewhat heretically for a Democrat, Yellen acknowledged the ’17 corporate tax cut helped improve the competitiveness of American business and she vowed to keep corporate rates below pre-2017 levels, although she repeated that companies and wealthy individuals pay their “fair share”.”
9:25 am ET
Initial Jobless claims fell from last week’s 926k (revised lower) to 900k. While the decline is good, the number of people being laid weekly remains stubbornly high.
Housing data remains strong. Housing starts grew 5.8% rate versus 0.8% expected. Building permits were also higher, denoting that builders are likely to continue to ramp up construction to offset a near record low supply of homes for sale.
Prices paid in the Philadelphia Fed Manufacturing Index rose sharply as did the overall index.
While on the topic of inflation, investors are clearly betting on inflation as witnessed by the chart below courtesy of the Daily Shot.
6:30 am ET
It seems a day doesn’t go by in which we are asked if we are concerned about inflation. Often the question is prompted by a graph of the surging money supply. We fully acknowledge money supply plays a big role in price changes, but often forgotten and equally powerful is monetary velocity. Yesterday we published The Fed’s Inconvenient Truth: Inflation is M.I.A. to help our readers understand the interaction between inflation, money supply, and velocity. The article provides a framework to watch the actions of the government, Federal Reserve, consumers, and corporations to better assess whether or not inflation is a risk.
January 20, 2021
2:00 pm ET
Earlier we showed how President Biden is entering office with record-high equity valuations. We add another headwind to his presidency, courtesy of the Peterson Foundation, as shown below. The ratio of public government debt to GDP is nearing in on the debt explosion and weak GDP that accompanied WWII. At that time, the spike in the ratio fell just as quickly as it rose as GDP flourished in the booming post-war economy. Strong productivity growth, pent up demand, suburbanization, and positive demographic effects greatly accelerated economic growth. As the graph projects, the ratio will worsen this time as there are far fewer drivers of growth and large headwinds in the form of debt, demographics, and weak productivity growth.
1:00 pm ET
Interest rates declined over the last five years and corporate treasurers’ responded by issuing longer maturity bonds to take advantage of the situation. As a result, and shown below, the duration of corporate bonds in the market increased by nearly 50%. Duration is a measure of when investors can expect the average cash flow (coupon/principal) from a bond. Duration is also a measure of risk as it approximates how much a bond’s price will move for a given change in yield. Considering that duration is high and yields are low, the risk per unit of yield for corporate bonds is extreme.
8:20 am ET
As we welcome Joe Biden to the White House and think about what the next four years may bring stock investors, Sven Henrich provides important valuation data to put the discussion in proper context versus what each of the last 8 Presidents faced on their inauguration day.
“Total stock market capitalization vs GDP on inauguration day of a new president: Ford: 40% Carter: 47% Reagan: 43% Bush I: 53% Clinton: 64% Bush II: 117% Obama: 60% Trump: 125% Biden: 190%”
7:15 am ET
The graph below, courtesy of Advisor Perspectives, shows Tobin’s Q Ratio is now at its highest level in at least 120 years. The ratio is a proxy for the market value premium or discount to a company or index’s worth. Prior to the last 20 years, anything over 1.0 was considered a bubble.
Treasury Secretary nominee Janet Yellen was in Congress this morning for her confirmation testimony and questioning. The following headlines and quotes from the meeting caught our attention:
BIDEN ADMIN FOCUS WIlL BE ON MAIN STREET AND NOT WALL STREET
I would be very pleased to take a look” at issuing longer-term debt, including a 50-year Treasury bond
TREASURY NOMINEE YELLEN SAYS PREPARED TO USE FULL ARRAY OF TOOLS TO CHALLENGE CHINA’S ABUSIVE, UNFAIR AND ILLEGAL PRACTICES
Our focus should be Main Street, not Wall Street
TAXING UNREALIZED GAINS MAY POSE TECHNICAL CHALLENGES
Corporate executives, those with the most knowledge of the workings of their respective companies, are not as optimistic about their company’s stock valuations as one would expect given the excessive sentiment exhibited by investors.
With employment, inflation, and retail sales data for December already released, the pace of economic data for the remainder of the month will slow. Of interest, this week will be weekly initial jobless claims and an assortment of housing data on Thursday.
The Fed is entering their self-imposed media blackout period for voting members in anticipation of the FOMC meeting next Wednesday. Non-voting members are allowed to speak publically, but their opinions tend to carry less weight in the markets.
The corporate earnings calendar will pick up in earnest this week, with banks and transportation companies predominately on the calendar.
This past weekend, Neil Irwin of the New York Times published an interesting article. He provides a better appreciation of the potential inflationary impacts based on how consumers might react to the vaccine, large stimulus, and high savings rates.
**Markets will be closed on Monday for Martin Luther King’s birthday.
11:00 am ET
The quote of the day comes from Danielle DiMartino Booth in regards to the Fed tapering QE.
“I think investors are getting a little ahead of themselves, anticipating the Fed beginning to tighten when they are not even thinking about thinking of taking such measures.”
Retail Sales and PPI came out at 8:30 as shown below. Retail Sales were much weaker than expected for a second month. Most noteworthy, the control group which feeds about 30% of GDP, was down -1.9% and last month’s figures were revised lower from -.5% to -1.1%. PPI was a mixed bag, but like CPI, is not showing concerning signs of inflation. PPI excluding food and energy fell from 1.4% to 1.2% on a year over year basis but was up .4% on a monthly basis versus .1% last month.
The graph below courtesy of Bespoke is very interesting. Per their tweet- “Third largest decline in Non-Store (Online) sales in the last 20+ years? During a pandemic when people are staying at home?”
7:30 am ET
Last night, Joe Biden released details of his $1.9 trillion stimulus program. A summary, courtesy of CRFB, is shown below. Of note, the stimulus will release about a third of the money in the next few months and delay the rest of the stimulus toward the latter half of the year. This should help even out economic growth through 2021.
7:15 am ET
We start the day with an interesting Bloomberg article which was focused on a survey conducted by the ECB. The survey asked 72 European non-financial companies the following question- “Focusing on your own business/sector, how would you assess the overall long-term effects of the Covid-19 pandemic on the following?” Based on the results below, it appears, in aggregate, they expect to be suffering from the pandemic well into the future. From a profit perspective, they are counting on enhanced productivity to offset lower prices and sales. Employment and wages may suffer as a result of a weaker business climate. Reduced sales and potentially higher input costs are a distinct possibility in the U.S. as well. As such, we presume many U.S. companies will try to boost margins in a similar fashion. Such a paradigm does not bode well for labor.
January 14, 2021
3:25 pm ET
For the most part, Jerome Powell continues to shy away from putting a timeline on when the tapering of QE purchases might begin. Today he said: “The Fed will communicate exit early and clearly when it is time.” That said, he did acknowledge the economy could be back to the pre-COVID peak “fairly soon“, which could imply the Fed might be tapering “fairly soon.”
12:45 pm ET
Yesterday we shared the absurdity of Door Dash’s (DASH) valuation. Today we share another. With a market cap of $110 billion, Airbnb now has a market cap higher than the 6 largest hotel chains combined– Marriott, Hilton, InterContentintal, Hyatt, Wyndham, & Choice).
We recently found a series of charts in FINVIZ that help visualize valuations of S&P 500 companies and the current behavior of Wall Street analysts and investors. Instead of cluttering up the commentary space on RIA Pro, we thought you would better appreciate the charts and can share them more easily in an article format. Click on the heat map below to access the graphs.
Initial Weekly Jobless Claims were much higher than expected at +965k versus +784k last week. Of note, covered employment was reduced by 4.4m. These are jobs being permanently reduced. We do not know if this was a seasonal adjustment or year-end issue but if it’s real, it points to a weak jobs report next month.
6:45 am ET
After two strong Treasury Auctions of 10 and 30-year bonds on Tuesday and Wednesday, which helped push long-term yields lower by 10bps, Biden upset the trend with word that his new stimulus plan will be around $2 trillion. That is much more than the $800bn to $1.3tn range which was widely expected. The 10yr UST yield backed up to 1.11% overnight from 1.07% yesterday afternoon. Stocks rose overnight on the news but have since given up their gains and look to open flat.
January 13, 2021
1:40 pm ET
Just when you think things can’t get crazier, Door Dash (DASH) is up another 6% today making it nearly 50% for the year to date. More startling, it now has the same market cap as FedEx (FDX).
1:15 pm ET
Yesterday’s 10-year UST auction and today’s 30-year auction were met with strong demand. As a result, the 10-year is down over 10bps from yesterday’s pre-auction high. It’s too early to know if bond yields peaked, but the strong demand for the auctions shows significant demand at current levels. This affirms what we have been watching with money flows as well.
1:00 pm ET
It appears the meteoric rise in cryptocurrency prices is on the central bankers’ radar. Reuters put out the following article this morning, ECB’s Largard calls for regulating Bitcoin’s “funny business”, in which ECB President Largard calls for regulations. Her concern appears to be money laundering but their regulatory authority will surely intensify if crypto continues to impinge on sovereign currencies. As we wrote two years ago in Salt, Wampum, Benjamins – Is Bitcoin Next? :
“If BTC continues to gain in popularity there is little doubt in our opinion the government will seek control or at a minimum the personal data from the transactions. In fact the SEC has recently opined on the matter claiming that “tokens” such as BTC can be deemed securities and may need to be formally registered. This is just a first step but given the potential threat, we envision government will impose a way to remove the secrecy BTC offers, allowing taxation and legal supervision to occur.”
CPI was slightly higher than last month, meeting expectations for a 0.4% monthly increase. The Fed tends to rely on CPI excluding Food and Energy, as they consider price changes in those goods transitory. CPI ex-food and energy was underwhelming with the monthly rate at +.1% below last month’s +.2%. Year over year it was +1.7% versus +1.6% last month. There is little in this report that warns of pending inflation. All eyes to Friday’s PPI report.
8:05 am ET
As shown below, courtesy FINVIZ, the price of grains has risen sharply over the last few months. As a result, many producers of food products using grains or those relying on grains have stumbled. Kelloggs (K) for instance is down nearly 20% and sits much closer to its March lows versus its recent July highs. The price action of GIS, CAG, and HRL among others, looks similar to K (shown below). When the “reflation” trade ends these will likely be good purchases but we warn that might be a while longer.
7:10 am ET
CPI will be released at 8:30 am. The current expectation is for monthly inflation to uptick to .4% from .2% last month. Year over year inflation is also expected to increase from 1.6% to 1.7%.
Fed members, Brainard, Bullard, and Vice Chair Clarida will speak today. Over the last couple of days, a few Fed members have mentioned the possibility of tapering QE by year’s end. We will closely follow upcoming Fed speeches to see if this becomes a more common theme. Here are a few examples:
Fed’s Kaplan: If Economy Goes As He Expects, We Should Be Having An Earnest Discussion About QE Taper Later This Year
Fed”s Evans: Fed could taper in late-2021 or early 2022 if the economy is better.
Bloomberg- Fed officials said that more fiscal support and vaccines could lead to a strong economic recovery in the second half, setting the stage for a discussion of tapering
January 12, 2021
1:45 pm ET
The graph below compares 10-year implied inflation rates (blue) to 10-year UST yields (red). The difference between the two is called the real yield. As shown, implied inflation has risen about 50bps more than UST yields over the last 7 months, therefore real yields have fallen. Fed purchases of TIPs drive the implied interest rate up and purchases of nominal USTs drive nominal yields down. In a normal market, without interference by the Fed, nominal yields would trade higher than inflation expectations. With Treasury debt levels at historical extremes, the Fed cannot tolerate UST yields over 2% as this graph implies. Expect this divergence to continue and likely widen if the Fed has their way.
1:00 pm ET
Over the last month or so, we have shown a good number of sentiment measures at extremes (including the one from first thing this morning), and in some cases at levels never been seen before. The table below, courtesy of Crescat Capital, shows that a multitude of valuations measures also sit at record highs. The market can keep chugging higher but it worth reminding yourself that sentiment and valuations are in rarefied air.
The NFIB small business optimism index took a hit falling 5.5 points to 95.9. Of the ten survey components respondents were asked about, nine were lower than the prior month. From an inflation perspective, the NFIB writes: “The net percent of owners raising average selling prices decreased 2 points to a net 16% (seasonally adjusted). Price hikes were the most frequent in retail (30% higher, 6% lower) and wholesale (26% higher, 13% lower). A net 22% are planning price hikes (seasonally adjusted).” This report jibes with other data pointing to no current inflation but the anticipation of inflation in the future.
Key findings from the NFIB are as follows:
The percent of owners thinking it’s a good time to expand decreased 4 points to 8%.
Sales expectations over the next three months declined 14 points to a net negative 4%.
Earnings trends over the past three months declined 7 points to a net negative 14% reporting higher earnings.
Small businesses account for over 60% of employment in America. This survey provides important data on the state of small business and what that may mean for inflation and employment trends.
7:00 am ET
The fourth-quarter earnings season kicks off this week with a handful of companies reporting earnings. Of note will be Delta Airlines and Blackrock on Thursday followed by a few large banks on Friday – JPM, Citi, and WellsFargo.
The following chart, courtesy of Citi, was making the rounds on Twitter yesterday. It shows that market sentiment is literally off the charts!
January 11, 2021
1:45 pm ET
Per BofA- Bitcoin “blows the door off prior bubbles.” On the topic of bubbles, Tesla is up over 200% in less than two months. The only news of note was two Wall Street analyst reports which both set a price target lower than the current price.
The week ahead will be important as the BLS releases consumer and producer price data for December. The reports will provide some evidence as to whether higher inflation expectations are playing out in the economy. CPI, due out on Wednesday, is expected to rise at a year over year rate of 1.2%, the same as November. PPI, being reported on Friday, is also expected to be flat versus November at 1.4% annually. Also on Friday, the University of Michigan will release its consumer sentiment survey which has an inflation subcomponent. Retail Sales will also be released on Friday.
Fed members have an active speech schedule this week. Of note will be Fed Chair Powell on Thursday afternoon and Vice Chair Clarida on Wednesday.
It could be another volatile week for bond yields. The Treasury will conduct its 10-year auction on Tuesday and 30-year auction on Wednesday. Both auctions may exert further downward pressure on bond prices. Biden’s stimulus plan is expected to be released later in the week. Bond investors will pay attention to the size and composition of spending, as well as any details on potential tax increases. Initial rumors of a spending package “in the trillions” pushed yields higher Friday afternoon.
(Good comments on why we sold IAU and GDX yesterday.)
January 8, 2021
1:00 pm ET
Earlier this week we showed the dollar on a long-term scale to show that the recent sell-off is well within historical norms. Today we share 10 year UST yields. As shown, yields have certainly risen over the last few months, but remain well below all instances on the graph going back to 1970. Simply, the recent increase is meaningless on a historical basis.
The problem however is that as the economy has become more dependent on debt and lower interest rates to service the debt, the threshold for economic pain due to higher rates has increased markedly. We find it highly unlikely that the 10-year yield could get back to even 2% without economic weakness and problems in the financial markets.
11:35 am ET
Fed Vice Chair Clarida put to rest the notion that the Fed might taper QE purchases this year, saying “can be quite some time before we think about tapering” & “my economic outlook is consistent with us keeping the current pace of purchases throughout the rest of this year.” He does expect an uptick in inflation in the months ahead but also believes it’s transitory. He also stated that he is not concerned with the 10-year Treasury yield above 1%.
10:00 am ET
The graph below, courtesy of Goldman Sachs, shows a large gap between actual volatility (light blue) and implied volatility (dark blue) which is what investors are pricing into options contracts. Will implied volatility fall back to the teens, where it was for the large majority of the post GFC era, or are VIX futures correct in implying a significant level of volatility lies ahead? It is worth noting that the surge in call option activity is providing a bid to the VIX and possibly distorting the historical relationship.
Like the ADP report on Wednesday, the BLS employment report was weaker as the economy lost, in aggregate, 140k jobs. On a positive note, hourly earnings increased sharply. As we warned last month, December’s data has large seasonal adjustments which are likely greatly flawed due to irregular hiring patterns for the holidays. For example, earnings were probably higher solely because traditional brick and mortar retail and restaurants, which tend to pay low wages, did not staff up like prior years. To that end, food services and drinking establishments lost 372k jobs.
7:15 am ET
The consensus estimate for today’s BLS payrolls report (8:30 am ET) is +65k, with a wide range of projections (-50k to +302k). If the consensus is accurate, this will be the sixth month of decelerating payroll growth and the first increase in the unemployment rate since April.
January 7, 2021
1:30 pm ET
The graph below, courtesy of Arbor, compares 2yr and 10yr implied inflation levels. As they highlight with the dotted lines, a peak in inflation expectations occurred the last 7 times short term inflation expectations (2yr) equaled or rose above long term expectations (10yr). The chart argues that inflation expectations should decline rapidly in the near future or this time is different and inflation is truly taking hold.
Jeremy Grantham’s article, Waiting for the Last Dance, can be found HERE.
10:00 am ET
The following headline just hit the wires: “FED’S HARKER: COULD DISRUPT MARKETS IF WE TAPERED TOO SOON.” It’s clear from that comment the Fed knows QE is driving markets and the situation is hemming them into policies driven by markets, not economics.
Initial Jobless Claims last week were 787k versus 790k the prior week. Claims continue to stay at a stubbornly high level despite economic recovery. Just to reiterate prior comments, nearly 800k people were laid off just last week alone. Prior to the recent experience, the number had never been above 700k since at least 1967.
7:00 am ET
With a Democrat-led Congress and with it, projections for even greater deficit spending, the following WSJ editorial –Welcome to the Era of Non-Stop Stimulus is worth considering. The prospect of trillion-dollar deficits well into the future is high and with it comes benefits and consequences. In the short run, government spending drives the economy/ reduces recessionary impacts, but in the long run, it detracts from economic growth. Further, the Fed is all but forced to stay very active to help ensure the interest rate on the debt stays at very low levels. This is the macro trap facing our fiscal and monetary leaders. The graph below the quote from the editorial shows deficit spending has far outpaced the tax revenue, which in part highlights that the rate of spending is unsustainable without consistent help from the Fed.
“But with President-elect Joe Biden now making it clear that the recent $900 billion stimulus will “at best only be a down payment” and the now $3.3 trillion of total stimulus spending “is just the beginning,” it sounds like America is headed into a program of permanent stimulus.”
January 6, 2021
2:25 pm ET
The Fed minutes from their December meeting were largely as expected. They continue to worry about “considerable” risks to the economy due to COVID and have no intention of slowing up QE in the near term. That said they seem to be a little more comfortable with the longer-term outlook. “The recent sharp resurgence in the pandemic suggested that the near-term risks had risen, while the recent favorable developments regarding vaccines pointed to some reduction in the downside risks over the medium term.” The Fed is also showing some concern with rising long term interest rates- “a couple of participants indicated that they were open to weighting purchases of Treasury securities toward longer maturities.”
11:30 am ET
The table and graph below provide guidance on how 12 month forward P/E ratios for the S&P 500 and its sectors, compared to their respective averages of the last 20 years.
10:15 am ET
Bond yields are rising sharply this morning on concerns that a Democrat-led Congress will further increase fiscal spending, resulting in even more debt issuance. As shown below TLT, an ETF proxy for 20 year UST, was tightly wound and reaching the pinnacle of a pennant pattern. This morning it clearly broke lower out of the pattern. Fed minutes from their December meeting will be released this afternoon. While unlikely, it will be interesting to see if there are any concerns about rising interest rates.
The ADP labor report showed a loss of 123k jobs in December versus expectations for a gain 130k of jobs and a prior addition of 307k jobs. The correlation between ADP and Friday’s BLS employment report has been historically strong, but over the last 9 months, it has weakened considerably. As such we must be careful not to read too much into today’s report.
7:25 am ET
The markets, with the exception of bond yields, are relatively calm following what appears to be a Democrat sweep in Georgia. 10-year U.S. Treasury yields are up 6.5 basis points last night to 1.02% as the market presumes more stimulus is likely with full Democrat control of Congress. Stocks are flat and the dollar is slightly lower.
Crude oil and the energy sector (XLE) were both up nearly 5% yesterday. XLE now sits at about 15% above its 50 dma and 200 dma. It is not quite at 2 standard deviations above each moving average so there is some more room to keep running.
Last night a subscriber asked us, per our commentary yesterday on the ISM prices index, how well correlated the index is to manufacturers’ input prices. As shown below, the correlation was relatively strong before 2017 but has tailed off over the last few years. We will pay close attention to next week’s PPI data to see if the survey truly reflects rising prices or just a “feeling” that prices are rising like in 2018. We remind you this survey simply asks the respondents to make a comparison versus last month and not to quantify the degree of change. The other factor to consider is whether or not price changes are due to temporary supply line constraints or more sustainable inflationary forces.
January 5, 2021
12:45 pm ET
Perspective Matters!
The graph below is a monthly graph of the U.S. dollar since 1990. As shown, the dollar is declining but it is well within its 30-year range. Reports saying the dollar is crashing are not apparent by looking at the chart.
10:05 am ET
The ISM Manufacturing Index rose nicely to 60.7 from 57.5 last month and 56.7 as expected. On the positive side, the employment sub-index rose back above 50 denoting an expansion of hiring. The fly in the ointment in the report is the Prices Paid sub-index rose sharply to 77.6 from 65. If manufacturers can not pass on higher production costs, profit margins will decline. If they can, we should see increases in CPI and other consumer inflation gauges.
9:50 am ET
Crude Oil is rocketing higher by nearly 4% and approaching $50 a barrel after Russia is ending its push for an increase in production for February. Per Investing.com – “Newswires reported that Russia’s deputy prime minister Alexander Novak had agreed to ‘roll over’ the current level of production for another month, in view of an expected shortfall in demand from key economies due to the resurgence of the Covid-19 virus and spreading lockdown measures to contain it.”
It appears Atlanta Fed President Raphael Bostic floated a trial balloon by raising the prospect that the Fed could taper, or reduce its pace of QE purchases. Per Reuters:
“I am hopeful that in fairly short order we can start to recalibrate,” the $120 billion in U.S. Treasury and mortgage-backed securities that the U.S. central bank is currently buying each month, Bostic said in an interview with Reuters.
The Federal Reserve could begin to trim its monthly asset purchases this year if distribution of coronavirus vaccines boosts the economy as expected, Atlanta Fed President Raphael Bostic said on Monday in what amounted to a bullish outlook for the coming months.
7:35 am ET
Reading through market conjecture about why equities sold off yesterday, it appears some are blaming today’s Georgia Senate runoff. The thought is that a blue sweep would give the Democrats full control of Congress thus allowing for greater fiscal spending, which can be inflationary. To that end, 10-year implied inflation expectations hit 2% yesterday, a two-year high, and the materials and energy sector, as shown below courtesy of Finviz, rose despite large drops in the other sectors. Materials and energy stocks, and in particular producers of raw materials, should outperform in an inflationary environment.
While some inflation and a short-term economic surge may benefit stocks, the flip side is that more inflation will force the Fed to take their foot off the monetary pedal by reducing QE or even raising rates. The market has run well ahead of fundamentals, leaving QE and excessive monetary policy as key drivers of asset prices. As such the market will be increasingly sensitive to changes in monetary policy.
January 4, 2021
3:00 pm ET
As we noted last week, it is typical at year ends to see window dressing trades and tax-related buying and selling. Some of these trades tend to be reversed in the new year. We believe that helps explain today’s sell-off. However, a newly announced 6-week national COVID-related lockdown in England and jockeying ahead of the Georgia Senate runoff election are also playing roles.
12:40 pm ET
In a speech this morning, Chicago Fed President Evans downplayed the market’s inflation forecasts. The following headlines make it clear he thinks the Fed still has a lot of work to do in order to get inflation up to its goal:
“will take years to achieve average 2% inflation goal”
“important for the Fed to get inflation moving higher with momentum”
“Fed likely to continue with bond-buying for some time”
“monetary policy will be accommodative for a long time”
11:35 am ET
The chart below plots 2020 price returns for the most popular exchange-traded commodities. The data is in strong opposition to deflationary data from the BLS Producer Price – Commodities Sub-Index (PPI), which is actually down .4% for the year through November. Excluding gold, as it not used heavily in the production of goods, the average change in commodity prices shown below is +12.6%. Energy products, excluding Natural Gas, were the only commodities lower on the year.
In this first week of the new year, ADP and the BLS will update the employment picture. ADP releases their employment index on Wednesday. Current expectations are for the addition of 170k jobs, following 307k in November, 404k in October, and 754k in September. Following last month’s weaker than expected reading, the BLS Employment report on Friday is forecast to show a gain of only 112k jobs in December. The unemployment rate is expected to tick up by .1% to 6.8%. As shown below, 22 million jobs were lost in March and April of which 12.3 million were recovered. The road back to full employment will be lengthy if payrolls only grow by 100-200k a month.
The next big risk event will be the January 5th run-off Senate election in Georgia. While the Republicans are expected to win and hold the Senate, a surprise victory by both Democrats could supercharge the equity markets and push yields higher as the prospects for a much larger stimulus deal in the months to come increases significantly.
If you are looking for things to worry about, the following survey provides a list of possible events that concern investors in the year ahead.
December 30, 2020
12:00 pm ET
This morning we published Plus ça change: A French Lesson in Monetary Debauchery which tells the story of monetary and fiscal failures that led to the French revolution. While there are many similarities to the current situation there are also important differences. “This story is not a forecast but a simple reminder of what has repeatedly happened in the past.”
11:20 am ET
Keep an eye on bonds. In particular, the price of TLT has been consolidating with slowly rising bottoms and surging money flows over the last two weeks. A breakout in TLT (falling rates) might be the surprise no one is expecting in January. We would like to see TLT (156.75) trade above its 20 dma (157.10) and 50 dma (157.92), before betting on a bounce higher.
10:00 am ET
It appears the ECB is finally showing some concern about a stronger euro versus the dollar. Per Ollie Rehn, Governor of the Bank of Finland-“ECB Is Monitoring Euro Exchange Rate Very Closely.” A stronger euro is deflationary which poses problems for the region which already has a deflation problem and employs negative rates. We suspect that the eurozone will not tolerate much more dollar weakness.
7:30 am ET
Yesterday we ran across the following Bloomberg article – Treasury Market’s Inflation Gauge Nears 2%, Highest Since 2018. We ask, does the inflation gauge still have credence?
The Fed closely monitors and bases monetary policy on inflation expectations as measured by the TIPs market. This gauge used by the Fed and investors is becoming a questionable forecasting tool as the Fed now owns over 20% of the TIPs market. Due to massive QE, their outsized demand for TIPs over the last 6 months has pushed inflation expectations higher than that which would have been the case without their interference. The Fed can own up to 70% of any security, meaning they have plenty of room to buy more TIPs and further distort inflation expectations.
The graph below compares 5 year implied inflation data with actual CPI data occurring 5 years from that point. As shown implied inflation expectations have been a reliable gauge for the last four years. Unfortunately, the value of this important data point will lessen as the Fed, not the market, increasingly dictates inflation expectations.
December 29, 2020
11:40 am ET
The chart and commentary below from Siblis Research serve as yet another reminder that valuations, in many cases, are at or near record levels.
10:30 am ET
Next Tuesday Georgia will conduct run-off elections for both Senate seats. Given that a Democrat sweep can tip the Senate in the Democrat’s favor, this election has big implications. The polls below, courtesy 538, show that both Republicans have slight leads in the most recent poll. However, based on their prior two polls, conducted before Christmas, the polls have fluctuated back and forth. From an economic/investing perspective, a Democrat sweep will likely mean more stimulus, but potentially higher taxes for the wealthy. It also makes a roll-back of the corporate tax cut of 2018 more likely.
10:15 am ET
Case Shiller’s 20 city home price index for October was up an annualized 7.95%, beating expectations by 1%, and showing the sharpest one-month increase in over 5 years.
8:10 am ET
The price of cryptocurrency Ripple fell below 20 cents last night, down nearly 70% over the month of December. The sharp decline is based on an SEC allegation that Ripple is a security. Ripple is not Bitcoin, but this action and the proposed legislation to regulate stablecoins raises our concern that regulatory actions can cause severe drawdowns in cryptocurrency space, including Bitcoin.
It is worth noting, as we consider potential potholes, Ripple is centralized (ie. controlled by an entity) and Bitcoin is decentralized (not controlled by anyone).
The low volume equity melt-up continued overnight with further gains of half a percent. Yesterday’s nearly 1% gains were impressive, but there are some concerning factors under the hood. For one, the VIX and bond prices both ended higher on the day. Advancing NYSE stocks only beat out declining stocks by 53.5% to 44.5%. We would have expected a much larger margin/better breadth. Lastly, the Russell 2000, which has been leading the market over the past few weeks, fell by .37%. That being said, we are careful not to read too much into this week’s trading due to light volumes and year-end related trading pressures.
December 28, 2020
12:00 pm ET
One of our primary concerns of investing in cryptocurrency is the governments’ ability to regulate or even abolish it if the government deems it detracts from their ability to control monetary issuance and therefore manage the economy via their own currencies. To that end, a bill was introduced that would heavily regulate stable coins. Unlike the more popular bitcoin and other cryptocurrencies, stablecoins peg their market value to an external index such as the dollar or a commodity. This new bill would require stablecoin issuers to become banks with the approval of the Federal Reserve and FDIC.
Per Troy Bombardia @bullmarketsco – “Something to watch out for in 2021: Margin Debt soared 50% in the past 8 months. In the past 30+ years, such investor euphoria happened exactly twice:
Equities are opening up strong this morning as President Trump signed off on the $900 bn stimulus deal including $600 checks to individuals. This morning the House will vote on Trump’s request for an increased $2,000 for each qualifying individual. Bonds are weaker and the dollar is flat. Gold was up over $25 last night but gave back most of those gains. Conversely, crude oil opened up down 2% and is now up over 1%.
7:25 am ET
This will be another quiet week for economic data. On Monday and Wednesday, we get our first look at December’s manufacturing surveys, as the Dallas Fed and Chicago PMI report data respectively. Both are expected to show declines but stay above 50, denoting expansion. Jobless Claims on Thursday are expected to uptick slightly from 803k to 815k. Markets will be closed on Friday for New Years Day.
Freddie Mac reported 30 year and 15 year mortgage rates hit new record lows this week. As shown in the graph below, a conforming 30 year mortgage is now 2.66%, almost 1% lower than the lows set in 2012. In case you are wondering why mortgage rates are declining while longer-term Treasury yields are rising, the answer lies in the duration of a mortgage. Due to significant refi and purchase activity, the duration of a mortgage is now below five years. As such mortgages are priced off of 3 and 5 year Treasuries bonds which have seen stable to declining yields over the last month.
Yesterday we showed how household income has risen sharply during the pandemic due to the Cares Act. Last night we stumbled upon the graph below, courtesy of @ernietedeschi, giving a much more detailed breakdown of the factors driving the increase in household incomes. Per Ernie, the average citizen has gained $5,439 of extra income due to government stimulus. This compares to what would have been a decline of $4,074 without said benefits.
Equity markets close at 1 pm and the bond market at 2 pm today.
The graph below shows Disposable Income surged on the original Cares Act and has now retreated to the prior running rate. The $2.2 trln increase in income was solely due to the $2.4 trln increase in government transfer payments (benefits to citizens). It should be no surprise with incomes back to normal and most Cares Act related spending used, the recovery is faltering. While the new stimulus bill will boost incomes and provide a spark for short term growth, it should be recognized that the natural organic rate of economic growth is low.
8:45 am ET
Initial Jobless Claims fell from 892k to 803k. Over 20 million people are receiving Federal and/or State unemployment aid. About two-thirds of those people will lose aid on December 26th if the lastest stimulus act is not finalized. That is a primary reason Congress is rushing the legislation.
Personal Income fell 1.1% versus expectations of a .3% decline, and a decline of .6% last month. Personal Consumption (spending) fell 0.4%. Bottom line is that fiscal stimulus is wearing off quickly. The new stimulus bill will boost income and spending but only on a temporary basis.
7:00 am ET
On a few recent occasions, we have warned that the dollar is very oversold technically as well as from a sentiment perspective. To wit:
“Let’s start with the dollar. The dollar is so extremely oversold, with a very large net-short position against it, that any event which causes a flight to safety is going to lead to a sharp counter-trend rotation in the dollar. While there is not a tremendous move in the dollar to the upside, the ramifications of that move would ripple through the current “reflation bets” of emerging markets, international, energy, and commodity stocks.” -12/15/2020 Portfolio Trading Diary
The table shows why a dollar rally could prove problematic for the S&P 500, crude oil, and their related stocks. As circled below, crude oil and the S&P 500 are running at relatively strong negative correlations to the dollar. Over long periods (bottom line) little to no correlation exists between these pairs. If the dollar reverses course and the negative correlation holds, crude oil and the S&P will surely decline. A dollar rally might also spell trouble for Gold, which also has a strong negative correlation, albeit near historical averages. If the dollar turns upward in a meaningful way, the port in the storm could be U.S. Treasury bonds, as there is no correlation to speak of between Treasury yields and the dollar.
Per Marketwatch: “The index of consumer confidence fell to 88.6 this month from a revised 92.9 in November, the Conference Board said Tuesday. Economists polled by MarketWatch had forecast confidence would rise to 96.7 in December. The index had hit 101.4 in October.” Given personal consumption is over 60% of GDP, this latest confidence survey, and its recent trend, serve as a warning that the recovery is in jeopardy. The survey was taken before the latest round of stimulus, so we will see if confidence, and hopefully spending, improve in the next round of surveys.
With another round of stimulus checks to households on the way, we were curious to see how many of our Twitter followers think that checks to the public become the norm. As shown almost three-quarters of those that replied think they will become a new fiscal tool for fighting economic slowing.
7:30 am ET
Corporate yields rose marginally on Monday despite the stimulus bill which takes away the Fed’s ability to buy corporate bonds without new Congressional approval.
As shown below courtesy of Goldman Sachs, Investment Grade bonds now yield a paltry 1.80%. At the same time, their duration has soared to nearly 9 years. In combination, the two figures point to a significant increase in the amount of risk in the corporate bond markets. Duration measures the change in price for a given change in yield. If yields were to rise from 1.8% to 3.8%, bond prices in aggregate would fall approximately 18%. That compares to an approximate 13% decline in 2018 for a similar 2% increase in yields. Investors are clearly putting a lot of faith in the Fed to ensure yields don’t rise significantly. At the same time, they are betting against the Fed being able to deliver meaningful inflation which would push yields higher.
Doublethink- Doublethink is a process of indoctrination whereby the subject is expected to accept a clearly false statement as the truth, or to simultaneously accept two mutually contradictory beliefs as correct, often in contravention to one’s own memories or sense of reality.
December 21, 2020
12:15 pm ET
The graph below shows economic activity has overtaken pre-COVID levels in China, while the U.S. and Europe have not only failed to regain lost economic activity but are losing momentum over the last few months. The combination of waning stimulus, stricter lockdown rules, and a much slower organic economic growth rate are the primary culprits driving the divergence.
The passage of a $900 billion stimulus bill appears to be a buy the rumor/ sell the event trade. Most U.S. equity indexes are down sharply but have recovered somewhat since last night’s lows. The S&P for instance is down 1.6% but about over 1% higher from the lows. The dollar and bonds are rallying, precious metals are flat, and crude oil is down over 3%. Also weighing on the market is a new more potent strain of COVID breaking out in England. Bear in mind, as discussed below, TESLA related rebalancing is also responsible for some of this morning’s volatility.
While $900 billion was widely expected the market appears to be concerned with some restrictions that the bill puts on the Fed. Per Zero Hedge: “But the Fed wouldn’t be able to replicate programs identical to the ones it started in March at the beginning of the pandemic without the approval of Congress; in short if the Fed is to restart any of the 4 emergency 13(3) programs and lending programs that are set to expire on Dec 31 (shown in red below), it will have to get Congressional approval. These four programs are the market corporate credit facility, the secondary market corporate credit facility, the Main Street lending program and the municipal credit facility.”
The Fed will not be able to buy corporate bonds without Congressional approval. Without the Fed backstop, and with spreads and absolute yields sitting at or near record lows, we expect corporate yields to increase.
7:15 am ET
Starting today, Tesla (TSLA) is a member of the S&P 500. Tesla represents about 1.5% of the index and is the 7th largest contributor (behind Google and in front of Berkshire Hathaway). We suspect the index will see some volatility today as a result of index rebalancing by many investors and funds. The inclusion of Tesla pushes valuation measures on the index higher due to the extreme valuations of Tesla. Tesla has a P/E north of 1300, versus 37 for the S&P.
After the market closed on Friday, the Fed announced it will once again allow banks to resume stock buybacks. JPMorgan immediately announced $30 billion of share repurchases. One must ask why the Fed continues to pump in massive amounts of reserves to the banking system via QE and at the same essentially admitting the banks have excessive levels of capital.
This week’s economic calendar is light. Of note will be Personal Income and Spending on Wednesday, and Jobless Claims on Thursday. Given the holiday, there are not many Fed members scheduled to speak.
Tesla’s price action was crazy in the last few minutes of trading before becoming an S&P 500 member.
2:20 pm ET
Much ado has been made about extremely low put/call ratios. While it is a concern as it highlights extreme sentiment, it is also worth noting that the ratio can stay low for a while. As shown below, the ratio was actually lower than current levels for a few years preceding the tech bust of 2000.
11:30 am ET
The price of crude oil continues to rise on a seemingly daily basis and is quickly approaching $50. Despite the steady gains energy stocks (XLE) have begun to lag. As shown in the graph on the right, the ratio of XLE to crude oil has fallen by nearly 10% in the past 6 trading days. The graph on the left shows the price of XLE and crude. Note that the last two significant increases in crude oil were preceded by strength in XLE. XLE might be ahead of the curve and signaling future weakness in oil prices. That said, energy stocks are up well over 50% since early November and grossly overbought on all technical readings. As such, a consolidation or decline should not be surprising despite improving fundamentals.
Stimulus negotiations are ongoing with a deal probable over the next few days. It is worth noting, that funding for the government lapses at midnight, and, as such, about 12 million people will lose their federal unemployment benefits in the coming week if a deal is not struck by Christmas.
Today is a quadruple witching day as a slew of stock and futures options expire. Per Goldman Sachs, almost 50% of all S&P options expire today. Goldman is not expecting fireworks as a good percentage of the options are well in the money.
December 17, 2020
10:50 am ET
A few weeks ago we shared the chart on the left which shows that when most investors expect a steepening yield, local highs in longer-term bond yields occur. We continue with the same yield curve expectations graph, but instead, compare it to gold prices over the last few years. As shown, when a large majority of investors think the yield curve will steepen, gold tends to show local weakness. Following two of the three prior peaks in expectations, gold prices surged. As we think about the yield curve, we must remember the Fed will only tolerate so much yield curve steepening, as higher long term interest rates are damaging to the economy. Might we once again be on the precipice of lower yields and higher gold prices?
8:40 am ET
Initial Jobless Claims rose 32k from last week to 885k, versus an expectation for a sizeable decline to 806k. The Philadelphia Fed Manufacturing Index also points to employment problems as the employment subindex fell from 27.2 to 8.5. The overall index also fell sharply from 26.3 to 11.1. Expectations were for a decline to 20. Housing Starts and Building Permits were both stronger than expected as record-low mortgage rates continue to drive the housing markets.
6:45 am ET
The U.S. dollar is opening up considerably weaker this morning at $89.80 and precariously sitting on an important support line in a wedge pattern. The next level of key support should be the lows of the first few months of 2018 at $88.50. A break below those levels could portend serious weakness for the dollar and renewed inflationary pressures. The flip side of the argument is that the same pattern of 2017/2018 is playing out again and the dollar will break higher.
The consensus estimate for today’s Initial Jobless Claims (8:30 am ET) has been lowered to 806k versus last week’s reading of 853k.
While stocks traded in a narrow range yesterday, bond yields were volatile. The 30-year Treasury bond opened Wednesday morning 7 basis points higher than Tuesday’s close. It then spent most of the session declining back to flat on the day. Upon Jerome Powell’s statement that the Fed has no plans to expand their purchases of long term bonds, yields rose back to the day’s highs. The spike higher did not last long and was met with an equal decline in yields. This trading activity is noteworthy as there seems to be a big buyer of bonds on every dip. Whether it is enough to reverse the recent trend higher in yields, however, has yet to be seen.
December 16, 2020
3:15 pm ET
Jerome Powell’s Press Conference Notes:
Per the Fed’s new economic projections, they expect unemployment to fall to 5% at end of next year and 4% by the end of 2022. The current rate is 6.7% and the pre-COVID level was 3.5%.
Half of the Fed members still see downside risks to their 2% inflation goal.
Powell links the maturity of bonds they purchase via QE with economic performance. If the economic recovery falters and the Fed thinks it needs “stronger accommodation” the Fed may likely shift purchases to longer-term bonds versus shorter-term bonds. Currently, he seems content with the distribution of maturities in their purchases. This statement explains the sell-off in bonds this afternoon.
Powell strongly supports and welcomes fiscal support.
High-frequency data shows the recent surge in COVID cases is slowing economic activity.
He is hopeful that the vaccine will help the economy run “strongly” in the second half of 2021.
The bottom line per Powell- “NO ONE SHOULD DOUBT’ FED COMMITMENT TO AID ECONOMY”
2:10 pm ET
The only statement change of note in the FOMC minutes was the following in regards to sustaining the Fed’s $120 bn QE pace- “until substantial further progress has been made toward the Committee’s maximum employment and price stability goals.” Prior to today, the statement based QE operations on credit market functioning and financial stability. Needless to say, QE will be with us for a long time. The red-lined statement is below. Click to enlarge.
9:15 am ET
Per Politico- “Congressional negotiators are on the brink of a coronavirus rescue package that would include a second round of direct payments, but would likely leave out state and local funding and a liability shield, according to multiple sources involved with and briefed on talks.”
This helps explain why stocks are maintaining their bid and bonds are trading weaker following the Retail Sales data.
9:05 am ET
Retail Sales were much weaker than expected as shown in the table below. With a consistent weakening theme emerging throughout the economy and higher interest rates, will the Fed discuss shifting more QE purchases to longer-term notes and bonds? Shifting purchases away from the Bill sector would also alleviate downward yield pressure on Treasury Bills as discussed in the comment below.
7:30 am ET
Chris Whalen, author of the Institutional Risk Analyst, put out an important article entitled Wag the Fed: Will the TGA Force Rates Negative. The gist of the article is that the Treasury pre-funded COVID relief efforts and end up borrowing more money than it spent. The Treasury now finds itself with a severely bloated account at the Fed (TGA) as shown below. The nearly $1.6 trillion cash balance should fall over time but will “remain well above historical norms.” Chris fears that if a sizeable stimulus bill can’t be agreed upon, the Treasury will reduce debt issuance and use the excess cash to fund expenditures. As a result of less debt issuance, primarily in the T-bill sectors, Fed Funds and short term rates could go negative.
In such a scenario, the Fed in its goal to manage Fed Funds within its 0-.25% target, would need to reduce QE to offset the Treasury’s reduced supply. “This bizarre situation illustrates the fact that once the FOMC turned to the dark side by embracing QE, it essentially lost control of monetary policy. More than ever before, the Treasury is the fiscal policy dog and the Federal Reserve System is the increasingly superfluous tail. “
It will be interesting to hear Jerome Powell’s response if he is asked about this problem at his 2:30 pm press conference.
December 15, 2020
2:20 pm ET
Stocks took a turn higher on stimulus optimism from Mitch McConnell. Per McConnell “We’re not leaving here without a covid package. It’s not going to happen. .. no matter how long it takes, we’ll be here”
It appears the best shot for passing a stimulus bill is a “lite” version of the $910bn bill that was in play last week. Currently, a $750bn spending bill is on the table with spending on more difficult aspects being put off until after the inauguration. Of the most noteworthy items are stimulus checks to individuals. It is likely a bill will contain more small business support, a continuation of unemployment programs, and possibly an extension of student loan forbearance and the housing eviction ban.
The market feels like it wants to run on a deal announcement but will a watered-down deal pass muster?
8:20 am ET
In the most recent December Oil Market Report, the International Energy Agency (IEA) downgraded its 2021 oil demand forecast by 170k barrels per day, in large part (80%) due to jet fuel and kerosene. Essentially the agency believes it will take longer than the market expects for the vaccines to bring normality to daily lives.
“The understandable euphoria around the start of vaccination programmes partly explains higher (oil) prices but it will be several months before we reach a critical mass of vaccinated, economically active people and thus see an impact on oil demand. In the meantime, the end of year holiday season will soon be upon us with the risk of another surge in Covid-19 cases and the possibility of yet more confinement measures“
7:30 am ET
With the December Federal Reserve Monetary Policy meeting kicking off today, an update on Fed Funds futures is worthwhile. Currently, the front contract, December 2020, trades at .08%, and the monthly contracts out through October of 2021 sit at the same level. Beginning in late 2021 the rate increase ever so slightly. By July 2022, the rate is .10% and about .14% by year end 2022. Essentially, the market is saying there will be no rate hikes in 2021 and an approximate 33% chance of a 25bps hike by the end of 2022. These prices can change rapidly, but for now, it appears the Fed has made it clear to traders they have no intent on raising rates anytime soon. As we will likely hear tomorrow, the odds a reduction in QE amounts in the near future are also very slim.
The chart below shows why a renewal of the stimulus CARES Act is so important. Per Liz Anne Sonders (Charles Schwab) -“When CARES Act protections run out, many landlords will have no choice but to evict some tenants”
December 14, 2020
2:30 pm ET
The surge of housing prices in the suburbs is being partially offset with sharp declines in urban housing activity. The graph below shows rents in Manhattan have fallen by nearly a third and are now back to levels from ten years ago.
12:20 pm ET
A few subscribers have asked us for more information on SPACs. As such, we share the following short video from the Financial Times.
As shown below, the Euro (versus the USD) has been in a downtrend for 12 years. Since 2008, the upper end of the trend is defined with a series of lower highs. Currently, the Euro is bumping up against a significant resistance trend line (gold line). If it can breach resistance and 1.25 to the dollar (red line), the prior high from 2018, significant dollar weakness may lie ahead. That said, the dollar is grossly oversold and bearish sentiment is extreme, so at least in the short run, we suspect resistance will hold.
8:00 am ET
19 IPO’s have doubled on their first trading day in 2020. There were a total of 25 IPO’s that did that from 2010-2019!!
Per the graph below, courtesy of Bloomberg, over 80% of IPOs issued this year have negative earnings. Despite questionable fundamentals, opening day trading returns on IPOs this year are the highest in 20 years. Bottom line: investors are chasing hope and promise with no regard for risk. The riskiest of assets have been the best performers as of late- IPO’s, SPACs, and zombies.
7:15 am ET
This week’s significant economic data will include Retail Sales on Wednesday, and Initial Jobless Claims Thursday. After a relative paltry gain of 0.3% last month, November Retail Sales are expected to decline by 0.3%. The forecast for Jobless Claims is also concerning, showing a further rise after last week’s large gap higher.
The Fed will meet Tuesday and Wednesday, with the FOMC statement of monetary policy and Powell press conference at 2:00 pm and 2:30 pm respectively. It is possible the Fed downgrades the current status of economic activity and possibly their 2021 growth forecast. The wild card will be whether the Fed discusses additional QE and/or other forms of monetary stimulus to counteract the slowing recovery and lack of additional fiscal stimulus.
“Construction aggregates form the backbone of much of the infrastructure making up today’s world. Headquartered in Alabama, Vulcan Materials Company (VMC) is the leading producer of construction aggregates in North America, primarily dealing in crushed stone, gravel, and sand.”
12:30 pm ET
As shown in the Energy Information Administration (EIA) table below, this past week saw a sizeable build of oil inventories, predominately due to imported oil. Regardless of this recent trend, the price of crude oil continues to grind higher. In a nutshell, demand is not keeping pace with the increasing stocks of oil. We suspect the price of crude oil has limited upside unless demand picks up meaningfully. Inventories are still down versus 2019 levels, but on a longer-term basis, they are running decently higher than average. Per the EIA’s weekly report:
“At 503.2 million barrels, U.S. crude oil inventories are about 11% above the five year average for this time of year.”
“Total motor gasoline inventories increased by 4.2 million barrels last week and are about 5% above the five year average for this time of year.”
“Distillate fuel inventories increased by 5.2 million barrels last week and are about 11% above the five year average for this time of year.”
Propane/propylene inventories decreased by 4.1 million barrels last week and are about 4% above the five year average for this time of year.”
10:30 am ET
University of Michigan Consumer sentiment rose but inflation expectations, both near term and long term, fell. With CPI, PPI, and now the Michigan consumer survey pointing to price stagnation, it may only be a matter of time before the inflationary stock market rotation comes to an end.
PPI, like CPI, shows no signs of inflation pressures. Core PPI was +0.1%, matching consensus. Year over year the Producer Prices are only growing +.08%.
7:30 am ET
The chart below, courtesy of Bull Markets, shows that the ratio of insider buying versus insider selling is at or near record lows. Per the report- “There were only 8 other historical cases in which the S&P 500 Insider Buy/Sell ratio was this low. The S&P 500’s forward returns over the next 2-6 months were poor and usually faced pullbacks/corrections.” Lastly- “Corporate insiders are incredibly good at trading their own stocks. They know their companies’ situation better than outsiders do, and thus can profit from this information-advantage. Corporate insiders have a consistent track record of buying their stocks near market bottoms and selling their stocks near market tops.”
The yield on Portugal’s ten-year Notes and Australia’s Treasury Bills turned negative this past week, pushing the amount of global negative-yielding debt above $18 trillion, a new record. The increasing yield spread between most developed sovereign debt and U.S. Treasuries has the potential to create a surge in demand for U.S. Treasuries on any sign of economic weakness and/or the emergence of a stronger dollar trend. For foreign buyers of assets denominated in the dollar, a weaker dollar reduces their returns and can partially or fully negate the benefit of the higher yield. The opposite holds true when the dollar is stronger versus the investor’s home currency.
December 10, 2020
12:15 pm ET
In the latest sign of market exuberance, DoorDash (DASH) went public on Wednesday at $102 per share and closed the day at $188, leaving it with a market cap of approximately $60 billion. Today, Airbnb (ABNB) IPO’d at $68 and the stock is indicated to open later today at $145. With a potential market cap of over $100 billion, Airbnb is now the world’s largest online travel company.
9:05 am ET
CPI was slightly higher than expected, increasing 0.2% last month versus 0.0% the prior month, and expectations for a .01% increase. Year over year CPI and CPI excluding food and energy were both unchanged at 1.2% and 1.6% respectively. Unlike what the equity markets seem to be pricing in, there are few signs of actual inflation. That said, official inflation data tends to lag, so we must also keep an eye on alternative price data.
Due to our large trade deficit with China, it is worth noting that China’s most recent CPI report was -0.5%, the first time it turned negative in over 10 years.
The charts below, courtesy of Brett Freeze, show that year over year inflation, broken down between commodities and services, is not showing an inflationary push.
9:00 am ET
Initial Jobless Claims rose sharply to 853k from 712k, and well above expectations of 724k. The increase brings the weekly number of newly unemployed back to levels from mid-September. The non-seasonally adjusted number was also much higher at 947k versus 718k last week. Of concern, continuing claims increased from 5.53k to 5.76k. The upward trend may continue in the coming weeks due to new COVID lockdowns.
8:00 am ET
As expected, the ECB increased the size of its Pandemic Emergency Purchase Program (PEPP), aka QE, by 500 billion euros through March of 2022. They will also re-purchase maturing bonds through 2023, effectively keeping the size of the program intact for three years. Even with the increase, ECB asset purchases are still only running at about a quarter of the pace of the Fed. The initial reaction in the currency market is a strengthening of the euro versus the dollar.
7:30 am ET
The table below shows the consensus expectations for the CPI report due out at 8:30. Jobless Claims, also out at 8:30, are expected to rise from 712k last week to 724k.
December 9, 2020
12:00 pm ET
With 300-year low yields for bonds and zero returns on cash, investors have no choice but to chase stocks. That is the popular justification at least. The graph below shows that is exactly what investors are doing. Equity allocations amongst four major investor groups are nearly the highest ever, while allocations to bonds and cash are at the lower end of historical allocations. While the narrative’s logic makes sense at first blush, investors would be wise to consider current valuations and the expected returns for equities.
In today’s article, Half Truths are Half Lies By Definition, we explore the common misconception that lower interest rates are necessarily good for stock prices.
“As such, the expected returns per unit of risk greatly favor bonds, even bonds with near-zero yields. Bonds may be rich, but stocks are richer.”
11:15 am ET
The BLS JOLTs data reiterated the slowing progress of job gains as we saw in the monthly payrolls report. There are now 4.2 million unemployed workers than there are job openings. The reports also shows that hiring has slowed dramatically since June and is now lower than before COVID lockdowns occurred. This is a tough situation given the huge amount of jobs that need to be filled to get unemployment back to pre-COVID levels.
Per the BLS: “The number of job openings was little changed at 6.7 million on the last business day of October, the U.S. Bureau of Labor Statistics reported today. Hires were little changed at 5.8 million while total separations increased to 5.1 million. Within separations, the quits rate was unchanged at 2.2 percent while the layoffs and discharges rate increased to 1.2 percent.”
9:15 am ET
The U.S. Treasury will auction $38 billion of 10 year notes this afternoon and $24 billion of 30 year bonds tomorrow. Both auctions are $3 billion shy of last month’s record-sized auctions. Yields are higher this morning as banks/dealers that bid in the auctions frequently short notes and bonds to hedge what they will buy in the auction. The weaker the end-user demand the more hedging is required.
7:00 am ET
Yesterday’s exuberance was sponsored by the Russell 2000 small-cap index. The index rose 1.5%, over 1% more than the larger cap S&P, Dow, and NASDAQ indexes. The graphs below show the Russell index (IWM) is now 2.5 standard deviations and 31% above its 200-day ma. Notable, the difference between the upper and lower Bollinger Bands (2.5) is now 50%. As you can see it is common for the index to hit the upper band and ultimately retreat to the lower band. The index can certainly go higher, but the risk is palatable at current levels.
December 8, 2020
1:45 pm ET
In yesterday’s commentary, we presented a few facts on Tesla’s valuation and shared some views on what needs to occur to justify current valuations. Of them were 1) Tesla becomes the world’s dominant automaker 2) Other automakers, including upstarts, can not create viable electric vehicle competition. This morning we saw the following headline- “In the year 2026 will be the last product start on a combustion engine platform,” Michael Jost told the Handelsblatt automotive summit conference at Volkswagen’s headquarters in Wolfsburg, Germany, NBC News reported. Either Volkswagen fails miserably in the EV market or Tesla has real competition. Many other automakers are also aiming to reduce combustion engine production in the coming years.
12:45 pm ET
The chart below, courtesy of Sven Henrich @northmantrader, shows the Russell 2000 is now in unchartered bullish territory. On a monthly basis, the Index is 3% above two standard deviations, an occurrence that has not happened since at least 2000. At the same time, the Percentage Price Oscillator (PPO) is also at a 20 year+ high. Similar to the MACD, the PPO is a momentum oscillator that measures the difference between two moving averages as a percentage of the larger moving average. The CPCE indicator, at the bottom, is the put/call ratio, showing that investors are buying calls at nearly three times the rate as puts. To quote Sven- “We have nothing to fear but the lack of fear. And maybe gravity.“
10:05 am ET
The chart below, courtesy Otavio Costa, shows investment-grade corporate bonds now provide a lower yield than inflation expectations. A few things worth considering:
Current yields do not factor in potential losses due to credit events. As such actual yields will be lower than advertised.
Assuming inflation expectations are correct or underestimate inflation, investors holding investment-grade bonds will lose purchasing power with their “investments.”
Lower spreads typically occur when investors are comfortable with the economic outlook. Today we are in a recession and all but guaranteed to have slower economic growth over the next ten years.
Notice the exact opposite behavior between the current instance and that of the Financial Crisis in 2008. For what it’s worth, the anomaly is today’s instance, not the 2008 experience.
Strategas recently polled 54 fixed income analysts about their yield forecast for 2021. Only 4 of the 54 analysts believe that the 10-year UST yield can get above 1.50%. Like most of these analysts, we believe yields will stay very low as the Fed has little choice but to keep them low if they are to keep the economy humming. That said, we are well aware of Bob Farrell’s rule #9 “When all the experts and forecasts agree — something else is going to happen.”
December 7, 2020
3:30 pm ET
Canceling student debt as a “stimulus” of sorts has been raised over the last few weeks. Recently, the CRFB wrote a great article showing that canceling student debt is far less effective than other forms of stimulus. To wit:
Student debt cancellation will increase cash flow by only $90 billion per year, at a cost of $1.5 trillion.
Student debt cancellation is poorly targeted to those most likely to spend, given that nearly three-quarters of repayments would come from the top 40 percent of earners.
Forgiving the full $1.5 trillion in loans will likely boost economic output during the current downturn by between $115 and $360 billion, a multiplier of 0.08x to 0.23x.
Partial loan forgiveness would cost less than total forgiveness but also offer a smaller economic boost. We don’t expect a significant improvement in the multiplier.
Simply extending the current executive action to defer loan repayments and cancel interest would achieve much of the economic benefit of loan cancellation at only a very small fraction of the cost.
There are a number of benefits and costs associated with canceling student debt. But as a stimulus measure, its “bang for the buck” is far lower than many alternatives under consideration or the COVID relief already enacted.
Tesla’s (TSLA) stock has risen over 600% this year, including a surge over the last few weeks as it was announced Tesla will be joining the S&P 500. As shown below, Tesla now has a market cap equal to the next 6 largest automakers combined, yet it only has 1% of the market share of those automakers in aggregate. For Tesla to have a sales/market cap ratio equal to the average of the top 6, they would need to sell 39 million cars per year. To put that differently they would need to sell 60% of all cars sold in the world. At current valuations, Tesla shareholders are betting on the following:
Tesla becomes the world’s dominant automaker
Other automakers, including upstarts, can not create viable electric vehicle competition
Electric vehicles become a large majority of cars sold globally
The U.S. and/or other countries do not enforce monopoly laws
With inflation expectations on the rise, and stocks rising on a reflation narrative, the market will get to see if actual inflation is picking up this coming week. On Thursday, the BLS will release CPI and follow it up Friday with PPI. The current consensus estimate for CPI is +1.1% annually versus 1.2% last month. We will also keep an eye on the inflation expectations component of the University of Michigan survey on Friday, to see if consumers believe inflation is brewing. Other than inflation, the JOLT report due on Wednesday, and Initial Jobless Claims on Thursday, will help better assess the employment picture.
The graph below shows yet another market anomaly and the extreme technical levels many indexes are reaching.
The graph below, courtesy of Brett Freeze, helps explain why negative real rates dampen economic growth. The green shaded areas in the graph represent periods in which the yield on the 3 month Treasury Bills was below the expected inflation rate. In other words, anytime real rates are negative. As shown by the blue line, productivity growth tends to decline when real yields are negative and increase when positive. Currently, the implied rate of inflation is 1.86% and the 3-month Bill trades below .10%, meaning real yields are -1.76%. For more on the importance of productivity to economic growth, we share an article we wrote in January of 2019 – Productivity: What it is & Why it matters.
“As the pandemic and associated lockdowns have temporarily transformed the economy, many companies have been forced to adapt to new challenges by managing employees remotely. Cornerstone OnDemand (CSOD) provides software-as-a-service (SaaS) to firms, which may help them through some of these challenges.”
9:10 am EST
The BLS jobs report showed a further deceleration in jobs growth with payrolls growing by only 245k versus expectations of 500k, and a revised lower 610k last month. The unemployment rate fell from 6.9% to 6.7% but largely due to a decline in the labor participation rate from 61.7% to 61.5%. The labor force shrunk by 400k accounting for the drop.
The graph below, courtesy Evercore ISI, shows that at the current pace of job gains, employment will not get back to February levels for about four years. The current gap is approximately ten million jobs.
The following are a few interesting facts:
21.8% of employees teleworked in November, up from 21.2% in October
The household survey declined in November by 74k
The number of people out of work for more than 6 months increased by 385k to just under 4 million
The participation rate has been steady for the last 6 months at about 2% below the pre-COVID running rate
The article linked above from Bloomberg provides a nice summary comparing the two stimulus plans currently being debated by Congress. A deal will probably get done but any such deal will likely fall short Democrat lawmakers and Biden expectations. As such we should expect renewed stimulus discussions following the inauguration.
December 3, 2020
4:20 pm EST
PFIZER EXPECTS TO SHIP HALF THE DOSES IT HAD ORIGINALLY PLANNED AFTER FINDING RAW MATERIALS IN EARLY PRODUCTION DIDN’T MEET ITS STANDARDS – WSJ
That headline caused the market to give up decent gains and close flat on the day.
1:15 pm EST
The Bureau of Labor Statistics (BLS) seasonally adjusts monthly employment data to smooth it over time. In the retail trade sector, which is heavily influenced by holiday spending, they traditionally apply a negative multiplier to the number of retail jobs added in November and December and a positive multiplier to almost every other month. For instance, in 2019, payrolls in retail trade increased by 432k from October to November, however when seasonally adjusted it actually fell by 14k. In normal times these adjustments are easy for economists to factor into their forecasts.
This year will be very different. In the last two years the BLS reduced the actual number of retail of jobs by 2.8% or approximately 450k jobs. If economists use the same seasonal adjustment factor this year and a lower estimate for the number of jobs added than years past, they run the risk of underestimating retail employment. Seasonal adjustments hold true for all employment sectors. As such, we suspect the actual number of net jobs reported from the BLS and economists expectations could vary widely tomorrow.
10:30 am EST
Below is yet another chart for our recent collection showing just how exuberant markets have gotten.
8:50 am EST
Initial Jobless Claims fell nicely to 712k from 787k last week. Claims are now back to the same level as the beginning of November. Given typical hiring tendencies around Thanksgiving, Black Friday, and Christmas as compared to this year, we suspect seasonal adjustments to the data will flaw the output. Seasonal adjustments are also likely to have a big effect on tomorrow’s BLS employment data.
6:40 am EST
The graph below is yet another indicator showing the current state of extreme sentiment and fearlessness by investors. In the words of Peter Atwater- “At peaks in sentiment, it is less an abdication of risk management than it is the belief that there are no risks.“
December 2, 2020
3:00 pm EST
The graph and commentary from The Market Ear paint a grim picture of Black Friday spending. Credit Card spending, based on data from JPM Chase cards, shows a significant 8%+ reduction from the same period last year. While some decline is expected, the size of the decline is very surprising given that online spending (almost all credit based) increased 20% versus last year.
2:10 pm EST
Gasoline demand has rebounded sharply from the March-April lows but still remains about 10% below where it was running pre-COVID. Clearly, a vaccine and return to more normal activity levels will boost demand further, but will the work-from-home trend result in a more permanent reduction in gasoline demand?
12:20 pm EST
Analysts are expecting a 43% decline in international students enrolling in U.S. colleges this fall. Foreign students typically pay full tuition and room and board. Colleges, lacking this income, will have to rely on their endowments, donations, and will also likely be under pressure to raise prices. The graph below shows how the cost of education has easily outstripped CPI over the last 25 years
8:30 am EST
The ADP jobs report fell well short of the +440k estimate, coming in at 307k. While still a very strong number, the weakening trend along with the bump up in jobless claims and weak ISM employment data is a reason for concern. The correlation between ADP and the BLS employment report, while traditionally strong, has been weak throughout this recovery. As such we must not read too much into ADP, however, we would not be shocked if this Friday’s BLS report is well below expectations given holiday seasonal adjustment factors and recent aforementioned labor trends.
7:25 am EST
A stimulus package is in the air again-
MCCONNELL SAYS WAITING UNTIL NEXT YEAR FOR FRESH COVID-19 RELIEF “IS NOT AN ANSWER”
Bipartisan Senate group to unveil $908B stimulus compromise. Details fluid
BIDEN on stimulus: “Any package passed in lame-duck session is – at best – just a start”
CNN posted a nice summary of recent negotiations, their importance, and the roadblocks they potentially face. Below are two key paragraphs:
“There are only two weeks left on the legislative calendar. That doesn’t mean members couldn’t stay longer on Capitol Hill and try to sort out an agreement before Christmas. But, the only hope for a stimulus deal right now is to attach it to the spending bill that has a deadline of December 11.”
“Congress might be able to kick the can down the road for a few days, but at the end of the month, there is a massive cliff when the expiration of unemployment benefits, student loan payment deferrals and a federal eviction moratorium all run out.”
WHAT DOES A +10% MONTH MEAN HISTORICALLY? WE LOOK BACK 70 YEARS.
Last month the S&P500 was up 10.75%. There are many analysts and pundits out with their own take on what that means for stocks going forward. Many analysts like Tony Dwyer of Cannacord believe we are in for a “choppy stretch ahead” and that “the ramp has become a little too extreme.” Sam Stoval of CFRA sees muted gains for December after a 10% gain in November.*
Many of TPA’s indicators in the Canaries in the Coalmine and Marketscope are also flashing extreme alerts, but historically the numbers tell a more nuanced tale of what to expect.
TPA looked at the past 70 years of monthly performance for the S&P500. Before November 2020, there were 12 times in which the S&P500 has registered gains of 10% or more. TPA looked that the performance for the next 1, 2, and 3 months after a +10% month to tease out any patterns. TPA then looked at all months since 1950 to compare the average performance to that following an up 10% month. The results are not overwhelming, but certain patterns do appear.
Results:
The month after the +10% month has an average performance of 0.60% and is positive 50% of the time.
The average performance of 0.60% for the month after the 12 occurrences of an +10% month is slightly less than the 0.70% performance for the entire sample of 836 months.
The month after a +10% occurrence is less likely (50%) to produce a positive performance than after a normal month in the 70 years (positive 60% of the time).
If you move out further away from the +10% month, however, the evidence for better than average performance increases. The average 3-month performance after a +10% month is +4.73%, while the normal average performance is just +2.11%.
In addition, the chance of positive performance for the 3 months after a +10% month is higher, 75% of the time, versus only 65% of the time for all 836 months.
Although these results are far from conclusive, TPA’s takeaway would be that there could be a short-term pullback due to extremes, but the chances are pretty good that 3 months from now the S&P500 will be higher.
11:00 am EST
The ISM manufacturing survey was slightly weaker than expected at 57.5 versus expectations of 58 and a prior month reading of 59.3. While sliding, the index is still well into expansionary territory so the decline should not be overly concerning. The only real blot on the report was the employment sub-index which fell back into contraction at 48.4 vs. 53.2 last month. The PMI survey was unchanged from last month at 56.7.
The chart below shows the 11.84% gain for the Dow Jones Industrial Average in November was the largest monthly gain since January of 1987. It was also the only time in at least 50 years in which the index was up over 10% in two months within the same year. The index has seen its fair share of losses and volatility as well this year. On a 6-month annualized basis, the recent instance has witnessed greater volatility than any time since late 1987 and early 1988.
7:30 am EST
The graph below shows that short interest, as a percentage of market cap, is now well below anytime in at least the last 15 years. The reduction in short interest provides a boost to the market as those that were short have had to buy back stocks to cover their shorts. The flip side is that active traders that can trade from the short side now have plenty of room on their books to initiate short sales.
November 30, 2020
2:30 pm EST
With Bitcoin hitting record highs we have gotten a few emails and calls asking our thoughts. In particular, one reader asked if GBTC is a good proxy for holding bitcoin? Without going into details of the trust, the primary problem with the ETF is that it trades at an enormous 100% premium ($18.83 vs $9.1) to the value of the bitcoin it holds. The premium could easily collapse to fair value and result in a 50%+ decline despite no movement in the price of bitcoin. Below the table please find our thoughts on Bitcoin.
The two graphs below help explain why gold prices have been declining recently. The graph on the left shows the strong correlation between gold and real rates. Real rates are nominal Treasury yields less inflation expectations as implied from TIPs. The scale on real rates is inverted to highlight the correlation. Over the last 3 months, real rates have risen 22bps and gold has declined by almost $200.
The second graph shows the composition of the change in real rates since September. The 10yr real rate rose 22bps from -1.08% to .86%, almost entirely due to nominal 10yr yields rising 20 bps. Implied inflation expectations over the period fell 2 bps. If you think yields can keep rising without inflation expectations rising, real rates will increase and gold should continue to trade poorly. If bond traders start buying into the equity reflation trade, real rates may fall, or stabilize, as inflation expectations rise.
10:15 am EST
The chart below, courtesy of John Hussman, compares today’s extreme level of market exuberance, using his indicator, to the last time the market reached such levels in 1999.
The state of the economy, COVID lockdowns, and political wrangling over additional stimulus to consumers should weigh on holiday spending this year. Early Black Friday estimates show foot traffic at retailers was down over 50% while online shopping rose by over 20%. Again, typical seasonal spending patterns will sharply deviate from years past, so we must be careful reading too much into early spending data. The National Retail Federation forecasts a 3.6% increase in holiday sales versus last year. The map below, along with jobs data, and the fact that there will no stimulus given to consumers before the end of the year, makes such a rosy forecast hard to believe.
7:15 am EST
Starting today, with the Chicago PMI and followed up tomorrow with ISM and PMI, the state of the manufacturing sector will be reported on. Chicago PMI and ISM are expected to slip slightly but stay well in expansion territory. The ADP labor report is scheduled for Wednesday, followed by the all-important BLS payrolls report on Friday. ADP and the BLS are both expected to show net payroll growth of 450-500k jobs.
Jerome Powell is scheduled to speak at 10 am on both Tuesday and Wednesday, along with a host of Fed speakers throughout the week. It will be interesting to see if he, or other speakers, bring up Janet Yellen’s appointment as Secretary of Treasury and what that might mean for future Fed-Treasury working relations.
We stumbled upon the picture below showing prices of certain goods from 1938. We made the table below it to compare today’s prices and the ratio of prices to income. As shown, the ratio has increased substantially in all 6 instances, meaning goods are more expensive today on an income adjusted basis. Any wonder why consumer debt has exploded?
7:30 am EST
Bloomberg recently published an article entitled America’s Zombie Companies Have Racked Up $1.4 Trillion Of Debt. The article discusses how Zombie companies have grown substantially due to the COVID recession. They state that over 200 corporations of 3000 analyzed have recently joined the ranks of Zombies. “Even more stark, they’ve added almost $1 trillion of debt to their balance sheets in the span, bringing total obligations to $1.36 trillion. That’s more than double the roughly $500 billion zombie companies owed at the peak of the financial crisis.” Adding more debt to entice economic activity and stave off bankruptcy is part of the Fed and government playbook. What they repeatedly fail to understand from such policy is the unintended longer-term consequences. Per Bloomberg: “policy makers may inadvertently be directing the flow of capital to unproductive firms, depressing employment and growth for years to come, according to economists.”This is one reason we believe GDP growth will necessarily be slower in the coming economic expansion than it was in the last.
***Reminder- The NYSE will close at 1 pm and the bond markets will close at 2 pm. With no economic data or Fed speakers, and many traders taking the day off, today’s trading sessions should be quiet.
November 25, 2020
3:30 pm EST
The FOMC minutes from the November 5th meeting were just released. While the minutes largely duplicate Chairman Powell’s press conference and many speeches by Fed members in the days following the meeting, there seems to be an emerging concern that massive amounts of liquidity might distort markets. The Fed would never tell us their actions have already distorted markets but equity valuations, credit spreads, and the housing market to name a few markets, have the tell-tale signs of Fed actions. To wit (per Zero Hedge):
Several participants noted the possibility that there may be limits to the amount of additional accommodation that could be provided through increases in the Federal Reserve’s asset holdings in light of the low level of longer-term yields, and they expressed concerns that a significant expansion in asset holdings could have unintended consequences.
A few participants expressed concern that maintaining the current pace of agency MBS purchases could contribute to potential valuation pressures in housing markets.
2:15 pm EST
Tesla will be joining the S&P 500 on December 21st as the 7th largest company in the index. Its stock price and valuation have gone well beyond what is justified using fundamental metrics of other car companies. With such an extreme valuation, a headwind facing shareholders going forward is competition. As shown below, the number of new electric vehicle (EV) launches in 2021 is expected to be 60, nearly double that of 2020, which was triple that of 2019. By market cap, Tesla is the world’s largest car company, but as measured by sales, they are dwarfed. Two important questions facing TSLA shareholders are 1) will EV command a large market share of all auto sales? & 2) can other car companies compete with TSLA?
The following graphs show that most sectors and factor/indexes are grossly overbought (>80%). The S&P graph at the bottom right shows the index is now more overbought than any time since the rally began in March.
8:58 am EST
Initial Jobless Claims rose again to 778k from 748k last week and 711k the week before that. Total claims, including Federal assistance, stand at 20.452 million, a slight uptick from last week. The 20.452 million total claims imply an approximate 13% unemployment rate.
In another market rarity, 91% of S&P 500 stocks are now trading above their respective 200 day moving averages. The last time this occurred was 6 years ago.
The graph below, courtesy of Brett Freeze, compares 6-month changes in the quantity, velocity, and total system liquidity to the movements of the U.S. dollar (inverse scale). When liquidity is rising, the dollar tends to fall and vice versa. Currently, we are witnessing the rate of liquidity change declining (green line). This will continue assuming the Fed and other central banks do not do more QE, but keep injecting the same amount or possibly less liquidity into the system. If this occurs, total system liquidity (TSL- green line) will continue to decline which should boost the dollar (gold line).
November 24, 2020
4:35 pm EST
Dick’s Sporting Goods (DKS) reported quarterly earnings today before the market open. DKS reported quarterly revenue of $2.41B (+23% YoY), which beat analyst estimates by $180M. Further, the company reported GAAP EPS of $1.84, which beat estimates by $0.80. The strong quarterly results came on the back of surging e-commerce sales (+95% YoY). Despite reporting a great quarter, the stock closed modestly higher, up 0.3% on the day.
Equity mutual funds are “all in” so to speak. The graph below shows total assets at a record high while liquid assets (cash) have fallen to levels last seen in 2013. Cash now accounts for only 2.2% of assets, nearly half of where they were 8 years ago.
12:10 pm EST
Per The Market Ear, “abandon puts- put/call ratio needs no commenting.”
10:40 am EST
Consumer Confidence fell from 101.4 to 96.1. The index remains well off the pre-COVID highs of 131. The University of Michigan Consumer Sentiment Index also shows a lack of consumer optimism about their economic prospects. Weak confidence does not appear to be slowing homebuyers. The Case Shiller Home Price Index (20 city composite) was up at an annualized rate of 6.6%, a further gain from +5.3% last month. This month’s increase was the largest in over 5 years. The pricing surge is in large part due to record-low mortgage rates, pent up demand from the spring months, and a record low 2.5 months of housing inventory (NAR).
8:26 am EST
The graph below shows three reliable measures of bond market inflation expectations. Despite the reflation trade in the equity markets occurring over the last few weeks, all three measures in the graph imply no such change in the inflation expectations of bond traders/investors.
7:11 am EST
In a CNBC interview Janet Yellen, Treasury Secretary nominee, finally laid the groundwork for what we knew was eventually coming. “It would be a substantial change to give the Federal Reserve the ability to buy stock,” Yellen told CNBC’s Sara Eisen on “Squawk on the Street.” “I frankly don’t think it’s necessary at this point. I think intervention to support the credit markets is more important, but longer-term it wouldn’t be a bad thing for Congress to reconsider the powers that the Fed has with respect to assets it can own.”
6:45 am EST
Typically at this time of year investors are eagerly anticipating Black Friday sales figures as they serve as an indication of the pace of holiday sales. This year will obviously be very different as a much larger percentage of sales will be online. The thrill and urgency of finding bargains in the early morning hours on Black Friday will be replaced with at-home online shopping at the buyer’s convenience. As such, we must be careful about interpreting and extrapolating early sales data.
Its official– President-elect Joe Biden plans to nominate former Federal Reserve Chair Janet Yellen to serve as his Treasury Secretary. This is a big deal as it will further strengthen the relationship between the Fed and the Treasury.
1:30 pm EST
Equity Market to Harvest Best November Since 1933
by CIO Larry Adam/Raymond James
• #4: Equity Market Harvesting New Post-COVID Highs | The equity market had a strong start to 2020 due to trade resolutions, but ever since the ~34% virus-induced decline, the S&P 500 has notched 11 new record highs and the strongest start to a bull market due to an improving macroeconomic backdrop, stronger than expected earnings, and positive vaccine developments. With supportive factors still in place, we maintain a positive outlook for equities over the next 12 months.
• #8: Seasonality Sweet as Apple Pie | The S&P 500 has rallied nearly 9.7% so far this month, more than 5x the index’s average November return over the last 30 years. In fact, at this juncture, the S&P 500 is having its best November since 1933! Seasonal trends should continue to support the equity market, since the November to April timeframe is historically the best 6-month period, with the S&P 500 posting an average return of 7.7% and being positive 83% of the time.
10:50 am EST
The graph below shows that the Goldman Sachs Financial Conditions Index (GSFCI) is at its lowest level in at least 25 years, denoting ease in the ability to borrow. The shaded bars highlight periods where the GSFCI was weak, along with poor market breadth, high volatility, and toppy valuations. As shown, this condition can persist for a while but it’s not likely to end well for the S&P 500.
The chart below shows AAII Bullish Sentiment has recently surged to prior peaks. More interesting is that those investors claiming to be neutral, neither bullish nor bearish, are at levels typically seen when sentiment is decidedly bearish. This data set is just another quirk in a long line of anomalies we are witnessing in the markets.
7:40 am EST
For the third Monday in a row, we wake up to a new COVID vaccine and the markets rallying in response. This week AstraZeneca released news that their vaccine is 70% effective.
Economic data will be light this week due to Thanksgiving. Today at 8:30 the Chicago Fed National Index, covering 85 indicators of economic activity, will be released. The consensus is 0.1, versus 0.27 last month, and a three month average of 1.33. This index likes others points to a stalling of the recovery. Durable Goods and the Fed Minutes from the last FOMC meeting will be released on Wednesday.
“RTX has been on a wonderful run since the encouraging news broke on the vaccine front. After a 22% gain since the beginning of November, we believe the stock is slightly overvalued. Based on our forecasts, RTX has roughly 4% of downside remaining before reaching its intrinsic value.”
The graphic below shows that the two frontrunners in the betting markets for the next Secretary of Treasury are former Fed Chair Janet Yellen and Current Fed President Lael Brainard. It appears that the link between the Treasury and the Fed will only grow stronger in the years ahead.
10:34 am EST
New Post
MacroView – A Vaccine and the NEW New Normal.
While $PFE and $MNRA announced potential vaccines, it won’t fix the damage caused by the lockdowns. While the #economy will recover, it will be a new normal that is weaker than the old “new normal.”
On a relative basis versus the S&P 500, the reflation sectors (Materials, Industrials, Banks, Energy, and Transportation) remain the most overbought. Tech and traditional lower beta conservative sectors (Staples, Utilities, Healthcare, and Realestate) are slightly oversold versus the S&P. If you are looking to fade the reflation trade, Tech and Momentum are the most oversold indexes versus the S&P.
Utilities were the most overbought sector a few weeks ago. At the time we reduced our exposure to the sector and recommended doing the same. It has underperformed the S&P 500 by 5.35% over the last 20 days. XLU is not grossly oversold but bears closely watching to potentially add back positions. It is the only sector or index below its 20 day moving average.
Treasury Secretary Mnuchin is declining to extend most of the Fed’s emergency credit programs beyond December 31st, and he is asking the Federal Reserve to return all of the capital ($598 billion) allocated to unused CARES Act lending programs. While these programs are not being used extensively, this action will on the margin hurt the credit markets. In the words of Jeff Gundlach- “So the training wheels are coming off.”
Initial Jobless Claims rose for the first time in four weeks to 742k, from 711K last week. We suspect the next two months of Jobless Claims and the next two BLS employment reports will be difficult to decipher as seasonal adjustments will not accurately account for the difference between normal seasonal hiring patterns and COVID related hiring. Clearly, many retail service industries will hire less this holiday season than in years past. That said, companies like Amazon and UPS will need to hire additional staff beyond what is average.
Expectations for a steeper yield curve have only been this high three other times in the last 15 years. As shown below, in all three instances, the yield curve flattened considerably shortly thereafter. Given that short term rates are stuck near-zero due to Fed policy, overwhelming investor expectations may be a warning that 10-year UST yields are about to decline sharply. One potential driver of a flatter yield curve is the Fed. To wit, MarketWatch published the following article yesterday- Bond traders talk up possibility of December Fed ‘twist’
November 19, 2020
Housing starts were stronger than expected, growing at 4.9% versus expectations of 2.5%. These houses will take approximately 6-9 months to complete and come onto the market. In the summer of 2021, when they are ready for sale, it is possible they will have to compete with a newly-formed glut of existing houses. Higher house prices and the vaccine will incentivize current homeowners to sell. It is worth adding that there are a lot of baby boomers likely to downsize over the coming years. The recent surge in prices may pull forward that supply. Simply a shortage is likely to cause a glut tomorrow. For more on this topic please read our article- 3-Reasons Why There Really Is No Housing Shortage.
The graph below shows the “K-shaped” recovery in real estate. Single-family housing permits are soaring while multifamily permits are at 5-year lows.
The graph and table below, courtesy of Ned Davis Research, show that the percent of “multi-cap” stocks trading above their 200 dma is extreme at 87.3%. The table below the graph shows that nearly 50% of the time when more than 61% of the stocks are above their respective 200 dma gains are limited. Not surprisingly, the largest gains occur when most stocks are below their 200 dma.
After reading our recent comments about Fed members raising the prospects for a national digital currency, a subscriber asked us how big the aggregate cryptocurrency market is. The graph below shows it at approximately half a trillion, or about a quarter of the size of Apple. Bitcoin is about 60% of the total. Digital currencies have been hot recently. The second graph shows the price of Bitcoin is fastly approaching record highs.
November 18, 2020
Retail Sales were weaker than expected coming in at +0.3% vs. a +0.5% consensus. Last month was revised lower from +1.9% to +1.6%. The control group, used to calculate GDP, was weak at +0.1% and last month was revised lower from 1.5% to 1.0%. The bottom line, as we are seeing with other data, the sharp rebound in economic activity is plateauing.
Import and Export Prices showed some deflationary trends. Import prices fell 0.1% versus +0.2% last month. Year over year they are -1.0%. Export prices are fairing a little better on a monthly basis up 0.2%. However, they are down 1.6% year over year.
The bright spot yesterday was Industrial Production which came in at +1.1%, a healthy increase from last month’s -0.4% decline. The Capacity Utilization rate increased from 71.5% to 72.8%.
Chairman Powell spoke yesterday and made it clear that QE and other “emergency programs” are here for a long time. To wit, he said it is “Premature to even think about normalizing the size of the Fed Balance Sheet.” Powell claims that they will deal with government deficits when the crisis is over.
HomeBuilder Sentiment continues to soar and is now at record highs as shown below.
“With each additional loan, the money supply increases. If a bank does not lend, the money supply does not grow.
In the same way that banks create money, it can vanish. Money dies when a debt is paid off or when a default occurs.”
A key point of the article is QE is not money printing and therefore not inflationary. For inflation to occur the money supply must increase and this, under the current construct, requires banks to lend the reserves supplied by the Fed from QE. One of the reasons we are not overly concerned about inflation is because banks are not lending money. The graph below shows loans and leases, as a percentage of bank assets, continue to decline despite ever-increasing amounts of QE.
November 17, 2020
Like last week’s Pfizer’s vaccine announcement, Moderna’s vaccine news boosted many stocks. However, the severe sector rotation trades and large divergences, as seen last Monday, were not nearly as distinct. The Dow Jones Industrial Average set a record high (+1.60%) and beat the NASDAQ by about 1%. Last Monday, many Tech stocks fell sharply, gold was off nearly $100, and bond yields rose. Yesterday tech stocks rallied and gold and bonds were largely unchanged. The Energy sector (XLE) was up over 6% on the day and is now up over 25% for the month to date.
Moderna’s vaccine is more practical as it can be stored in a refrigerator for 30 days compared to Pfizer’s which must be stored in a deep freezer. Transportation and storage play a significant role in terms of distribution and logistics, giving Moderna a major advantage and speeding up distribution considerably. Moderna’s vaccine was slightly more effective at 94.5% versus 90% for Pfizer’s.
While the vaccines will undoubtedly help the economy in the future, more and more states and local jurisdictions are locking down as COVID spreads rapidly. Markets in general and in particular the buying of economically sensitive, beaten-down stocks are clear sign investors are looking beyond what is shaping up to be a tough few months. With the S&P 500 now over 10% above levels from February, we must ask ourselves if the market is getting too far ahead of itself.
To that point, we ask you to consider a few factors that are not part of the bullish market narrative.
What if vaccines fail or the timeline is pushed out.
President Trump plans on enacting a series of hardline actions against China.
The brighter the vaccine promises the dimmer the hope for stimulus.
Economic growth post-COVID will be less than it was prior to COVID. As such, future earnings will also be reduced.
Equity valuations are higher than pre-COVID levels, which at the time were at or near records.
Retail Sales will be released at 8:30 followed by Industrial production at 9:15. Retail Sales are expected to increase by 0.4% and 0.5% excluding autos and gas. The control group, a large component of GDP, is also expected to rise by 0.4%. On Wednesday Housing Starts and Permits will be released followed Thursday by Existing Housing Starts. As we have seen over the last month, there will be a large number of Fed members speaking this week. Fiscal stimulus, monetary policy, economic activity, digital currency, and inflation are likely to be discussed.
November 16, 2020
PPI ex-food and energy was up 0.1% versus expectations of 0.2% and a prior reading of 0.4%. Like CPI the day prior, these key inflation data releases point to a weakening of the reflation trend. Bond yields took notice, with the ten year UST yield falling .12% since Wednesday. Gold was higher, as its price is well correlated to the level of real yields, as discussed in the commentary from last Thursday.
The University of Michigan Consumer Sentiment Survey fell from 81.8 to 77. Prior to COVID, it was running near 100, and at its trough, in the lower 70s. The bulk of the decline came from the Expectations index which fell from 79.2 to 71.3. The Current index was unchanged. Per UM, the resurgence of COVID cases and the election were responsible for the decline. We would add that declining stimulus is also starting to weigh on individuals.
In addition to discussing the economy and need for fiscal stimulus, quite a few Fed speakers have mentioned a digital currency alternative. To wit, The American Banker published the following a month ago- “The Federal Reserve is primarily interested in looking at a central bank digital currency that would improve the payment system, rather than one that would replace the physical dollar, said Chair Jerome Powell.” This past week he stated “There’s quite a lot of work yet to be done. The Fed is still considering a central bank digital currency (CBDC) but it’s in no rush”
Last week a few Fed members reiterated his thoughts on a digital currency. Last Friday for instance, NY Fed President Williams stated- “digital currencies are getting a lot of attention. These are issues front and center for the next few years.” Digital currencies have benefits such as ease of payments and crime enforcement, but they are not without fault. For one, digital currencies, without a physical alternative, make negative rates much more effective as the threat of withdraws from the banking system is greatly diminished. Digital currencies also allow the Fed to more easily print and distribute money directly to the people. While illegal today, it would be a powerful tool to generate inflation.
November 13, 2020
October’s CPI was weaker than expected, coming in at 0% versus expectations of a 0.2% increase in consumer prices. Excluding food and energy, the inflation rate was also flat. There has been a lot of data showing that the housing market is red hot and prices are rising. Interestingly, as shown below, the growth rate of shelter prices (purple), a component of CPI, continues to decline despite the recovery. Earlier this week China, reported that their CPI was 0.5%, below expectations, and the lowest in over three years.
Initial Jobless Claims fell by 48k to 709k, the largest drop in five weeks. This is a good sign given the recent surge in COVID cases and new restrictions being put into place in many areas. We shall see if the improvement continues given the growing number of COVID restrictions being resurrected. While the trend remains favorable, we remind you that prior to recent data, the largest weekly claims number in the 2008/09 recession was 665k.
The graph below shows the daily changes in the ratio of Value (IVE) and Growth (IVW). As shown, Monday’s startling 9% outperformance of value was one for the record books. In over 5,000 trading days since the year 2000, there have only been 4 days with a greater outperformance. Three of the four occurred in early 2000 as the Tech Bubble popped and investors rotated from growth to value.
The Wall Street Journal had an interesting article yesterday entitled What Biden’s Election Means for the Fed. The bulk of the article deals with the Fed’s current personnel and how that may change. Chief among those changes is the question of will Biden reappoint Powell when his term expires in a little more than a year. Biden will also have two and maybe three Federal Reserve seats to fill. The important takeaway, and one we strongly agree with, is as follows: “There is therefore little reason to expect monetary policy to change, no matter who joins the Fed’s board in the next year.”
November 12, 2020
Bloomberg’s Smart Money Flow Index is a measure of how “smart money” is positioning itself in the S&P 500. The logic behind the index is that smart investors tend to trade near the end of the day, while more emotional-based traders dominate activity in the first 30 minutes of the trading day. The index is calculated as follows: yesterday index level – the opening gain or loss + change in the last hour. As shown below, the Smart Index and the S&P were well correlated until late August. Since then, as highlighted by the red arrow, they have diverged sharply. Over the last ten years, the S&P 500 and the Smart Index have a strong correlation of .65. As such, we expect they will converge in time. The light blue circle shows they also diverged, albeit to a much lesser extent, in January and February as the smart money correctly sensed problems.
The graph below compares 10 year UST yields versus 10 implied breakeven inflation rates. The current gap between the two is relatively wide but even wider, considering that UST yields are usually higher than the inflation rate, not lower. In other words, real rates are negative. If the economy is going to fully recover, we should expect the UST yield to gravitate to and above the inflation rate. If that were to happen, it would imply 10-year yields of approximately 1.50-2.00%. We do not think the odds of that occurring are high because such “high” rates would heavily weigh on the economy. It is more than likely the Fed continues to aggressively buy bonds to keep yields much lower than where they should be. The other way the gap potentially closes is if the market has inflation expectations wrong and the implied inflation rate falls. This scenario suggests the recovery falters.
The graph above shows the two components used to calculate real yields. As shown above, the blue line (UST yield) has made recent progress toward closing the gap with inflation expectations, ie real rates are now less negative. The next graph shows the strong negative correlation between the level of real rates (blue line) and the price of gold. If real rates continue to rise and become less negative or even positive, we should expect the price of gold to suffer, and vice versa if real rates reverse the recent trend.
November 11, 2020
The “end of pandemic trade” continued yesterday as the Dow added another 1% on to Monday’s gains while the NASDAQ fell by 1.75%. The S&P 500, with stocks representing both tech/momentum and value, fell slightly. Yields continued to rise while oil added 2.70%.
Data from yesterday’s JOLTS report indicates that there are two unemployed persons for every job opening in the U.S. That figure is down from 4.6 but still well above the .75-1.0 pace it was running at before March.
The graph below, courtesy of Indeed, is another “K-shaped” recovery graph. The country’s largest cities (>5 million) are witnessing the slowest recovery in job postings, while the smallest metro areas (<500k) are seeing job postings nearly back to pre-COVID levels.
We often talk about stimulus and the enormous role it is playing in this economic recovery. Because of its role, an extension of the CARES Act to replace or extend the current stimulus is vital if the economy is to continue on its current trajectory. To that end, CNBC recently ran an article entitled More than 13 million people could lose their unemployment benefits at the end of December.The gist, as quoted from the article, is as follows: “The number of workers claiming these federal benefits make up more than half of the total 21.5 million people receiving unemployment benefits as of October. However, these CARES Act programs expire at the end of December 2020.”
It’s also worth reminding you that at the end of the year and during the first quarter of 2021, mortgage and student loan forbearance programs will end, forcing millions to make payments on loans or default. Per the MBA– “By stage, the 30-day delinquency rate decreased 33 basis points to 2.34 percent, the 60-day delinquency rate increased 138 basis points to 2.15 percent – the highest rate since the survey began in 1979 – and the 90-day delinquency bucket increased 279 basis points to 3.72 percent -the highest rate since the third quarter of 2010.” Further- “The FHA delinquency rate increased 596 basis points to 15.65 percent – the highest rate since the survey began in 1979. The VA delinquency rate increased by 340 basis points to 8.05 percent over the previous quarter, the highest rate since third quarter of 2009.”
November 10, 2020
In over 30 years of investment experience, I have never seen such a divergent day in the markets. The stock market heat map below shows the large number of bright reds and bright greens, representing gains or losses of 3%. The markets opened significantly higher on news that Pfizer and BioNTech have an effective vaccine. However, as the day went some stocks kept going up and others fell rapidly. The S&P closed up 41 points but that is over 100 points lower than the highs of the day. The Dow Jones ended up 3% while the NASDAQ was down 2%.
It appears as if investors sold those stocks that outperformed over the past few months and bought the laggards. Banking, industrials, and oil stocks did particularly well while tech and communications fell sharply. Even within some sectors, there were huge divergences. For instance, in the communications sector, Netflix was down 8.6% while Disney was up by nearly 12%. It’s not just the divergences that caught our attention, but the size of the percentage moves up and down for many very liquid large-cap stocks.
The volatility was not just in the equity markets but also showed itself in many asset classes. Bonds and gold got hit hard, while oil and the dollar had strong days. At one point crude oil was up over 10% on the day. The VIX (volatility index) closed the day down slightly after being 10% lower earlier in the session.
Inflation data will be released later this week with CPI on Thursday and PPI on Friday. Other than those two figures it will be a quiet week for economic data. Jerome Powell is scheduled to speak on Thursday at 9:30 am. The blackout on speeches by Fed voting members is over so we suspect they will become active on the speaking circuit as they were before the blackout. As we saw prior to last week’s FOMC meeting, the bulk of their speeches will likely revolve around the need for more fiscal stimulus.
The combination of a resurgence in COVID cases and resulting stricter rules around dining, along with colder weather has put a halt to the recovery in the restaurant industry as shown below.
November 9, 2020
Both Georgia Senate seats appear to be headed for a January 5th runoff election as neither candidate received more than 50% of the vote. This will leave the Senate in limbo for two months and, while not likely, leave the potential for a Democrat-led Senate if both Democrats can win the runoff elections. Bond yields and energy stocks were under pressure Friday as the possibility of a blue Senate came back to light. For what it’s worth the betting odds for a Democrat majority and a Trump victory are nearly equal at around 10%.
Various members of Congress are again bringing up a stimulus deal. Mitch McConnell does not appear overly enthused as he stated “the economic recovery should temper the size of an aid package.”
Per the BLS employment reports, aggregate job growth was slightly stronger than expected at +638K but below last months +672k. More promising, the unemployment rate fell sharply from 7.9% to 6.9%. A large portion of the gains are coming from the number of workers that the BLS deems as temporary layoffs. The number fell from 4.64mm to 3.21mm in the last month.
The graph below, courtesy of Brett Freeze, shows that employment in the service sector continues to greatly lag good producing sectors. This is not a surprise given COVID and the damage it has done to many industries that rely on person to person contact. The graph also serves as a reminder of our “K”- shaped recovery in which there are stark discrepancies in economic activity.
It appears the virtual/remote workplace may be more than a temporary COVID-related measure. The graph below, from the Conference Board, shows that of 313 HR executives polled, 34% of them think that over 40% of their employees will be working from home one year after COVID subsides. This study has meaningful consequences for commercial real estate and some of the larger urban economies.
Per Freddie Mac, the recent surge lower in yields pushed mortgage rates to 2.78%, a new record low.
November 6, 2020
As expected the Fed’s FOMC statement was largely unchanged from the prior meeting. The red-lined paragraph below shows the entirety of the changes. The only surprise was they did not include a sentence or two about election contingencies in case the final results are held up which could likely preclude the passage of more stimulus.
The following are some bullet points regarding Powell’s press conference:
He voiced concern that the economic recovery is moderating. He stated that while this was expected, it raises the downside risks as moderation can turn into decline.
The Fed will maintain interest rates at zero and keep QE running hot until employment fully recovers and inflation hits 2% and appears to be heading higher.
He vowed to “put the tools back in the toolbox once the crisis is over.” Sounds reasonable, but keep in mind after the financial crisis QE didn’t end until 2014, and rates were held at zero for 7 years. When QE was introduced to the public Ben Bernanke said it was temporary and would be removed as quickly as it was employed. It has never been removed.
Powell would not comment on the state of the election.
He said the Fed is “not taking the gains in financial market functioning for granted.” His response alluded strongly that one of the goals of QE is to support asset prices.
“If the idea is money-financed fiscal policy, then that is not something we would consider.” The problem with his statement is the Fed is already financing the Treasury, albeit indirectly.
Powell was asked if the Fed was in a liquidity trap as Christine Lagarde (President of the ECB) recently warned in the Financial Times. He sees no such threat and said “we do not doubt the power of the things we may do.”
On this topic, it’s worth sharing recent comments from Bill Dudley, ex-President of the New York Fed, from the WSJ- “No central bank wants to admit that it’s out of firepower. Unfortunately, the U.S. Federal Reserve is very near that point. “
The monthly BLS employment report will be released at 8:30 this morning. As shown below, the consensus estimate is for a net gain of 600k jobs and a reduction of the unemployment rate from 7.9% to 7.7%. Initial Jobless Claims have been running at approximately 3.2 million jobs a month, so assuming the consensus proves accurate, the economy is adding new jobs at a rate of about 3.8 million jobs a month. As a comparison, in 2019, the average monthly initial claims were 945k and the number of new jobs averaged 168k per month. Accordingly, the economy is currently adding jobs at almost 3.5 times the normal rate. Keep in mind, layoffs are also occurring at 3-4 times the average. The abnormalities in hiring and layoffs make employment data very difficult to estimate.
November 5, 2020
The impetus behind yesterday’s and last night’s additional stock gains appear to be based on the prospects for a divided Congress. It’s likely that the Republicans will hold on to a majority of the Senate and the House will stay with the Democrats. The obvious beneficiaries are the Healthcare and Technology sectors as it becomes less likely that that recent regulatory/policy challenges facing those industries come to fruition. Industrials and Materials lagged as the odds of a big infrastructure deal are compromised.
From a macro perspective, it is worth highlighting that the odds of a large stimulus bill probably took a hit yesterday. While we think Congress and the President will eventually agree on a deal, its timing and size are tough to handicap. The other risk facing investors is if the fight for the White House is contested in multiple states and an official decision is held up for weeks or possibly longer. The Bush-Gore decision, which only hinged on one state, was not settled until December 12th, over a month after the election.
Longer-term bond yields plummeted yesterday as the odds of larger stimulus and/or infrastructure bills are diminished. Markets are trading with a more deflationary narrative post-election. Volatility (VIX) fell sharply as it appears many investors removed hedges despite the uncertainty hanging over markets.
ADP reported that payrolls grew by 365k versus expectations for a gain of 600k. Last month ADP reported a gain of 735k.
The Fed will release their FOMC statement at 2 pm today and follow it up with Jerome Powell’s press conference at 2:30. Again we are not expecting much change, but we do expect the Fed to continue with their full-court press on Congress for additional stimulus. It will be interesting to see if Powell addresses what the Fed may or may not do if a delay in election results holds up additional stimulus.
November 4, 2020
As of this morning, the presidential election hinges on a few key states. Markets are very whippy with stocks rising. Of interest, the NASDAQ is up over 2%, S&P +.6%, and the Dow is nearly flat. More notable, long term bond yields are plummeting with the 10yr UST yield down roughly 10bps. Commodities are mixed with oil up over $1 and gold down about half a percent. Based on those moves we believe the markets are leaning toward a Trump victory. We caution, the election is still up in the air and asset prices will be extremely volatile.
ADP, a strong proxy for Friday’s employment report, will be released at 8:30. The current consensus estimate is for a net gain of 600k jobs. The estimate for the BLS report is also +600k jobs.
Over the last year, we have written a number of articles in which we quantify the historical underperformance of value stocks. Our analysis has been based on French/Fama data going back to 1938. The Financial Times has one-upped us in the graph below. They show that value stocks are now experiencing the most significant drawdown versus growth stocks in 200 years. Either the concept of buying what is cheap (value) is dead, or it is setting up for a period of incredible outperformance versus growth stocks.
On Monday we published 3-Reasons Why There Really Is No Housing Shortage, which discusses the current state of the housing market. We stumbled upon the graph below which adds to the article. As shown it is as hard to get a mortgage today as it was in the aftermath of the Financial Crisis. The difficulty in getting mortgage credit, especially for lower-priced housing, weakens demand. Given the current supply/demand imbalance, any improvement in credit availability will increase demand and add more fuel to real estate prices. That said, and as mentioned in the article, it may take a while longer but elevated housing prices will incentivize potential sellers to come to market. It is also worth noting that many baby boomers are at or nearing retirement. A good many of these people will trade down to a smaller house/apartment in the coming years. Given a deficit in aggregate savings for this population group, many may be tempted to sell by the recent uptick in prices.
November 3, 2020
This week, in addition to the election, investors will also contend with the Fed meeting/Powell press conference on Thursday and the BLS employment report on Friday. On top of that, 128 S&P 500 companies will report earnings. Regarding the Fed meeting, we suspect they will once again lean on Congress for more fiscal stimulus. The tone is likely to be more pressing this time as additional stimulus is already being delayed, and could be in further doubt depending on the election results or possibly the lack of a definitive outcome when they release their statement on Thursday.
The ISM Manufacturing Survey was much stronger than expected and now sits at a two year high. Even more encouraging, the employment sub-index, which has been below 50 since March finally rose above 50, denoting an expansion of employment. The graph below, courtesy of Zero Hedge, shows the historical and current relationship between the ISM index and the employment sub-component. There was an interesting comment from the report as follows: “There is increased production due to stores stocking up for the second wave of COVID-19.”
As we prepare our portfolios for the election and post-election trading we share a graph from @macrocharts that offers caution. As shown, short open interest in VIX futures is near a record level. If the election turns out unfavorable in the market’s eyes, investors that are short the VIX may have to cover their trades en masse. In such a case, it would provide more fuel for a sell-off. This is just one of many factors that have led us to reduce risk until the election is over.
We leave you with a graph showing how the S&P 500 did in the ten days following the last 5 presidential elections.
November 2, 2020
As a follow on to our election comments from last Friday, bonds have traded poorly during recent equity sell-offs. This may be a signal that bond traders are concerned about the possibility of either a blue sweep or a Trump win but a Democrat majority in the Senate. Either outcome would likely produce vast amounts of stimulus. Per Tom Demarco from Fidelity- “Pelosi was out yesterday saying she would like to pass a massive COVID stimulus bill during the lame-duck session before Biden takes office.” She is putting the cart before the horse, but if she is correct bond traders have every right to be worried.
The Atlanta Fed put out their first estimate of Q4 GDP. They currently expect GDP growth of 2.2%. They overestimated Q3 GDP by 3.9%, which given the extreme data and unusual conditions, is much better than it appears.
The Fed made its emergency lending program for businesses & nonprofits available to more small firms. It’s lowering the minimum loan amount under its “Main Street” program to $100K from $250K. The change is due to the inability of Congress to approve more stimulus.
The graph below compares monetary velocity and GDP. Velocity measures the rate, or how often money is spent in the economy. As shown, GDP and velocity tend to be well correlated. With Thursday’s Q3 GDP data in hand, we see the GDP is well ahead of where one would expect given velocity. This tells us that stimulus funds were widely used by the recipients of the funds but then not recirculated. It hints that economic activity from the stimulus is one time in nature and not generating further activity, as is typical. If velocity stays weak, economic activity will curtail sharply unless more stimulus is not enacted.
In Friday’s commentary, we discussed the Euro and how a breakout higher versus the dollar would heighten its deflationary problem. On Friday, the Eurozone recorded its 3rd consecutive monthly decline in consumer prices, as shown below. It’s clear that negative interest rates are not solving the deflationary problem but worse, they negatively affect their banks. As we consider potential ECB policy, especially in light of new COVID-related shutdowns, they can lower rates to even more negative rates and worsen banking problems or try to generate inflation in other ways. A weaker euro is one such way.
October 30, 2020
GDP rose 33.1% in the third quarter, slightly above expectations. The recovery was led by personal consumption, which rose over 40%. The surge was widely expected given the massive stimulus, via generous unemployment benefits and outright checks, provided to many citizens. Looking forward, the stimulus has mostly been spent so without more aid, economic growth will be harder to come by. As we discuss below, the election outcome will provide better visibility on whether or not more stimulus is likely.
The recovery is encouraging, but the economy is still 5.2% below the peak in the fourth quarter of 2019. To put that in context, GDP was down 4% from its prior high at its trough.
The graph below shows a downward Euro/USD channel over the last 12 years. The Euro is currently bumping up against the upper resistance line. When this occurred in the past, the trend reversed. The odds are that will occur again, especially as Europe begins to reinstate lockdowns and enact stimulus plans to aid their citizens and businesses. However, if the Euro does break out higher against the dollar it could prove destabilizing to the Eurozone as it would induce further deflation. Such a move would also push the dollar lower with inflationary implications.
With a weekend to think about the election and how the results may affect markets, we provide a few thoughts. Before progressing, it’s important to consider that the Cares Act, which fueled the recovery, is quickly waning. Without further aid, or “not enough” aid, economic growth is likely to slip backward and stocks are likely to follow. As such, our points below are largely predicated on the timing and amount of more stimulus.
A very tight election, with no decision and the prospect of a long period of counting votes and legal wrangling, is the worst potential outcome. Not only will it incite outcry from both parties, induce protests, but more troubling from an economic/market perspective, it will further stall an additional stimulus package.
A decisive and uncontested Biden win but Republican Senate may not be a good scenario either. Such an outcome will make additional stimulus difficult to pass. While a bill will ultimately pass under this scenario it may fall well short of expectations.
A Trump win but Democrat Senate will be a little more conducive to pass a bill.
A scenario where the President and the Senate are from the same party are the best-case scenarios for the market as stimulus will likely happen fast. A Democratic sweep is easiest as the bill will likely be bigger, but importantly the House is Democratic so there should be little infighting between the houses of Congress.
From a bond yield perspective, any combination that helps the passage of a bill would likely push yields higher due to the additional supply of debt needed to fund stimulus. A Democratic sweep could cause a sharp jump in yields. Conversely, a no outcome/contested election result, with slims odds of additional stimulus might cause yields to fall.
Having said all of that, we admit this election is hard to handicap and even harder to forecast how the markets will react. The election four years ago was a humbling experience for many market “experts” that feared the market would crater if Trump won.
October 29, 2020
Election jitters and European lockdowns (more below) pushed most risk assets significantly lower yesterday. The S&P was down 3.5%, Crude Oil down 5.6%, and Gold down 1.8%. Bonds struggled for minimal gains while the dollar and VIX soared. The VIX is now over 40, its highest point since mid-June. We should expect extreme volatility to continue through the week and early next week. The next levels of support for the S&P 500 will be 3200 (mid-September lows) and the 200 dma (3130).
Economic concerns are rising in Europe as it sees a resurgence of COVID cases. To that end, Germany unveiled one month “partial lockdown” restrictions starting on November 2nd. The new rules put limitations on large events as well as the closing of restaurants and bars. There is also talk that France is considering a month-long lockdown. Like Germany, this one would not be as onerous as they saw in the spring.
A few months ago, we introduced the Chapwood inflation Index. The index compiled by a private sector firm seeks to calculate an alternative inflation rate to what the government reports. They describe it as “a true cost of living” for each metropolitan area. The chart below shows the respective inflation rate for the five largest cities for the first of 2020. To get more information on how they compile and calculate the data on 100 cities, visit them at the following LINK.
Retired New York Fed President Bill Dudley wrote a startling editorial in Bloomberg Yesterday (LINK). The first paragraph was as follows: “No central bank wants to admit that it’s out of firepower. Unfortunately, the U.S. Federal Reserve is very near that point. This means America’s future prosperity depends more than ever on the government’s spending plans- something the President and Congress must recognize.” Dudley essentially argues that the Fed is limited in their ability to boost economic activity and worse that prior Fed actions have sapped future economic activity and asset returns. He heavily leans on the government to deficit spend. While we agree with his views on the Fed and their future ability to boost growth, he doesn’t explain the other trap, in that government spending is solely reliant on the Fed to buy the debt ensuring low-interest expenses.
October 28, 2020
Courtesy of Bloomberg: “U.S. senators depart Washington for a break, making the logistics for passing a fiscal stimulus package before the election practically impossible” As the benefits of prior fiscal stimulus fade, the need for additional stimulus to support the recovery will become more evident. While there is optimism for a post-election deal from both parties, we offer caution as the election results and the possibility of contested and/or delayed election results may incentivize one or both parties to hold off until after the inauguration.
Expect to find some coal in your stocking this Christmas. Per a Gallup poll, consumers plan to spend $805 this holiday season, down from $942 last year. They also highlight the October estimate of spending ran 10% higher than the November estimate over the past two years. Stay tuned for their next holiday poll to be released in late November.
The tweet and graph below, courtesy @macrocharts, shows that hedge funds have the most exposure to commodity futures in at least the last 15 years. There are a few takeaways from the graph and messages the hedge funds are sending us as follows:
First, large positioning in one direction by hedge funds has not historically resulted in a decline in commodity prices.
Second, the S&P Commodity Index is based on an aggregate of all commodities and therefore not representative of each commodity or commodity type. For example, agricultural commodities are currently not showing massive long interest.
Third, the recent pick up in exposure may be partially the result of the hedge funds betting on Joe Biden and the prospects for a large infrastructure deal. A Trump win, or a Biden win but Republican Senate, could greatly limit an infrastructure deal.
Fourth, the hedge funds may be betting on or hedging for inflation. The Federal Reserve is serving up massive amounts of QE and the government is running unprecedented deficits. Many investors believe that is the recipe for inflation.
October 27, 2020
As a result of yesterday’s sell-off, the S&P 500 broke through important technical support. As shown below, the S&P (3401) now sits below the 20 dma (3433) and its 50 dma (3408). It rallied late in the day to close just above the pre-COVID high (blue line) and the red support line starting at the March lows. The next levels of support are the dotted blue and orange lines and then the important 200 dma (3129). Last week we reduced equity and fixed income exposure in anticipation of volatility surrounding the election.
The economic highlight this week will be Thursday’s third-quarter GDP report. The current consensus is for a gain of 31%. That compares to a 31.4% decline last quarter. While upon seeing the number the media may declare the economy has fully recovered, it is important to consider the optics of economic growth/decline as measured in percentage terms. Math dictates that GDP, even with equal percentage gains and losses, would still be about 10% below where it stood after the first quarter. As an example, start at $100 and you instantly lose 50% bringing your balance to $50. From that point, it will take a 100% gain, not 50%, to get back to the original $100.
The Fed will be quiet after two weeks of a large number of speeches due to a self-imposed media blackout heading into the next FOMC meeting. Get some rest this week because next week will have plenty of potentially volatility inducing events. The election is on Tuesday, followed by the Fed meeting on Wednesday and Thursday, and on Friday the BLS will release the employment report.
Yesterday we showed that cash as a percentage of equity mutual funds holdings is now at decade lows. While we attributed some of it to the bullishness of fund managers, we should note that low cash holdings are also due to the shift from active to passive strategies. Active investors tend to hold more cash as they sell when holdings get too expensive and hold cash for future opportunities. Passive investors, with no need to trade and good liquidity in large ETF’s/Funds, have little need for extra cash. From a market perspective, the reduction in aggregate cash holdings (more investable cash) helps further explain high valuations. The negative, as we wrote in The Markets Invisible Guardrails Are Missing, is market instability and volatility as active investors are now not enough of a force to buy or sell when the markets reach valuation extremes.
October 26, 2020
“The ships are 100% full. The containers are 100% full. You can’t get a container built. You can’t pick up a ship from the spot market. The whole container-shipping cycle is at absolutely full pulse,” exclaimed Jeremy Nixon, CEO of Ocean Network Express (ONE), the world’s sixth-largest container line. –Container Slots Sell Out, Risking Holiday ‘Shipageddon’. -Freightwaves.com
Despite a global recession and supply line issues, demand for housing and retail goods is fully absorbing the number of shipping containers. Looking ahead, economic recovery coupled with the upcoming holidays, could worsen shortages for certain goods and drive up prices for imported goods. Interestingly, as we showed last week, pricing for domestic trucking and railway services have yet to recover fully.
This will be a big week for earnings announcements as shown below.
The Feds balance sheet has started rising again after stalling for a few months. In the latest weekly Fed balance sheet update, their balance sheet now sits at an all-time high. Last week total assets rose by $26bn from the prior week to $7.177 trillion. The Fed’s balance sheet now equals 37% of GDP. While high, it still pales in comparison to the ECB at 66% and the BOJ at 137%.
The graph below compares the Buffet Ratio, or the ratio of total equity market capitalization to GDP, for the U.S. and the nine largest economies. Italy was excluded as we were unable to find total market cap data. There are flaws in this type of calculation but it does show the degree to which US stocks are overvalued versus those of other leading nations.
The graph below, courtesy of @fadingrallies, shows that equity mutual funds are sitting on record low levels of cash. While not shown in the graph, the cash liquidity percentage is the lowest it has been in decades. Said differently, mutual funds are all in on this equity rally. The white line shows that cash accounts for 2.17% of the $254.467 billion of equity fund holdings. In the event of mass redemptions by fundholders, the fund managers will have no option but to sell equities.
October 23, 2020
For the first time in a while, Weekly Initial Jobless Claims painted an optimistic picture of the jobs market. New claims last week were 787k, almost 100k below estimates, and well below the mid to upper 800’s where it has stagnated over the last few months. Continuing claims (state and federal) are still very high at 23.1 million, but also declining. California reported this week after a two-week hiatus and its data was not nearly as bad as expected.
With about a quarter of S&P 500 companies having reported Q3 earnings, the results are much better than expected. Per CNBC, the average beat rate (actual less estimate) is 19% versus a historical average beat rate of closer to 3-5%.
Continuing on the “better than expected” theme, Existing Home Sales came in at a 6.54 million annualized rate versus 6 million last month. The year over year change in sales is now +20.9%. Further, the median home price is up 14.8% year on year. Record low mortgage rates, pent-up demand, limited supply (lowest since 1982), and an exodus from cities to the suburbs is having a huge effect on the housing markets. Existing home sales are now at 15-year highs, only elapsed by the 2005-2006 market which peaked at just above a 7 million sales rate.
In regards to record low mortgage rates comes the following: Freddie Mac today released the results of its Primary Mortgage Market Survey® (PMMS®), showing that the 30-year fixed-rate mortgage (FRM) averaged 2.80 percent, the lowest rate in our survey’s history which dates back to 1971.
The Citi Economic Surprise Index for the US and other major economies continues to decline from record highs. The index is not a measure of economic activity but a measure of the accuracy of economic forecasts versus actual economic data. The prior highs occurred as economists underestimated the pace of the recovery. Likewise, the index is retreating as they get a better grip on activity. A dip below zero, as may occur soon in the Eurozone and Japan, indicates that economists are overly optimistic in their economic outlooks.
October 22, 2020
The graph below shows that gold has followed a stair-step pattern with a series of slightly downward sloped, multi-month periods followed by a run higher over the last three years. After a big surge this past summer, gold is again consolidating similarly. We are likely to add to our position in IAU and GDX when we are comfortable that gold is breaking out of the consolidation. Fundamentally, the weaker dollar, massive deficits, and aggressive Federal Reserve/Central Bankers provide further reason to add to our gold holdings.
A topic that we haven’t written on recently but deserves attention is the yield curve. As we wrote in Profiting From A Steeper Yield Curve, before past recessions, the 2s/10s UST yield curve typically inverts marginally (10yr UST rates are lower than 2yr UST rates). Historically, it then steepens rapidly alongside a recession. After barely inverting in August 2019, the yield curve slowly steepened into the current recession. While the curve reacted as is normal in direction, it has not in steepness, in large part due to aggressive Fed purchases of Treasury bonds.
Over the last few weeks, the curve has begun steepening again. While we think the Fed will eventually keep a lid on higher long term yields, they may give them a little more room before acting. Given our economy is highly leveraged on existing debt and dependent on new debt for growth, it’s worth reviewing some of the pros and cons of a steeper yield curve.
A steeper yield curve is good for banks as it boosts their profit margins. However, higher long-term yields are bad for the housing markets, corporations, and the government. That said, interest rates for those borrowers, while higher over the last few months, are still extremely low. If the curve continues to steepen, higher interest costs will certainly weigh on economic activity. In addition to the banks, further steepening should benefit mortgage REITs such as AGNC and NLY. While more traditional REITs also benefit, we have a deep concern over potential credit losses. The concern is particularly true for office and retail REITs.
While U.S. rates creep higher, the opposite is occurring around the world. The graph below shows the global amount of negative-yielding debt is approaching a new high, having nearly doubled over the last six months. In the prior section, we discussed the Fed as a backstop for higher yields. It’s also worth considering that foreign investors will increasingly find the widening differential between U.S. and foreign yields tempting. The big question for fixed income investors is what yield gets the Fed and foreign buyers to spring to action.
As an aside, the price of gold and the amount of negative-yielding bonds has a strong correlation. As the number of negative-yielding bonds creeps higher the case for gold strengthens.
October 21, 2020
Stimulus discussions and rumors around those discussions, as well as, political gamesmanship, are contributing to sharp surges higher and declines lower. The combination of stimulus talks and the coming elections will keep volatility heightened for at least the next two weeks- buckle up!
The two graphs below tell an interesting story about the current state of the homebuilding industry. On Monday, the NAHB Home Builder Sentiment survey hit a record high, yet on Tuesday, Housing Starts graphed below rose slightly. Housing Starts have stalled for two months and the number of starts is still lower than in January. If builders are so optimistic, why are Starts not following suit?
The second graph compares lumber futures prices to the home builder ETF ITB. ITB sits at record highs and is up 20% year to date. Lumber, a key component in building homes, is well off recent highs and down for the year- another odd disconnect. Lumber prices and Housing Starts argue that home builders and investors may be getting a little ahead of themselves. Conversely maybe they think the strong recovery and insatiable demand for suburban housing will continue. One vital consideration in this story is interest rates, which have been rising as of late. Further increases will certainly put a damper on house sales, as well as home builder and investor expectations.
The graph below, courtesy of Jim Bianco, puts historical context toward the massive amount of COVID-related Federal stimulus. Current spending, as a percentage of GDP, dwarfs all prior recessions and is only bettered by expenditures for World War II. As Congress works on another trillion or two of stimulus, keep this graph in mind as well the onus that such spending puts upon the Fed to keep rates at 250-year lows.
While broad BLS employment data continues to improve, employment by small businesses is grossly lagging. The September Paychex/IHS Small Business Jobs Index is not only at least at a 15 year low, but lower than in March and also slightly lower than at the trough of the 2008/09 recession. Per the SBA, small business accounts for 49% of employment. This data set along with persistently high weekly initial jobless claims remind us that the employment recovery has a long way to go.
October 20, 2020
For the third straight week, there will be a lot of Fed members speaking. We suspect this week’s speakers will continue to bang the drums for more fiscal stimulus. Also providing market direction will be a heavy earnings calendar as highlighted yesterday. We do get a break from economic data this week. Initial Jobless Claims and Leading Economic Indicators, both set for release on Thursday morning, are the only important data releases this week.
The stimulus pendulum seemed to swing away from a deal on Monday, which upset the stock market. It is being reported that Nancy Pelosi has put a time limit on a package. If they cannot come to an agreement within 48 hours, she may walk away from the negotiating table. That said, we have seen both parties walk away from the table numerous times only to come right back.
Conoco Phillips (COP) made an offer to acquire Concho Resources (CXO) at a 15% premium to CXOs closing price. One of the benefits of owning the larger energy companies, like COP, in the current environment, is their ability to buy assets on the cheap. We suspect the other majors are looking at similar opportunities. In the short run takeover targets will benefit most from the activity. In the longer run, the larger companies buying discounted assets should benefit greatly.
Jerome Powell spoke yesterday and touched on digital currency. He said the Fed has a lot more work to do before deciding on whether to issue a digital currency. He also noted that a digital currency would not replace physical currency, but be a compliment to it. The two biggest benefits we see from a digital currency is one, it forces everyone to have 100% of their cash in a bank. If the Fed were to institute negative rates, depositors would not be able to pull their money from the banking system. Second, it allows the Feds and local law enforcement agencies to easier track spending, specifically illegal activities.
October 19, 2020
This will be a big earnings week as shown below courtesy Earnings Whispers.
Retail Sales were much stronger than expectations at +1.9%, versus expectations of +.7% The gain was led by motor vehicles and parts along with clothing sales. In aggregate, they accounted for over 50% of the increase. The table below, courtesy of Brett Freeze, breaks down contributions by sector. The control group, after a negative reading last month, posted a strong 1.5% gain. The prior month was revised lower (-.4% from -.2%), but in aggregate the two readings will result in an upgrade to Q3 GDP forecasts.
As we have continually noted in this K shaped recovery, good economic data is often met with weak data. Unlike Retail Sales, Industrial production was down 0.6% versus expectations for a 0.6% increase. As a result, Capacity Utilization remains one such weak reading. The Fed defines Capacity Utilization as follows: “how much capacity is being used from the total available capacity to produce demanded finished products.” Capacity Utilization sits at 71.5%. Since 1965, the reading was only lower during the 2008 recession (66.8%) and marginally lower for one month in the early 1980s (70.8%).
Despite having laggards such as Delta Airlines, Jet Blue, and Southwest Airlines, the Dow Jones Transportation Index is trading at all-time highs and nearly 10% above the February highs. Might the index be getting a little ahead of itself? That question was recently posed to us by a subscriber. The question is tough to answer. Helping boost the index are UPS and FDX, which represent about 25% of the price-weighted index. Both shippers are up well over 50% year to date as they benefit greatly from COVID-related lockdowns. On the other side of the ledger are the airlines. The bulk of the index, as represented by trucking and rail, tell us a truer story about the health of the transportation industry. As such, recent inflation data provides some clues as to how they are doing. Prices for trucking freight, as shown below, have recovered but thus far have gained back only about half of the COVID-related decline. The data for Rail transportation is similar. If freight/rail transportation were doing as well as the index portends, prices for shipping services should be back to February levels. The Transportation index has done very well, but underneath the cover lies a story of the haves and have nots.
October 16, 2020
September Retail Sales are expected to climb by 0.7% this morning versus a gain of 0.6% last month. As shown below, Arbor Research, using web browsing data, forecasts an 0.8% decline. Within the Retail Sales report will be control group sales data, which feeds personal consumption, the largest component of the GDP report. That is expected to increase by 0.2% versus a decline of 0.2% last month.
Weekly Initial Jobless Claims showed 898k people joined the ranks of the unemployed. The number was decently higher than expectations of 825k and the highest weekly number since August. Also of concern, California did not report claims this week due to operational issues, so the actual number is likely worse than reported. The graph below charts weekly claims back to 1968. As shown by the red dotted line, representing current claims data, the number of newly unemployed is unprecedented. Claims have now surpassed the prior record (695k) for 30 consecutive weeks. This chart should serve as a caution for Fed Vice Chairman Clarida, who thinks the recession is over.
For the most part, the largest banks reported better than expected earnings. Despite what some analysts perceive as good news, most of the banking stocks are trading lower. The reason is that investors are voicing concern that they beat expectations because the banks stopped adding to their loan loss reserves. Per Bloomberg, the five largest banks increased their reserves in the third quarter by $172 million. That compares to a nearly $28 billion addition in the second quarter. Banks are making a bet that the economy will recover in the next quarter or two and their loan loss reserves are already adequate. Based on the poor recent and longer-term performance, investors are not as confident. The banks are running the risk that the recovery falters and the government does not provide adequate stimulus. On the flip side, more stimulus is ultimately likely which may help support loan repayment and may prove the banks correct in their reserves.
The graph below shows that energy stocks continue to languish as they approach the March lows. At the same time, high yield energy bonds have recovered nicely. One can interpret the graph as energy stocks being cheap, however, with the Fed purchasing junk bonds, such analysis is invalid as they have distorted the bond market.
October 15, 2020
PPI and PPI excluding Food and Energy were both 0.2% higher than expectations and each is up 0.4% monthly. The figures point to an uptick in raw materials and commodities prices and potentially some margin pressure on manufacturers.
Yesterday, Fed Vice Chair Richard Clarida made that the recession may already be over. “This recession was by far the deepest one in postwar history but it also may go into the record books as the briefest recession in U.S. history.” While we would like to join in his optimism, the fact is that even with the rosiest of forecasts, GDP will not get back to pre-COVID levels this year and unemployment is still running historically high. Prior to Clarida’s comments, the IMF forecast that the global economy will lose $28 trillion of output over the next five years. Unfortunately, we think the IMF has a better-grounded assessment.
There appears to be an incredible amount of long-term value in the energy sector, but in the short term, trying to take advantage of the situation is painful. We have a position in CVX and look to add exposure to energy stocks when we are more comfortable that a longer-term bottom is in place. The following quote per Sentimentrader reminds how cheap the sector is getting: “If we net out the number of days in the past year when energy was the worst-performing minus best-performing sector, the spread is still extremely negative at more than -30 days. Going back to 1928, this is one of the widest spreads ever. The only time it got worse than this was in late 1982.”
Per data from Arbor Research, of companies larger than $300 million, almost 15% are classified as Zombies. This means they do not have enough in earnings (EBIT) to cover interest expense. For some of these companies, revenues and earnings will grow to cover the interest payments. A large majority, however, are heavily dependent on low rates and bond investors that continue to allow them to borrow new debt pay for the maturing debt plus ongoing operational needs.
October 14, 2020
The latest set of narratives driving the recent market rally, fiscal stimulus, and a Biden victory, might be misleading. It is becoming more apparent that the market is again in the grips of an options gamma squeeze. Essentially speculators are buying large amounts of short-dated call options, which forces dealers to buy the underlying stocks to hedge. This creates a circular buying spree. The surge is broken when options speculators sell and dealers must in turn sell stock to remove the hedges. Strong evidence of this phenomena was provided on Monday when the VIX was up on the day despite the market trading much higher. Further evidence can be found in record gamma exposure and a near-record low put-call ratio. The S&P 500 below shows how the squeeze ended in early September and the similarity in market structure to the past week or two.
The graph below shows that most S&P sectors are now overextended, trading around two standard deviations from their respective 20 and 50-day moving averages. Three standard deviations tend to be a good place to prepare for a sell-off or at least a consolidation.
The Consumer Price Index (CPI) met expectations rising .2% monthly and 1.4% yearly. The monthly data excluding food and energy, as the Fed prefers to assess it, was also up 0.2%.
A few weeks ago, we highlighted the tight correlation between Lumber, Tesla, Apple, and large-cap momentum stocks in general. Since then, Lumber futures have given up much of the gains, as shown below. Given the speculative nature we have seen in Lumber, it’s hard to assess whether the steep decline represents a sharp drop in demand or just the work of speculators. If it is a demand issue, this may be an early indicator that soaring new home sales may come back to earth.
October 13, 2020
CPI, PPI, Jobless Claims, and Retail Sales are the most important economic data points this week. CPI will be released this morning at 8:30 with current expectations of +0.2% (mom) and +1.4% (yoy). PPI follows tomorrow (+.2% mom and yoy). Jobless Claims are on Thursday and Retail Sales Friday.
JPM and C announce earnings today with most of the larger banks following on Wednesday. Within the RIA Pro portfolios, JNJ will also announce earnings today and UNH on Wednesday.
Yesterday, the market was led higher by Apple, Amazon, and tech stocks in general, but unlike prior surges, the broader market followed suit with much fewer laggards than early September when it last hit record highs. The optimism is tempered with caution as markets are becoming overbought as the S&P is nearing 3 standard deviations (Bollinger Bands) above the 20-day moving average. Further, the VIX rose despite the large equity gains. This potentially serves as a sign that a gamma-squeeze is once again pulling stocks higher.
According to the Economist magazine, of the COVID stimulus checks, “less than half of the money was spent; a third was saved for a rainy day.” The chart below shows that savings and debt payments constituted over half of the funds’ usage of those making $30k or more. If the government seeks to make future stimulus checks more economically effective, they may use a different distribution method, such as debit cards with an expiration date, to force consumers to spend the funds. That said, savings and reduced debt loads promote future consumption.
The Bank of England (BOE) appears ready to join Europe and Japan in initiating negative interest rates. After a few statements from BOE members alluding to negative rates, the BOE sent out the following information request: “Letter to chief executive officers to request information about firms’ operational readiness to implement a zero or negative Bank Rate.”
October 12, 2020
The stimulus rollercoaster and confusion continued with the following Friday’s headlines:
“U.S. SENATE MAJORITY LEADER MCCONNELL SAYS WE DO NEED ANOTHER COVID-19 AID PACKAGE.”
“TRUMP SAYS HE WANTS MORE AID THAN EITHER PARTY IS OFFERING”
For the last few trading days, the markets are behaving as if big stimulus and bailout deals are in the works. Given that McConnell has not been a participant in recent discussions, his new stance raises the odds of a deal getting done. The only question is can the two parties close the large gap in demands.
The breadth of the market has improved with the broader markets showing relative strength. For the past few months, the market was led higher by a select few stocks, mainly the large caps and, in particular, the FANMGs. Since March 1st, RSP (equal-weighted S&P 500) has underperformed the S&P 500 (market-cap-weighted) by nearly 6%. However, Since October 1st, RSP cut the differential as it beat the S&P by almost 3%. Similar story in value versus growth. Value (IVE) has beat growth (IVW) since October 1st, also by 3%.
The graph below, courtesy of Bloomberg, shows the stunning decline and slow recovery in ridership on New York City’s subway system.
On Friday it was reported that Microsoft is considering letting all employees work from home permanently. COVID lockdowns are teaching companies how to effectively and cost-efficiently allow employees to work from home. Given the immense office space that is currently vacant and will likely become vacant in the future in New York and other cities, ridership on the subway and other transit systems may be permanently impaired. This is not just a concern about transit, but commercial real estate and a host of other services supporting offices and workers. The work-from-home trend, if it continues post-COVID, has major positive and negative implications for businesses. The K-shaped recovery continues to present winners and losers.
October 9, 2020
Initial Jobless Claims continue to linger in the same range (840k this week vs 849k last week). Continuing claims are falling but, as we have stated, it’s hard to know how much of the decline is because people are finding jobs and how much is due to the expiration of state benefits. It is worth noting that California has stopped processing new claims for two weeks due to operational issues. As such, the Claims number may likely increase when California comes back online.
The market seems to have lost interest in the utmost importance of more Federal stimulus/bailouts. Nancy Pelosi said she was not interested in President Trump’s piecemeal approach to stimulus. On the other side of the fence, Mitch Mcconnell said “a big portion of GOP senators think enough has been done on aid.” Despite their respective comments, the market kept rising. Luckily investors now seem to be enamored with the latest narrative, that of a Biden victory and even more government spending. We say this partially in jest, but in reality, these are narratives created to help explain why markets move. Narratives, true or false, can propel the market higher or lower as investors buy into them. However, narratives are frequently wrong and can be harmful to investors that give them too much credence.
As shown in the tweet and graph below, courtesy of Liz Ann Sonders, the Fed is very concerned about the jobs market and is very vocal about it. Without the benefits of prior stimulus declining and no certainty of future stimulus and/or bailouts, the job recovery is likely to stall and possibly even reverse course. Any wonder the Fed is leaning hard on Congress for another round of spending and bailouts?
The stock market may be all that matters to Trump in the coming weeks. In a Bloomberg Article entitled The stock market may be too optimistic about stimulus chances, Julian Emanual head of equity trading and derivative strategy at BTIG was quoted as follows:
“Trump and his opponents know history- when the market has been higher in the 90 days prior to the election, the incumbent has won 85.7% of the time,” ’Emanuel said in a note. “Conversely, when the market is down in September and October cumulatively prior to an election (3,500) is the level to watch), the incumbent party has lost on 6 of 6 elections.”
October 8, 2020
The stimulus roller coaster continued yesterday when President Trump walked back his stance on no more fiscal stimulus before the election. He asked Congress for another round of PPP, a $25bn airline bailout, and a $1200 check per person. Given the excessive political jockeying ahead of the election, we have no realistic means of formulating accurate odds as to whether or not the Democrats and Republicans can agree on stimulus. Expect significant market volatility as the ebbs and flows of potential stimulus continues.
The following headline from Minneapolis Fed President Neel Kashkari reiterates many recent Fed comments and what appears to be a growing concern from Fed members that the economic recovery is at risk if Congress does not approve more stimulus. *KASHKARI SAYS VITAL THAT LAWMAKERS MOVE QUICKLY ON FISCAL AID
Per Bloomberg- The absence of a stimulus “could subtract roughly five percentage points from fourth-quarter GDP growth. The direct impact of no deal is large, but the indirect impact via a sentiment shock and consumer retrenchment could be more substantial“
The following are a few takeaways from the FOMC minutes released yesterday from their September meeting:
There are a few mentions of concern over elevated asset prices. “participants were concerned about possible buildup of financial balances.” and “a couple participants indicated that highly accommodative financial market conditions could lead to excessive risk-taking.”
In general, the pace of economic, inflation, and labor recovery was to their liking but noticeably below pre-COVID levels. “the rate of real GDP growth and the pace of declines in the unemployment rate were faster over the second half of this year than in the July forecast, primarily reflecting recent better-than expected data.”
As we have noted, there is a lot of concern that Congress will not agree on enough fiscal stimulus to ensure the recovery continues. “In addition, most forecasters were assuming that an additional pandemic-related fiscal package would be approved this year, and noted that, absent a new package, growth could decelerate at a faster-than-expected pace in the fourth quarter.”
Over 40% of the S&P 500 stocks are still down more than 20% from their pre-COVID highs. This data point is yet another indicator of how narrow the market runup has been. The generals (FANMGS) are in charge, so careful attention should be paid to their trading activity.
State governments continue to suffer as a result of increased spending and reduced tax revenue. The graph below shows that they have reduced their staffing to levels last seen 20 years ago. Unlike the recovery in national employment data, state employment is not showing any recovery.
October 7, 2020
*TRUMP SAYS HE’S STOPPING STIMULUS TALKS UNTIL AFTER ELECTION
Yesterday’s headline put a likely end to stimulus talks and with it, the market fell sharply. The dollar and bonds rallied as the prospects for more debt issuance are reduced, at least in the next few months. The market appears to be trading on firmer ground this morning.
The JOLTS labor data was generally positive with the percentage of layoffs and separations declining. The number of job openings fell to 6.49 million, which is not far from pre-COVID levels, and well off the lows of March (5 million). The difference, however, is that today there are 12.5 million unemployed people trying to fill those 6.5 million jobs. In February there was more than one job opening per unemployed person. Two job seekers for every job opening is high, but it pales in comparison to the prior recession when the ratio was over six to one at its peak. The only problem in comparing the two periods is that many more people have quit looking for work this time than during the last recession, and, as such, are not included in the count of unemployed people.
Fed Chairman Powell spoke yesterday and, as he has done at every opportunity over the last few weeks, warned the President and Congress of “tragic” economic consequences if more stimulus is not forthcoming. He also said: “Monetary policy is not the first defense for financial stability.” Essentially he warns that the Fed backstop is limited in its ability to maintain a real economic recovery. Also of particular interest, he made it clear that negative rates are not a tool they are looking to use. This contradicts recent statements from other Fed members that have appeared more open to it.
Last week Germany reported more deflation than expected, and yesterday France lowered their Q4 GDP estimate to 0% growth. Both stats are euro negative/dollar positive as they increase the likelihood the ECB will take on more aggressive action to stimulate growth and inflation. Given the potential for no stimulus before the election and possibly not until the inauguration, the dollar should trade better versus the euro and other currencies.
The tweet and graph below from Michael Kantrowitz of Cornerstone Macro quantify what we and others have said about the unusual disconnect of the stock market and the economy. It turns out to be not only unusual, but unprecedented in at least the last 60 years.
October 6, 2020
President Trump took to the twitter airwaves in force on Monday morning. After a few days of relative silence, the media and markets took it a sign that he is recovering. The stock market rallied on both his health and increasing chatter that a stimulus deal is still possible despite the Senate recess. The only odd factor in yesterday’s rally was the VIX also rose by 1%. Bond yields increased sharply as there are growing concerns that a Biden victory would equate to more stimulus, ergo more Treasury bond issuance.
This week is shaping up to be a quiet week for economic data. That said, the Labor Department will release the Jobs Opening and Labor Turnover Survey (JOLTS) which will provide more detail on the labor situation. The FOMC minutes from the last Fed meeting will be released on Wednesday afternoon. Not much new is expected from this release as the meeting itself proved non-eventful. As we saw last week there are a large number of Fed members scheduled to speak this week.
Q3 corporate earnings reports will begin trickling in this week. Delta, Carnival, Levi Strauss, and Dominoes are the only well-known companies reporting this week. The banks will truly lead off earnings season the following week. To see the upcoming earnings dates on your holdings or those in the RIA Pro portfolios, click on the Portfolio Tab, then Dividend/Earnings, and Upcoming Earnings. As shown below, in the equity portfolio JNJ will announce on October 13th, followed by UNH the next day.
As shown below, courtesy of Zero Hedge, speculative short interest in 30 year Treasury Bond futures is now at a record high. As we discussed with the dollar yesterday, if these positions need to be aggressively covered, it could lead to a surge in Treasury prices and a decline in yields. It seems as if some of these traders are betting that 30-year yields potentially break above its 200-day moving average, which it is currently bumping right into.
October 5, 2020
661,000 new jobs were added in September, below expectations for 859,000. However, August data was revised higher by 110,000 jobs. The unemployment rate fell to 7.9% from 8.4%. While seemingly good, the reason for the decline was largely due to a decline in the labor participation rate from 61.7% to 61.4%. Currently, there are 10.7 million fewer people employed versus a year ago. Net net, the BLS data is weaker than expected and continues to show that the recovery is slowing. That said, it may not be weak enough to push politicians back to the negotiating table for more stimulus talks.
The price of crude oil and ten-year implied inflation expectations have been well correlated for the last 10 years as shown below. If oil continues to show weakness, inflation expectations will likely follow. If so, what does that mean for market expectations for a V-shaped recovery? Likewise, will the Fed take notice and potentially get more aggressive with QE or possibly negative rates?
8 SPACs conducted IPOs on Friday, raising a total of $3.25 billion. This year’s number of SPAC IPOs is already more than the total from the last two years combined. SPACs are special purpose acquisition companies, which collect investor funds today with the hope of acquiring assets in the future. Investors are essentially writing a blank check to an asset manager in hopes they can find value. As we noted a while back, these entities, in many cases, represent the epitome of speculation.
The graph below shows that short speculative positioning in USD futures is now the largest in at least the last ten years. When and how the shorts cover their positions is important. An event that would cause them to cover at the same time could result in a sharp dollar rally. On the other hand, as witnessed in 2012 and 2017, the shorts may cover in a non-urgent manner without pushing the price higher. The bottom line is that the dollar has been negatively correlated to risk assets. As such, we must stay on guard as the shorts are potential fuel for a dollar surge.
October 2, 2020
Stocks traded weaker overnight on news that President Trump and the First Lady have COVID. We will monitor his situation to see if there are any repercussions.
The Senate was dismissed until after the election, further dashing hopes of additional stimulus. That said, they can easily be called back to vote if the two parties can come to an agreement.
It turns out the market swings on Tuesday night and Wednesday (detailed in yesterday’s commentary) are not that abnormal compared to the trading activity of the last four weeks. Average True Range (ATR) is a simple average of the daily difference between the high and low of each trading day. As shown below, the ATR on the futures contract is currently 2.03%. While it pales in comparison to the experiences of March, April, and May, it is at the high end of the range for the last five years. This is not bullish or bearish commentary, but just a note of caution as a high ATR is often a function of illiquidity. We believe illiquidity is currently an issue and will remain one through the election and possibly through year-end, especially in the event of a contested election.
Initial Jobless Claims registered a small decline to 837k but a big drop in continuing state claims, which are in part due to benefits expiring. Expectations for today’s BLS jobs report is as follows: Payrolls +894k (1.37mm prior), Unemployment Rate 8.2% (8.4%), and Participation Rate 61.8% (61.7%).
Continuing on the K-shaped recovery theme, the graph below, courtesy the Washington Post, shows the gross distortions in the recovery of jobs for the top 25% of wage earners as compared to the remaining 75%. The illustration also highlights the big difference in recovery for the four wages classes in this recession versus the prior three recessions.
We have mentioned that equity valuations are on par or, in some cases, even higher than those seen during the late 1990s tech bubble. The graph shows yet another indicator of the market froth that is only comparable to instances from 20 years ago.
October 1, 2020
ADP reported that job growth in September rose by 749k, beating expectations by 100k.
Steven Mnuchin put further doubt in the ability of Congress to agree on a stimulus deal. Per the Treasury Secretary- “If we can’t get a stimulus deal done before the election, we will come back and try to negotiate a deal after the election.” Later in the day, Mitch McConnell made similar disparaging comments. These comments may just be negotiating tactics so we must be careful to not rule out a deal in the next week.
U.S. stock markets have been extremely volatile since Tuesday’s close. From the 4 pm close through the Presidential debate, S&P 500 futures rose by nearly 30 points. As the debate ended, it reversed sharply, erasing the 30 point gain plus falling an additional 35 points. From the lows at 2 am it recovered and rose nearly 100 points. A little after 2 pm the index gave up all the days gains but recovered and posted a 27 points gain from yesterday’s close. This morning the index looks like it will open up 30 points. Yesterday was the last day of the quarter, which resulted in window dressing trades and added to the volatility. With yesterday’s gains, the S&P 500 index closed 6 points above both its 20 and 50-day moving averages. The technical picture is mixed. The bullish case is that the index is above both key moving averages but bearish because of the crossing of the moving averages.
Per Bloomberg: GERMAN INFLATION RATE FALLS TO -0.4%; EST. -0.1% (year over year). More signs of deflation in Europe will lead to more talk of QE and even lower negative interest rates. This should put pressure on the Euro and bolster the dollar.
As we recently wrote in The Fed’s Bazooka is Broken, the ability of central banks to generate inflation is dependent on the banking system’s ability and willingness to make loans. Per the article: “The banks have enough excess reserves to make trillions of dollars in loans. However, the banks are on the hook for defaults and solvency issues arising from such loans. Banking margins are at historically tight levels, interest rates at record lows, and the unemployment rate is at levels rarely seen. To make matters worse the Fed is begging for inflation, which would raise future interest rates to detriment of bank profits. Should we expect banks to loan in such an environment? Of course not.” The graph below shows how aggressively banks have tightened lending standards, effectively negating the Fed’s inflationary stance. Until we see a change in bank behaviors and loan demand, or a new Fed program, as we allude to in the article, the threat of significant inflation is minimal.
The K-shaped recovery continues to show stark contrasts between the winners and losers of the recovery. For example, as shown below, small businesses are not seeing any recovery in hiring. ADP affirmed the problem in yesterday’s report- “small businesses continued to show slower job growth.”
It is not just small business on the wrong side of the K. From the Air Transport Action Group; “Executive Director of the cross-industry Air Transport Action Group, Michael Gill said: “Air transport is in the midst of the deepest shock in its history. We expect a reduction of up to 4.8 million jobs in the sector by the end of the year and a massive hit to our ability to connect the world.”
September 30, 2020
The ADP labor report, typically a good proxy for the BLS report, is expected to rise by 650k, or about 225k more than last month. The BLS report has been running well ahead of ADP and is expected to beat out ADP again with expectations of a pick up of 900k jobs. There are a lot of moving parts, many of which are difficult to quantify, that did not exist before COVID to help explain the vast differences between the two reports. We know the labor market is improving, but it is very difficult to compare current employment statistics to pre COVID periods.
The Conference Board reported that its consumer sentiment index rose sharply to 101.8, up from 86.3. While encouraging, the index remains well below its 132.6 reading in February.
The House continues to negotiate additional fiscal stimulus, but the two sides appear further apart than they did late last week. Currently, the Democrats are offering a bill worth $2.4bn. It is believed the Republicans and the President are in the $1.5bn area. While $1bn is not necessarily a wide chasm, there are various components of the bill such as state and local funding in which they remain far apart. We still think it is likely a deal passes but time is running out as the election nears.
Boston Fed President Eric Rosengren mentioned that a credit crunch is “very likely” toward the end of the year if banks come under stress from Commercial real estate loans. The Financial Times recently published an article on securitized commercial loans (CMBS) in which the author makes a case that the number of troubled CMBS deals will increase rapidly. Essentially he argues that CMBS bonds have been able to pay enough interest and principal from special funds the bonds hold for maintenance purposes (FF&E accounts) to delay the underlying collateral from going into default. He fears FF&E funds are running out and as a result, some AAA-rated tranches are now dropping to BB. “This process will now accelerate rapidly.”
The Bank of England may be the next central bank to introduce negative rates. Per Andrew Bailey, Governor of the BOE, “if we cut rates below zero, we would need to explain it very carefully to the public.”
September 29, 2020
There are quite a few Fed members on the speaking docket this week. On the economic front, the major industrial surveys will be released on Wednesday (Chicago PMI) and Thursday (PMI/ISM). Employment takes center stage with ADP on Wednesday and the BLS report on Friday. Politics will also be of importance with the first debate tonight at 9 pm and the likely re-upping of the Cares Act stimulus potentially coming at any time this week or next. Politics aside, the markets will probably do better with a strong Trump/weak Biden debate showing.
ECB President Christine Lagarde sounded the alarm against a stronger Euro and issued a warning about deflation. To wit: “A stronger euro is set to weigh on inflation.” With the Euro sitting at two-year highs, the ECB has likely seen enough euro strength for their liking. This is yet another reason the dollar may continue to break out and head higher versus the euro and other currencies in the coming weeks.
The markets surged yesterday with strong breadth. The VIX was the only fly in the ointment, which despite a 1.6% gain in the S&P 500, was up slightly on the day. With yesterday’s gains, the S&P is sitting at the 50-day moving average (3353) and only 20 points below the 20-day moving average (3373). Those averages may prove to be the only roadblocks on the way to new highs. We added exposure yesterday as the technical situation is improved. We remain cautious as we are very aware of the troubling economic and political environment. But, as they say, markets like to climb a wall of worry.
As shown below, equity volatility (VIX) remains more than two times higher than its recent record lows from 2019 and early 2020. At the same bond volatility (MOVE index) is at all-time lows as the Fed, via aggressive buying, has sharply reduced the daily trading range of U.S. Treasuries. Over the last ten trading days, the difference between the high and low closing yields for the ten-year UST was 2 basis points. Since 1962 the average ten-day difference is 22 basis points.
Evercore, with the help of data from Redfin, shows an 18% jump in homebuyers’ preference to move out of urban areas, in just the last 6 months.
September 28, 2020
The equity markets rallied on Friday and again overnight on news that Congress is coming to a bipartisan agreement on a $1.4 trillion expansion of the Cares Act. The possible agreement comes as a bit of a surprise given the election and political rancor. While good news from a market perspective, is it enough to boost the economy?
Investors outflows from the two popular junk bond ETFs HYG and JNK reached $3.7 billion this week, representing the largest outflow since March. The two ETFs have seen outflows for four weeks running. With yields and yield spreads near record lows, there is little upside tempting investors and substantial risks to be concerned about. Further, the Fed has been focusing QE on Treasuries and mortgages and not the corporate bond sectors.
The graph below, courtesy Zero Hedge, shows that over the course of the last month the market’s concerns for the election and, in particular, a contested election have escalated. Compare the gold line showing the VIX curve from late August to the current VIX curve (green line). A month ago, the high point on the VIX curve, or the point where the most volatility was being priced in, was October. VIX was lower in November. Today, the VIX curve shows that volatility increased over the last month, but importantly much more so for the November contract. November is now at a higher level than October.
The graph below by Brett Freeze shows how the misallocation of debt toward unproductive ventures has fueled each economic expansion. The unfortunate part of this economic strategy is that the overhang of unproductive debt has made each economic expansion slower than the one prior to it.
September 25, 2020
Initial Jobless Claims remain stuck, coming in slightly higher from last week at 870k.
For the third day in a row Chairman Powell pressed Congress for fiscal stimulus. To wit, the following Reuters headline: “FED’S POWELL SAYS EVICTIONS, MORTGAGE DEFAULTS COULD INCREASE IN ‘NOT TOO DISTANT FUTURE’ WITHOUT FURTHER FISCAL ASSISTANCE TO FAMILIES”
He also stated: “Targeting Average 2% Inflation Will Give The Fed More Room to Lower Rates as Needed.” This is the first indication from any Fed member that negative rates are on the table. We are interested to see if this was a slip of the tongue or there is more to the comment.
Per Goldman Sachs- “We are lowering our Q4 GDP growth forecast from 6% to 3% due to Lack of Further Fiscal Support.”
Fed Vice Chairman Richard Clarida said the Fed will not consider raising interest rates until it actually achieves 2% inflation for at least a few months. While he is the Vice Chairman, he is contradicting recent comments from Chairman Powell and other Fed members who say the Fed will wait for a much longer overshoot of the inflation target before rate hikes are discussed.
The graph below shows that gold prices and real rates (10 year UST less the breakeven implied inflation rate) are very well correlated. If the reflation trade is fading and deflation again becomes a concern, real rates will rise unless Treasury yields fall. We do think yields can fall substantially but, for the time being, they appear grounded at current levels. Given this construct along with dollar strength, we reduced our gold and gold miner holdings on Wednesday. We still like gold in the long run, but in the short term, we are concerned that the recent trend changes in the dollar and real rates may put further pressure on gold.
The K-shaped recovery is alive and well. The tweet and graph below, courtesy Joe Weisenthal of Bloomberg, shows that three measures of economic activity in New York are failing to recover.
The graph below, courtesy of the Daily Shot, shows that small-cap stocks have not only taken on much more leverage than large caps but the amount of leverage has soared to record highs. Any sustained uptick in interest rates will likely spell trouble for many over-indebted small-cap companies. In such a circumstance they must deal with higher interest expenses along with reduced access to funds due to default risk. This is one of the main reasons we have stayed away from the small-cap sector recently.
The graph below, courtesy Bianco Research, shows that the current drawdown is the deepest since the recovery took hold in March.
September 24, 2020
The Russell 2k (IWM) closed two cents below its 200-day moving average. The small-cap index is the first of the major indexes to fall back to its 200-day moving average.
The House passed a bipartisan stopgap spending bill to fund the government through December 11, thus avoiding a pre-election shutdown. It was thought the Democrats might use the bill as leverage to delay or even prevent the nomination of a new supreme court justice.
Interactive Brokers (IBKR) sent the email below to its clients as follows: “implied volatilities indicate that the markets will be confronting elevated volatility both before and after the November 2020 election. IBKR shares that sentiment.” As a result, they are raising margins by 35% over the next month, starting September 28th. IBKR is a large futures and equity custodian. Their action will reduce the amount of leverage used in client accounts. We should probably expect other large custodians to take similar actions. Reduced leverage will undoubtedly force some investors to reduce their positions. The change will affect long and short positions but given the speculative nature of the markets, we suspect the net effect will be negative for risk assets. Click on the picture below to see the full note.
Chairman Powell made the following interesting comment yesterday: “We have done basically all of the things that we can think of.” While there is certainly more the Fed can do, this is the Fed’s way of saying the economy needs more fiscal stimulus before any additional monetary stimulus. This is not a bullish signal for a market that has been uplifted by the “Fed will do whatever it takes” narrative.
The Citi Economic Surprise Index, measuring the difference between economist economic forecasts versus actual data, has fallen recently but stands well above any level in the past. At 166, the index is almost 100 points lower over the last month but still well above the 20-year peak of 100. For context, the lows in March were around -150. Bottom line: economists have grossly underestimated the recovery. Like many other indicators, this one is not easily comparable to the past due to the unprecedented shutdowns and amounts of stimulus. We advise ignoring the media narrative touting this index as a sign all is well. It serves as a reminder that economists, like the rest of us, are struggling to forecast economic activity.
The UK is on the brink of instituting national lockdowns as the number of COVID cases increases sharply. Europe is experiencing a similar uptick in cases. The U.S. has seen a rise, but not to the same degree. A COVID comeback may prove beneficial for stocks like Zoom, Amazon, and Clorox but further impede recovery for the restaurant, airline, and travel industries.
September 23, 2020
The Chicago National Fed Index, derived from 85 national economic indicators, was much weaker than expected at .79 versus expectations of 1.88 and a prior reading of 2.54. The index is expressed in standard deviations from the average. As such, the current reading represents growth of almost one standard deviation above the average, albeit with a sharp slow down from the prior month.
The major indexes are perched between the 50-day and 200-day moving averages. If they can break above the 50-day, the market may very well run back to its highs. A drop below may portend that the recent decline is more than consolidation. While most market participants focus on the market cap S&P 500 and NDX, the equally weighted S&P 500, provides a barometer of the broader market. The graph below shows it is closer to its 200-day moving average than the other major indexes.
The graph below of the VIX (volatility index) has yet to show that traders are concerned about the recent selloff. While VIX is historically high, options traders seem to collectively think the move is just a consolidation. Pay close attention to the VIX as it can tip us off if they are wrong.
Over the last two months, the materials and industrials sectors have outperformed the market. Part of the narrative behind the trade is reflation. As we noted in last Friday’s technical scorecard, both sectors hit extreme levels of overbought. A correction or consolidation is in order. The bigger macro question, however, for the sectors and the economy and markets as a whole, is reflation possible without fiscal stimulus? Along with those two sectors, we recommend following the Commodity Research Bureau (CRB) index of commodity prices, which has a nearly identical trend as the two sectors. The index, shown below, is recently stalling.
The chart below shows that despite improvement in the labor markets, Federal tax withholding has yet to reverse its slide.
September 22, 2020
It will be a slow week for economic data but Fed speakers will keep the calendar busy. In particular, Chairman Powell is scheduled to speak at 10 am today, Wednesday, and Thursday. While groundbreaking policy changes are not to be expected, we are on guard for more clarification around inflation averaging and its implications for future monetary actions. The health of banks may also be addressed as the Fed will undergo a new round of financial stress tests on the banks.
In yesterday’s Major Market Buy Sell Review and prior ones, we have noted that the U.S. dollar index is technically oversold. As shown below, the price of the dollar is close to breaking out of the range (red box) that has contained the dollar for the last two months. A strong dollar is negative for commodities and precious metals as we witnessed yesterday. It’s also worth considering that equities have rallied on the back of the weaker dollar since April. Yesterday’s moves in the dollar and the S&P 500 were complete opposites of each other, as shown below the longer-term dollar graph.
On September 30th the government will shut down if a continuing resolution is not agreed upon by Congress. With the passing of Ruth Bader Ginsburg, the political atmosphere is even more hostile, if that’s possible. As a result, the bill to continue government operations, which was expected to pass, is now in doubt. We should also lower our expectations for additional stimulus.
Vanguard and Fidelity recently made noteworthy changes to their money market fund lineups. Both entities reorganized their Prime money market funds into existing traditional government money market funds. Vanguard’s prime funds totaled $125 billion and Fidelity’s $86 billion. Prime funds are high minimum investment products that invest in short-term, investment-grade corporate, and commercial loans. The funds were preferred by larger investors as they had higher returns than government money market funds. In the current environment with very low rates and tight spreads, the benefit to holders of Prime funds, especially after fees and expenses, was negligible. These funds were a key source of short term borrowing for corporations.
Last Friday, the University of Michigan released its sentiment survey, which contained mixed messages. The overall index shows an uptick in confidence to 78.9 versus 74.1. Inflation expectations were lower at 2.7 versus 3.1. Of greater concern, and shown below, expectations for future income continue to languish.
September 21, 2020
On Friday, the NASDAQ 100 and S&P 500 closed below their respective 50-day moving averages. The Dow Jones is about 200 points above its 50-day moving average. Attesting to how overbought the markets were, it took a nearly 10% decline in the S&P 500, before the first significant level of technical support was broken.
We have recently been writing about the allure of value stocks as they have grossly underperformed growth stocks over the last few months as well as the last decade. This bout of recent history is an anomaly. Going back almost 100 years, value stocks have returned over 3% more annually than growth stocks. The million-dollar question is when will the trend favoring growth stocks reverse.
In our Technical Value Scorecard Report from last Friday, we shared the graph below showing how value has finally achieved overbought status versus growth using both our score and our normalized score. This is the first instance of outperformance since the recovery took hold in early April. While we are hopeful value can continue to outperform growth, we remain skeptical. The second chart below shows the 2020 trend of the ratio of value (IVE) versus growth (IVW). While the uptick has broken through resistance, we would like to see a continuation of the uptrend to get more optimistic. This trade has a lot of promise but we must also respect the decade-old trend until it has clearly changed.
When the Fed buys bonds (QE) they are not printing money per se. QE puts reserves in the banking system which then allows the banks to print money if they elect to make loans with the new reserves. Despite the central bankers’ goals, and intentions QE and forward guidance will not create inflation unless the banks lend. The graphs below show the Fed’s, ECB’s, and BOJ’s inflation estimates over time versus actual inflation. In almost all cases their estimates fall far short of reality. Should we expect that the Fed’s new inflation averaging policy to be any different?
The graph below, courtesy of the New York Times, shows the amazing growth of SPAC public listings. Per Wikipedia, a SPAC is defined as follows: A special purpose acquisition company (SPAC), sometimes called blank-check company, is a shell company that has no operations but plans to go public with the intention of acquiring or merging with a company utilising the proceeds of the SPAC’s initial public offering (IPO). The sharp increase in SPACs is yet another sign of the intense speculative nature of investors in today’s financial markets.
September 18, 2020
Initial Jobless Claims were higher than expectations but 33k less than last week’s figure. Continuing state claims continue to decline, however, not all of those people are getting new jobs. Some of the reduction is due to the expiration of claims benefits. The total number of people receiving jobless benefits, including Federal programs, rose by 100k to nearly 30 million.
The graph of the Dow Jones Industrial Average below shows that, despite the recent sell-off, the Dow has yet to break below material technical levels. First, it is currently sitting on the horizontal blue trend line marking the high in early June. The line also appears to be a minor neckline for a potential head and shoulders pattern. The 50-day moving average is the next level of support at 27431. Another 1000 or so points lower is the red parabola, which has served as good support since March. Lastly is the all-important 200-day moving average.
Keeping interest rates low and stable is hard enough for the Fed with the heavy supply associated with $3 trillion-dollar deficits. Making the job even harder is that foreign nations are not buying U.S. Treasury bonds to the degree they had been. The tweet and graph below, courtesy of Lyn Alden, shows that foreign institutions now own, in aggregate, about 8% less of the total debt outstanding than they did at their peak in 2013.
A few weeks ago we noted that Lumber was trading in line with the large-cap growth stocks driving the market higher. The graph below shows the strong correlation between Lumber, Apple, and Tesla. Prior to the last few months, lumber prices were a good economic indicator for the pace of construction and the real estate business. Its recent price movement appears to be more a function of rampant speculation. The theme continues that the Feds effect on investors causes distortions to what were once good and reliable signals.
Manhattan apartment sales are being devastated by COVID and the emerging de-urbanization trend. Per Statista, second-quarter apartment sales are down 52%, total sales (1,147) is the lowest number of sales on record, and the median selling price is down 18%. It is also widely reported that rents are down sharply as well. The upside to the troubles facing New York and other big cities is that suburban real estate sales are setting records. To that end comes the following quote from the National Association of Home Builders Chief Economist Robert Dietz- “lumber prices now up more than 170% since mid-April, adding more than $16k to price of typical new single-family home…suburban shift keeping builders busy.” His quote accompanied their latest homebuilder survey which now sits at record highs.
September 17, 2020
In yesterday’s Fed policy statement, its 2020 economic outlook was upgraded. GDP is now forecast to shrink by -3.7% in 2020, up from -6.5% in June. They also reduced the unemployment rate forecast from 9.3% to 7.6%. The Fed changed its policy statement to fit around its new inflation averaging policy. Per the statement: “With inflation running persistently below this longer-run goal, the Committee will aim to achieve inflation moderately above 2 percent for some time so that inflation averages 2 percent over time and longer-term inflation expectations remain well-anchored at 2 percent. The Committee expects to maintain an accommodative stance of monetary policy until these outcomes are achieved.” The Fed will keep rates at zero and continue with QE at the current pace. In Powell’s press conference he mentioned a couple of times that the Fed would continue to buy $120 billion a month of Treasury bonds and mortgages. We are left to wonder if corporate and municipal bond-buying programs have ended.
The FOMC statement also contained economic projections through 2023. The consensus expectation of Fed members is for the Fed Funds rate to stay at zero through 2023. Unemployment spent most of 2019 below 4% and, and, even at that historically low rate, most Fed members conceded that the economy was not at maximum employment. Unless inflation ticks up well above 2.5-3%, the Fed will likely keep rates at zero well beyond 2023.
Retail Sales were weaker than expected at +0.6% versus expectations of 1% and a revised lower +0.9% last month. The Retail Sales control group was down by 0.2%. This subset of retail sales is a more precise method of gauging consumer spending and is used to calculate Personal Consumption Expenditures (PCE) for the GDP number. The positive spin on the data is that the fiscal cliff is, thus far, not having a more significant negative effect on the consumer.
On Tuesday the Fed announced they are reopening the repo window with daily overnight repo and one-week repo auctions. The auctions are to be conducted through October 14th. There is no mention of a reason for the Fed’s sudden concern about liquidity. This new round of operations may be a prelude to further liquidity injections through the election period when the possibility for market volatility is heightened.
The Wall Street Journal recently published an article highlighting the enormous surge in stock options trading. The graph below, from the article, shows that the volume of trading in single stock options now exceeds volume for individual shares. Because of this unprecedented condition, Viking Analytics Gamma RIA Pro reports are important to follow. The weekly report identifies the market levels which are likely to induce buying or selling from dealers that must actively hedge options activity.
September 16, 2020
Retail Sales will be released at 8:30 this morning, with expectations for a 1% increase. Along with labor conditions, this is the most important data we can follow to assess the recovery. We suspect, given credit card data, today’s number could be on the weak side of expectations. That said, economic data has been hard to predict due to the unprecedented conditions put upon the economy as well as the massive amount of fiscal stimulus.
A reminder, the Fed will release its latest monetary policy statement and Powell will follow it up with a press conference. Little is expected from the Fed meeting as it comes on the heels of Jackson Hole and relatively stable financial markets. Odds are the meeting may be a disappointment as its difficult for the Fed to make a case that they need to do more. That is unless they make significant changes to their economic/policy forecasts (“dot plots”). If they do weaken their projections for inflation, jobs, and/or economic growth, the market may take that as a signal that the Fed could become more accommodative.
Yesterday we presented a graph showing that the Fed now owns a sizeable share of the TIPs market. As we discussed, their sizeable activity is skewing TIP yields, and therefore, implied real (after inflation) yields. Gold has a strong correlation with real yields, as such, real yields help us gauge richness and cheapness of gold prices. The graph below shows the strong correlation between the two over the last decade. The orange dot highlights that at current real yields gold is fairly valued. However, we now must question whether real yields are accurate using TIPs pricing.
The chart below showing the composition of debt by credit rating over the last 40 years is telling. Consider that since 1980, the amount of A or better-rated bonds has been relatively the same. Since 2000 the amount of investment-grade debt (BBB or better) has been relatively constant. The large contributor to debt outstanding over both periods has been largely junk-rated bonds.
Using its proprietary Global Fund Manager Survey, Bank of America believes “long tech” (aka FANMG) is the most crowded trade in at least the last seven years.
September 15, 2020
Of importance on the economic calendar, this week will be Retail Sales on Wednesday and Jobless Claims on Thursday. The Fed’s two-day FOMC meeting ends on Wednesday with the release its monetary policy statement at 2:00 pm followed by the Jerome Powell press conference at 2:30 pm et. Also of note this week will be Friday’s quadruple witching options expiration, whereby four sets of cash and futures options expire on the same day. The simultaneous set of expirations can lead to heightened market volatility leading up to and on the expiration day itself. Yesterday’s strong move may, in part, be related to the expirations.
Teddy Vallee, in his tweet below, shows the sharp increase in the Fed’s ownership of TIPs. Given that the Fed has purchased such a large percentage of the TIPs market in such a short time, is there value in following market-implied inflation expectations (derived from TIP pricing)? The answer is yes, but its value is greatly diminished from years past. Unfortunately, there are few other indicators to help assess future inflation expectations. Equally problematic, and as we wrote in The Markets Are Sending Confounding Messages, the Fed is also eroding the value of market and economic signals they traditionally rely upon. To wit:
“Since inflation is, by definition, a monetary policy outcome, changes in market-based interest rates used to inform the Fed itself on the appropriateness of their policy stance. Today, however, the Fed thinks they are the wiser arbiter of the price of money. They override all market signals through quantitative easing (QE), among other extraordinary policy schemes.”
The Baker Hughes worldwide (1,050) and U.S. rig count (250) are now at the lowest levels since at least 1975. Both counts are also less than half of their recent averages. The graph below, courtesy EIA, shows that consumption of energy products fell sharper than production during the COVID lockdowns. However, the recovery of consumption is expected to rebound quicker than supply. If this forecast holds, and rig counts remain at or near current levels, oil prices may finally have a tailwind to grow.
September 14, 2020
The S&P 500 closed slightly higher, and in doing so, held above the 50-day moving average. The NASDAQ was not as lucky, falling .60% and below its 50-day moving average. Oddly, the VIX was down nearly 10% despite the broader markets being relatively flat. With overnight gains in the futures markets, both indexes should trade comfortably above the 50-day.
The Federal Reserve meets this Tuesday and Wednesday to update their monetary policy stance. It is highly unlikely that the Fed will make any changes to its QE operations in terms of size, pace, or assets. We do, however, suspect the Fed will focus its attention towards the growing headwinds to growth and recovery. In particular, they will likely highlight that fiscal stimulus is eroding quickly and without new legislation, the economic recovery could falter. Given the upcoming election and partisan politics, any warnings will likely fall on deaf ears in Washington.
CPI exceeded economists’ expectations for the third consecutive month, rising 0.4% monthly, and 1.3% annually in August. Used car prices were a significant driver of the gains as they rose 5.4%.
In this past Friday’s Artete’s Observations, he points out that corporate executives, as judged by their personal financial decisions, may not be as optimistic about economic recovery as they would like us to believe. To wit:
“US executives sold $6.7bn of stock in their own companies last month [August], cashing in on a record-breaking market rally with the biggest burst of selling in five years.”
“CEOs are normally optimistic about the companies they run. After all, that’s partly what they get paid to do. When they sell, then, it rarely bodes well for the stock. And, by the way, they know better than anyone else how the company is performing. This particular bout of selling meaningfully contradicts the market optimism at the end of the summer.”
The graph below, courtesy of the Pew Research Center, shows a rising trend of young adults living with their parents over the past two decades. Weak wage growth, housing inflation, and student debt are the predominant factors behind the disturbing trend. This age group is also the hardest hit from the COVID related shutdowns. As such, the percentage of young adults at home is now beyond that of the Great Depression.
September 11, 2020
Bespoke Investments helped put the recent market decline into perspective as follows: “This has been the worst five days for the S&P 500 where the index still closed above its 50-DMA since 1934.” As of yesterday’s close, the index is still about 20 points above its 50-day moving average despite being off nearly 7% from recent record highs. Little technical damage has been done. This serves as evidence of just how extended the market was. However, with that in mind, a break of the 50-day moving average may portend further weakness.
The weekly Initial Jobless Claims Report showed 884k new claimants, which was identical to last week and above expectations of 828k. Continuing state claims increased by about 100k. The total number of people claiming benefits, including Federal, rose by nearly 400k. It appears the number of filers for Federal assistance rose by 90k last week on top of an increase of 140k the week prior. These are predominately self-employed people.
Monthly and annual PPI were 0.1% higher than expectations. Year over year PPI, excluding food and energy, rose 0.6%. While low, it is 0.3% more than expectations. The Fed tends to gauge inflation trends excluding food and energy prices. The good news with a higher PPI, is that pricing power is being restored to producers meaning, economic activity is normalizing.
As we noted earlier in the week, Softbank’s strategy is to buy call options, which in turn forces options dealers to buy the underlying stocks which Softbank owns. The graph below, courtesy SentimenTrader, shows that small retail traders are also getting in on the game. The graph also attests to the highly speculative nature of many retail investors that have developed over the last few months.
The “K”-shaped recovery in real estate continues to roll on. While the residential property market in many suburbs is on fire, commercial real estate demand is crumbling, as shown below.
One of our concerns, which we have raised over the last month, is the recovery appears to be stalling. Our thought is largely based on near real-time retail spending, consumer confidence, jobless claims, and other indicators. Most government economic data is often lagged by one or two months, making it challenging to see precise turning points. Unfortunately, as shown in the graph below, courtesy Bloomberg, our concern may also be global.
September 10, 2020
As we have written over the last few weeks, gamma is an important factor in driving markets. On Tuesday, we introduced a new weekly RIA Pro report, from Viking Analytics, which shares important options gamma trading levels. In this week’s Weekly Gamma Band Update, they point out the S&P level of 3397.15 as being Gamma neutral. When the S&P is below that level, dealers are likely to be net sellers to hedge options positions and vice versa above it. As the index moves further away from the neutral level, the amount of hedge related buying or selling should increase. The neutral level at times can act as a magnet. For instance, yesterday the market sold off decently towards the close and ended at 3398 or on top of the gamma neutral level.
Jobless claims are expected to fall to 828k from 881k last week. Again, this data is not entirely comparable to the prior months due to last week’s change in the seasonal adjustment calculations. Producer Prices (PPI) are expected to rise by 0.2% monthly but fall 0.3% on a year over year basis. CPI, to be released on Friday, is expected to climb 0.3% monthly and 1.2% year over year.
The BLS JOLTs report provided interesting labor data as follows:
The number of unemployed persons per job opening fell from 3 to 2.5. The ratio was below 1.0 prior to COVID.
The number of job openings rose from 6mm to 6.62mm.
The only troubling piece of data in the report was that the number of hires fell from 7mm in June to 5.8mm in July. Essentially the pace of jobs recovery slowed in July, something confirmed in the ADP report but not the BLS employment report.
Over the last two and a half years, gold has rallied in a series of strong gains followed by triangular consolidations. Once again, after a price surge in July and early August, gold has been consolidating. Currently, the price of gold is sitting on its 50-day moving average as well as the support line of its recent consolidation. Its Williams %R is nearing oversold territory and its MACD is nearing a positive flip. If gold breaks higher, it could quickly elapse the prior record high near 2100, however, if it breaks below the pattern, the next level of strong support is 1700-1750, being the prior consolidation region and the 200-day moving average. We believe it will break higher and are positioned accordingly.
September 9, 2020
The only economic data of consequence this week will be the key inflation figures (PPI on Thursday and CPI on Friday). The Fed will be quiet as voting Fed members are now in a public blackout period prior to the FOMC meeting scheduled for next Tuesday and Wednesday.
Crude oil has fallen sharply over the last week and now sits at two-month lows. It is also below a technically important weekly resistance line and its 50-week moving average. The circles in the weekly chart below highlight the number of times that crude oil bounced higher off of what was support in the low 40s. In early 2016, the support was breached, but the price ultimately had no trouble rising back above the line. Now that crude is below the support line, we shall see if the line acts as resistance or it bounces back as in 2016.
The mystery behind the large percentage gains in the FANMGs, poor market breadth, and odd VIX behavior has been revealed. SoftBank disclosed they are sitting on multi-billion dollars of profits from options trades. The profits are the result of a self-orchestrated “gamma squeeze.” Essentially, as detailed in this telling Zero Hedge Report, Soft Bank and other hedge funds buy stocks and then buy short-dated call options on those stocks, which force dealers that hedge to buy the stocks. Their actions, along with those from copycat traders, creates a circular trading pattern that pushes these favorite stocks higher. To wit:
“These bizarre trends, where one or more players are furiously buying calls and pushing both the implied vol and gamma (in both single stocks and the broader market) ever higher while dealers were caught short gamma and were forced to chase stock prices to obscene levels, creating a feedback loop where the more calls were bought the higher the underlying stock price surged, leading to even more call buying and the paradox of a record high vix at an all time high in the S&P500 (in fact the last time we had observed such a confluence was the day the dot com bubble burst)…”
As we see, this strategy works both ways. To avoid getting squeezed, dealers may try to push some stock prices lower. We should expect extreme volatility, especially in the “market favorites” over the coming weeks as the battle between dealers and traders rages on.
September 8, 2020
Friday’s Employment report was strong, meeting expectations for about 1.4 million net new jobs and showing a sharp decline in the unemployment rate from 10.2% to 8.4%. While the report is very encouraging, there are two points worth considering. Permanent unemployment rose by about half a million people to 3.4 million. Second, nearly 300k of the new jobs are the result of temporary jobs created by the Census Bureau. Regardless, improvement in the labor market is beating all expectations from a few months ago.
From the Fed’s perspective, the employment data still gives them plenty of reason to keep providing excessive liquidity. Prior to Jackson Hole, the markets may have paused and asked if the jobs data implies the Fed is getting closer to ending QE or possibly raising rates. Since the new framework was announced, that should not be the case as unemployment can be too high but never too low.
On Friday, China’s Global Times reported that China may “gradually” reduce its holdings of U.S. Treasury bonds. Specifically, the article discusses a $200 billion decrease from approximately $1 trillion. Ballooning deficits and Trade war are cited as rationales. Normally this might be concerning, but with the Fed as active as they are, the prospect of the Fed absorbing $200 billion over a period of time is not daunting. Throughout March and April, the Fed added on average $277 billion in assets per week. In fact, during the last two weeks of March, they added $1.143 trillion to their balance sheet, which is more than China’s total holdings. Bonds traded poorly on Friday in part because of the news.
The tweet and charts below, courtesy Liz Ann Sonders, show the strong relationship between implied volatility (traders’ expectations for volatility based on options pricing) and realized volatility based on what the market actually does. Volatility has an inverse relationship with liquidity. When volatility is high, it is because there are gaps in the bid/offer market structure which, results in larger than normal price movements up and down. We recently wrote about this concept in Volatility Is More Than a Number, Its Everything. As Liz states, there may be more volatility to come.
Last week we mentioned how government stimulus was waning and the importance of the Fiscal Cliff. The graph below puts this concern into context. Federal Outlays typically account for about 15-20% of GDP. Currently, they account for nearly half of GDP. If government spending declines faster than economic activity recovers, a resumption of the decline in economic activity will almost certainly occur.
September 4, 2020
The consensus estimates for today’s BLS employment report are for the net creation of 1.4 million new jobs, unemployment falling from 10.2% to 9.8%, and a slight increase in the labor participation rate to 61.6%. The range of estimates remains extremely large. For instance, the increase is net payrolls is between 435k and 2mm, versus what is typically about 100k.
Initial Jobless Claims fell by 130k to 881k. The only problem is that it is not comparable to prior numbers. Starting this week, the BLS changed their computation methodology regarding seasonal adjustments. The non-seasonally adjusted number rose by 7k, likely meaning much of the drop in the headline number was due to their new math. Last week, the number of people using Federal assistance rose by 151k, 20k more than state claims dropped. As of August 15th the total number of persons claiming state and Federal benefits rose from 27mm to 29.2mm.
Over the last week, we saw some signs of life in value stocks. The relative outperformance of value over growth was noteworthy during yesterday’s selloff. Yesterday, growth (IVW) was down 4.25% and value (IVE) was down 1.85%. We have been taking a more conservative tact recently by reducing exposure and positioning away from growth towards value. Accordingly, we will are paying close attention to see if the outperformance can continue.
Our World In Data, affiliated with the University of Oxford, compiles and shares interesting data on an array of topics. We recently stumbled upon an interesting report in which they show that the degree of economic sanctions put on various countries to stop the spread of COVID has little correlation with economic activity. To wit: “But among countries with available GDP data, we do not see any evidence of a trade-off between protecting people’s health and protecting the economy. Rather the relationship we see between the health and economic impacts of the pandemic goes in the opposite direction. As well as saving lives, countries controlling the outbreak effectively may have adopted the best economic strategy too.” For example, Sweeden had few economic sanctions but it shows up on the graph right next to the United States.
September 3, 2020
ADP, which has a strong historical correlation with the BLS employment report, was much weaker than expected. ADP reported that 428k jobs were added in August versus a 1 million estimate. ADP revised the July report higher by 45k jobs to 212k, but it still stands well short of the July BLS report of 1.76 million new jobs. ADP data, which comes directly from employers, raises the specter that Friday’s BLS report could be well below the estimate for 1.4 million new jobs. That said, the BLS uses surveys, not hard data, so all bets are off.
Apple (-2.10%), Tesla (-5.90%), and Lumber (-4.00%), the three recent media favorites, were hit yesterday and the market didn’t skip a beat. The Dow, S&P, and NASDAQ were all up over 1%. The VIX continues to rise and bond yields fall despite the strong equity gains. At least the breadth was a little better yesterday, with total market advancers accounting for almost two-thirds of all U.S. stocks. Another oddity from Wednesday worth noting, gold was down 1.50% as the dollar was strong, yet gold miners (GDX) posted a gain.
Another day and another valuation extreme was reached. Yesterday, as shown below, courtesy of Zero Hedge, the forward P/E on the S&P 500 traded at a record high, breaking the prior record from 1999.
The Fed Funds futures market has fully bought into the Fed’s new policy framework, which essentially declares that interest rates will not rise for a long time. The furthest out Fed Funds contract, August 2023, is priced for a 25% chance of a rate reduction. Going forward, price fluctuation in the forward contracts will be almost entirely based on changing odds for a reduction of rates below the zero bound.
To put more context around Apple’s stock meteoric rise over the past six months, its market cap is now equal to the total market cap of the Russell 2000 Small Cap Index, as shown below. The stock is trading 65% above its 200-day moving average, an extreme last seen fifteen years ago.
September 2, 2020
Yesterday saw yet another bad breadth day in the equity markets despite a strong move higher in the broad indexes. Including over 7,000 stocks in the NYSE, NASDAQ, and AMEX exchanges, 43% of issues were lower on the day. The heat map below shows large swaths of the S&P 500 were red despite the index being up .75%.
Yesterday’s manufacturing surveys were mixed with ISM coming in slightly better than expectations and PMI on the weaker side. Both surveys are above 50, in expansionary mode, and thus signaling that managers of manufacturing facilities think the general direction of production is improving. The ISM Employment Index remains in contraction mode but improved from 44.3 to 46.4. New orders, a leading indicator, continue to rise sharply and is at the highest level in over 15 years. Again, this survey is not an absolute indicator of output, but simply a count of the number of managers that believe things are better this month than last month.
The term Fiscal Stimulus Cliff describes the declining amount of Federal stimulus flowing into the economy and the dampening it will likely have on economic activity. There is also a Legal Cliff that warrants our attention. To wit, yesterday, the Wall Street Journal wrote on the expiration and curtailment of various state moratoriums for retail tenant evictions. Many retail establishments have been able to stay afloat via reduced or even no lease payments over the last six months. That will begin to change as the landlords, many of which are leveraged and have interest payments of their own to make, will now be able to take action.
Tesla, continues to charge ahead. On Monday, the stock rose over 12%, seemingly because of the stock split. To put the gain into perspective, its market cap, on just Monday, increased by two times the market cap of Ford. The stock gave up some of those gains yesterday as they announced they would issue $5 billion worth of new stock. Interestingly, Tesla will issue new shares at the market on an ad hoc basis. Frequently, companies issue shares in a large block and often at a slight discount to the market price.
September 1, 2020
Today, the most widely followed manufacturing surveys, ISM and PMI, will be released. Both are expected to dip slightly but remain in expansionary mode. We will pay close attention to the ISM employment sub-index, which has not rebounded nearly as sharply as the entire index. On Wednesday, ADP will release its employment report to be followed on Friday by the BLS employment report. The consensus of forecasters expects ADP to show a pickup of 1 million jobs in August.
There are several Fed speakers throughout the week including, Mester, Kashkari, Brainard, Evans, and Bostic. We are on the lookout for more details about how the Fed will try to generate more inflation.
Fed Vice Chair Clarida spoke yesterday and stated the following about their new policy framework: “This change conveys our judgment that a low unemployment rate by itself, in the absence of evidence that price inflation is running or is likely to run persistently above mandate-consistent levels or pressing financial stability concerns, will not, under our new framework, be a sufficient trigger for policy action.” – Essentially he tells us that even if we get back to record low unemployment, the Fed may still keep rates at zero, assuming inflation is weak. The framework argues that the rate hikes from 2015 to 2019 would never have occurred under the Fed’s new policy.
“The Fed is never going to say the cupboard is bare because that’s alarming. But they’ve reached the area of very rapidly diminishing returns”
“The Fed is operating at the margins. That needs to be recognized. If it’s not recognized, there is a risk people are overinvested in what the Fed can do”
Last Friday, Japanese Prime Minister Shinzo Abe stepped down due for health reasons. Over the last 8 years, “Abenomics” or the three arrows of stimulus, have powered Japanese markets higher. The Nikkei has more than doubled over the period after trending downward for over 20 years. While his efforts ended deflation and boosted asset prices, GDP shrunk over the 8 year period. From a market perspective, the concern is whether or not his predecessor will continue to stimulate markets to the same degree. Providing some comfort, BOJ Governor Kuroda is not expected to step down.
The VIX volatility index is now at a one month high and up about 25% over the last two weeks. The gains come despite the S&P 500 rising 7% over the same period. The red lines in the graph below show the last four instances when the correlation between the S&P 500 and VIX was positive.
Warren Buffett’s favorite market valuation indicator, total market cap to GDP, is now more expensive than it was before the tech bubble crashing.
August 31, 2020
IMPORTANT NOTE: APPLE & TESLA SPLITS
Portfolios do not current reflect the stock split yet on AAPL and TSLA so valuations and performance are incorrect.
We are in the process of updating the coding for the adjustment.
Thank you for your patience.
One of the oddities of this economic recovery is the number of gross distortions in steadfast economic and market relationships. These uncommon divergences are occurring in large part due to the unprecedented nature of the economic crisis and the substantial fiscal and monetary stimulus being deployed to counteract it. The graph below, courtesy of Pervalle Global, shows how a historically strong relationship, lending standards on credit cards and retail sales, has completely broken down.
On a personal note, the credit line on my Capital One credit card was cut two weeks ago, despite a high credit score and a perfect record of paying the card in full monthly. I have come to learn on Friday that its not a reflection of my credit. Per Bloomberg : “Capital One Financial is cutting borrowing limits on credit cards, reining in its exposure as the U.S. reduces support for millions of unemployed Americans.” Capital One is the 3rd largest credit card issuer in the U.S. Waning fiscal stimulus and reduced credit card limits from Capital One and other card issuers will surely be a drag on personal consumption in the months ahead.
The Capital One news helps us better understand why monetary velocity, as shown below, courtesy Brett Freeze, is falling rapidly. The charts approximate monetary velocity on a monthly basis. While the supply of money is rising due to QE operations, the velocity, or the rate at which money is circulating within the economy, is falling. QE will only drive inflation higher if the banks take the reserves the Fed gives them in exchange for bonds and lends the money. As the data shows that it is not occurring.
On numerous occasions over the last month, we have discussed the weak breadth underlying the market despite the strong performance. The graph below highlights the recent bout of the relatively weak correlation between the market-cap-weighted S&P 500 and the equal-weighted version. This is just another way of showing how the top five to ten companies are driving the market higher, while many other stocks are not faring nearly as well.
On CNBC, Cleveland Fed President Mester was quoted as follows: “I don’t feel right now that we are engendering an asset bubble. .. Yes, stock prices are elevated and you’re right to point that out.” She is the second Fed President in as many days to acknowledge that valuations are “elevated.” Publically they will never voice too much concern over asset prices, but given these statements, we wonder if this is a bigger deal in internal Fed discussions related to monetary policy.
August 28, 2020
Second Quarter GDP was revised higher from -32.9% to -31.7%. Initial Jobless Claims were slightly higher than expectations at 1.006 million. Through August 8th, total jobless claims, including Federal beneficiaries, fell from 28mm to 27mm. As asked noted last week, is it falling because people are finding jobs or because people laid off in late February are exhausting claims. Likely a combination of both.
Jerome Powell led off the Jackson Hole conference by announcing the Fed has unanimously approved a new long-run policy framework statement. They are abandoning the prior policy, which relied on higher interest rates to fight inflation. The Fed has two Congressionally-chartered mandates: maximum employment and stable prices. Powell made it clear that employment will take precedent over price stability. To accomplish this goal, they will target an average inflation rate. Specifically, Powell said they would aim to average “2% over time.”
The Fed prefers PCE to gauge prices over CPI. If we assume the Fed wants PCE to average 2% over the last five years and the next 5 years, they will need to aim for a 2.6% target PCE rate. That equates to an approximate 3% CPI rate for the next five years.
The important takeaway is that the Fed’s focus is now on maximum employment. The dual mandate has become singular at the expense of price stability. Employment data, both weekly claims, and the monthly jobs reports will now become even more important gauges to assess monetary policy.
Click on the picture below for two paragraphs from Powell’s speech that are circular and raise a lot of questions.
On Wednesday, we published The First Trillion is Always the Hardest- Analyzing Apple Mania, which in part, discussed how expensive Apple’s (AAPL) stock has become. For a more in-depth perspective, we take the analysis a step further by comparing AAPL to another market darling Amazon (AMZN). At the end of 2018, both companies had similar market caps of approximately $700 billion. Today AAPL sits at $2.1 trillion which is about $500 billion more than AMZNs market cap. The amazing part of Apple’s outperformance is that over the one and half year period, AMZN has grown earnings and revenue significantly faster than AAPL. Additionally, AMZN benefits much more from COVID related shutdowns than AAPL. The simple analysis below by no means is implying that AMZN is cheap, but you certainly get a lot more for your money with AMZN than AAPL.
Options trader Matt Thompson (@dynamicvol) noted the following: “Spot $VIX now 12.4 points over 20d realized vol, near a record since 2004.” Basically, the amount of expected volatility in the coming month is significantly more than what the market has witnessed over the last 20 days.
We leave you with a cartoon that seems appropriate for the Fed’s Jackson Hole conference this weekend.
August 27, 2020
Yesterday was another odd day in the markets. The S&P 500 closed up over 1% despite more stocks being down than up. Further confounding, the volatility index (VIX) rose 5.60%. The tweet below from Sentimen Trader is yet another example of the extreme state of investor sentiment.
Fed Chairman Powell opens up the Jackson Hole annual conference at 9:10 this morning with a keynote speech. It has been widely reported that he will deliver a “profoundly consequential” message in which he will increase the Fed’s inflation target. From what appears to have been leaked, the Fed, via average inflation targeting, will aim for 2.5% inflation, versus their current 2% target. Powell may surprise us with a new policy to generate more inflation, but we think it’s more likely the Fed’s plan will involve keeping rates at zero well after a durable recovery takes hold. Such a plan would also use guidance to stress their intentions to keep rates grounded going forward.
In addition to inflation and monetary policy discussions, we are curious to see if any Fed speakers make a note of high valuations in many asset markets. While we think it’s unlikely they would want to upset the markets with such talk, it was interesting that Richmond Fed President Tom Barkin stated: “There clearly is some risk as valuations get elevated.”
In our weekly Relative Value Reports (8/21 Report), we use 17 technical gauges to provide a score. The score helps us determine if an index or security is overbought or oversold versus its benchmark or on a standalone, absolute basis. The graphs below show that the S&P 500 is now more overbought using this assessment than only one other time in the last 20 years. This jibes with many other technical and sentiment indicators, some of which are components of this model. Extreme technical readings don’t necessarily mean a top is imminent. Still, it does mean we should be mindful of the potential for a reversal or, at the least, a period of consolidation.
The graph below, courtesy Cornerstone Macro, shows that value stocks underperforming growth stocks is not just a U.S. story but one occurring globally.
August 26, 2020
New Home Sales rose last month at a 13.9% pace, the largest growth rate since 2006. New Home Sales are now up 36% from a year ago. Toll Brothers reported that third-quarter net signed contracts were its highest ever for a third-quarter in both units and dollars. Two measures of house pricing data showed prices rose more than expected.
The Conference Board’s Consumer Confidence Index fell sharply from 92.6 to 84.8, well below expectations for a slight improvement. The reading is now back below levels from March and April. Consumer sentiment compared to housing data provides an interesting dichotomy. Consumer sentiment is weak, yet at the same time, some consumers are making large investments in real-estate. As we have suggested, the recovery is beneficial to some while hurting many others.
The graph below, courtesy JPM and The Market Ear, shows the net long position of euro futures contracts is at 3.5-year highs. The last time it was this stretched, June of 2018, the euro peaked and fell for almost two years. The extreme net long positioning, along with a high correlation of net positioning to price, is yet another reason we believe the dollar might rally from current levels.
The Wall Street Journal had a very interesting article showing which stores and companies are winning and losing the battle to gain consumers during the pandemic. Not surprising, companies with great online infrastructure and full inventories of products most in demand are able to grow sales despite the poor economy. To that point, “Walmart, Amazon, Target, Home Depot, Lowe’s, and Costco accounted for 29.1% of all U.S. retail sales in the second quarter.” The gains came at the expense of small businesses and traditional brick and mortar stores that do not have a great online presence.
August 25, 2020
A slew of housing data will be released this morning, including the Case-Shiller House Price Index, FHFA House Price Index, and New Home Sales. As we saw last week with soaring existing home sales, we suspect this week’s data will also be strong as a lack of supply, record-low mortgage rates, and de-urbanization are driving a suburban housing boom. Jobless Claims on Thursday will be of interest, as will Personal Income, Chicago PMI and Consumer Sentiment on Friday.
Investors are anxiously awaiting the Fed’s Jackson Hole conference on Thursday and Friday. Jerome Powell leads it off Thursday with a speech at 9 am. Will he be dovish enough appears to be the question that is likely to steer markets? The answer to this question may likely revolve around their willingness to get more aggressive in pushing for higher inflation. Various Fed members have voiced a desire to let inflation run hot. In Fed-speak they call this average inflation targeting. The term means that even though the targeted inflation rate is 2%, they might let it run at 3-4% for some time to offset prior periods of slower than 2% growth. PCE, the Fed’s preferred inflation index, has averaged 1.50% over the last decade. The last reading was +0.8%.
The graph below shows that corporate debt has soared over the last few months. Prior to COVID, the ratio of corporate debt to GDP stood at a record high, and slightly above levels that preceded the last three recessions. Most of the corporate debt being added today is for liquidity uses and not for Capex or other productive purposes. As such, corporations will emerge from the crisis with more debt and interest expense but no corresponding rise in income. This new debt will be a drain on future earnings and economic growth. Keep in mind the graph overstates the increase in the ratio as GDP, the denominator, will rebound sharply this quarter.
The quote of the day is from Morgan Stanley- “The equity market has traded soft under the surface of the headline indices, which are now being driven by just one stock—Apple.”
Investor greed and fear can be calculated and expressed in many different ways. Currently, many surveys and technical readings indicate near-record levels of optimism and greed. Per the graph below from SentimenTrader, the options market is “all greed no fear”! As their data shows, Gamma exposure, a measure of sentiment in the options market, has surpassed levels, which in the past resulted in sizable market downturns.
August 24, 2020
Despite new record highs in the S&P and NASDAQ 100 only 6% and 2% respectively of the underlying components are at records. The weakness of breadth is becoming starker by the day. The Tweet below courtesy of The Bear Traps Report shows that two of the worst ten breadth days, using his measures, occurred last week.
The “K” shaped recovery is alive and well, with some sectors doing well and others languishing. Residential housing, for instance, is a beneficiary of new motivations to move out of densely populated urban areas. On Friday, Existing Home Sales for July jumped 24.7% from June’s level, breaking a record for the largest single-month gain. Helping fuel sales is a lack of supply. The inventory of housing is still over 20% less than a year ago. Per the National Association of Realtors (NAR)- “The housing market is well past the recovery phase and is now booming with higher home sales compared to the pre-pandemic days,” said Lawrence Yun, NAR’s chief economist. “With the sizable shift in remote work, current homeowners are looking for larger homes and this will lead to a secondary level of demand even into 2021.”
We are paying close attention to the reflation trade. Since mid-March, when 5-year inflation expectations troughed at 0.14%, they have risen steadily to peak a week ago at 1.57%. Recently they have flatlined. In last Friday’s Relative Value Report we stated- “Investors in Industrials and Transportations sectors are clearly betting on a continuation of the reflation trade. Recent weakness in oil and copper, as well as the daunting fiscal stimulus cliff, make us wary of the inflation trade. We reduced exposure to Transports and Industrials this week while adding to Realestate.” Copper has historically been a good proxy for inflation and economic activity. Copper is often referred to as Dr. Copper for just that reason. The graph below shows that the price of copper has stagnated over the last month and is coming under pressure recently.
The graph below shows COVID-related stimulus distributed by the government. While the current level of stimulus appears to be small but at $15 billion a week, it represents over 4% of GDP.
The graph below shows how the number of small businesses opening back up recovered for a while but stagnated and, more recently, has begun to turn back down.
August 21, 2020
Initial Unemployment Claims ticked back up to 1.106 million versus expectations of 963,000. Continuing Claims fell to 14.844 million from 15.480 million. The drop in continuing claims may be considered encouraging by the media, but there is a negative side they may not be considering. State unemployment claims are only paid for 6 months. As such, some of the people fired in February as COVID shutdowns began, are seeing benefits expire. The number of people in this group should expand in the coming weeks. Including federal and state assistance, the total number of people receiving jobless benefits is still over 28 million.
Tom DeMarco of Fidelity provides commentary about possible market reactions to next week’s Jackson Hole Fed meeting and the FOMC meeting on 9/16: “At this point the risk of a “sell-the-news” reaction seems quite possible as it will be difficult if not impossible for the Fed to generate a dovish surprise as the papers have been jammed with articles previewing the “radical” shift to an average inflation target with the topic discussed in myriad Fed speeches and papers and I expect more to come at Jackson Hole on Aug 27-28.” Essentially Tom argues the market may stumble as it is challenging for the Fed to provide even more stimulus than what they are doing or talking about doing.
As the heated Presidential election draws closer, the chart below, courtesy Bank of America, is worth consideration. During Presidential election years, September and October tend to be weak, while June, July, and August have been the strongest. Currently, the volatility term structure (VIX) is pricing in anxiety around the election. The September contract is currently trading at 25.60, October jumps to 29, and December through April is relatively flat at 27.50’ish. In the same periods running up to the 2012 and 2016 elections, there was no discernible kink in the VIX curve as currently exists.
The graph below shows the ratio of the S&P 500 value index to the growth index. Growth has greatly outperformed this year and for the last several years. However, since July value has held its own versus growth, and may be providing early signs that the trend may be reversing. To be more confident in that thesis we would like to see the price ratio below break above the wedge pattern and the 50-day moving average. We have shifted slightly from growth to value over the last few weeks, including the purchases of XOM, CVX, T, and VIAC.
August 20, 2020
The Fed released its minutes from the most recent July 29th FOMC meeting. The key takeaways are as follows:
The Fed is still very concerned about the sustainability of the recovery
Many members voiced concern about the costs and limitations of yield curve control in the current environment. It seems, based on the minutes, they may shy away from targeting or capping yields unless market conditions change.
They still believe there are significant financial stability risks, especially with small and medium-sized companies.
The dollar rallied strongly on the Fed minutes. Gold fell as real rates rose (were less negative). Bond yields rose as yield curve control (more active QE) is not as definitive as once thought. Stocks struggled as the message may not have been dovish enough for the markets. Like an addict, the market needs more stimulus, not just the same amount.
There seems to be growing chatter about a Congressional compromise on a “small” $500 billion stimulus deal that does not include another round of one-time checks or any municipal aid.
Apple hit a $2 trillion market cap yesterday, and The New York Times had an interesting article yesterday, putting the recent gains into context. They state:
“It took Apple 42 years to reach $1 trillion in value. It took it just two more years to get to $2 trillion.
Even more stunning: All of Apple’s second $1 trillion came in the past 21 weeks, while the global economy shrank faster than ever before in the coronavirus pandemic.”
Year to date, Apple’s revenue has increased by 2.2% while EBITDA is flat. Needless to say, the entire gain this year is based on multiple expansion. Its price to earnings ratio now stands at 36, double that seen at its March lows, and well outside of the 15-20 range it traded in for the last five years.
The graph below shows the recent correlation between the S&P 500 and 5-year breakeven inflation expectations as measured by the TIPs market. Both indices have now fully recovered their losses from March. The relationship, while strong in the time frame shown, has not always been as well correlated. Before COVID, from March of 2018 to February of 2020, inflation expectations were generally declining while the stock market surged higher. Can inflation expectations continue to rise as the growth of fiscal spending flattens or even declines? If not, what does that portend for stocks? The following link from Ambrose Evans-Pritchard in The Telegraph provides a well-written discussion describing the combating forces of inflation and deflation to help you better assess the situation.
August 19, 2020
During Walmart’s earnings announcement yesterday, the CFO offered a warning of sorts as he stated that government stimulus checks were mostly spent by July. The comment helps explain why retail spending data started to stagnate over the last month or so. The recovery has been fueled by federal and state stimulus, and, as such, assessing third and fourth quarter economic activity relies significantly on determining how much more the states and federal government will provide citizens.
The graph below compares the gross underperformance of gold miners (GDX) to gold over the last ten years. From late 2011 to early 2016, gold fell sharply while fell by even more. Since they both bottomed in January of 2016, GDX has risen 250% while gold is up nearly 100%. Despite the marked outperformance, miners are still about 30% off the highs of 2011, while gold recently set a record high. If the price of gold continues to increase, miners will most likely continue to play catch up as they are leveraged both operationally and financially.
A subscriber asked for an update on our article Tesla’s Moonshot, How High Can it Go? Since publishing the article on August 8th, Tesla’s market cap has risen 35% and is the largest automaker at nearly 1.5 times the market cap of Toyota, the second largest automaker. With the latest earnings update, Tesla has a price to sales ratio of 14, which dwarfs the industry ratio of .60. Despite accounting for less than 1.50% of global auto sales, Tesla’s market cap is about a third of the entire industry. To answer the question in our title- apparently much higher.
We end with a very well written report by James Montier in which he discusses the absurdity of markets. To wit: “Voltaire observed, “Doubt is not a pleasant condition, but certainty is absurd.” The U.S. stock market appears to be absurd.”
August 18, 2020
The economic docket will be slow this week. Of interest will be Housing Starts this morning and Jobless Claims on Thursday. The Fed will release its minutes from the July 29th FOMC meeting on Wednesday afternoon. Currently, there are no Fed speakers scheduled to speak this week. The Jackson Hole Fed conference is scheduled for the weekend of August 28th. Again, we will be on the lookout for any clues as to new or modified policies that may result from the meetings.
Over the weekend, Warren Buffett’s Berkshire Hathaway announced a $545 million stake in Barrick Gold (GOLD), a gold miner. While Buffet has been notably anti-gold for decades, the purchase does not come totally as a surprise. For one, his father was a gold bug and frequently preached the benefits of a gold-backed currency. Second, and probably the rationale for the purchase, miners are very cheap, and at current prices, they are profitable cash flow producing businesses. We should also put his new into context as it accounts for less than one percent of his total portfolio.
It is worth considering that if Buffett’s purchase gives a green light of sorts for traditional money managers to add gold exposure, it could provide a powerful lift to gold stocks as they are relatively small. Consider the two largest holdings of GDX are Newmont (NEM) and Barrick (GOLD), which in aggregate make up over 25% of the ETF. Their market caps are approximately $53 billion each. If the market cap of the entire index is approximately $200 billion, it will not take much buying to push it significantly higher.
The chart below, courtesy Goehring & Rozencwajg, shows that commodities are the cheapest in at least 120 years as compared to the Dow Jones Industrial Average. With gains in productivity over time, we should expect the ratio to decline as it has done. However, as shown in the late 1970s and 1980s, inflation can reverse the ratio dramatically.
Lastly, on the topic of commodities, Lumber has risen sharply, as shown below.
August 17, 2020
Retail Sales fell short of expectations on Friday, coming in at +1.2% versus expectations of 1.9% growth and 8.3% growth last month. Given that stimulus is waning and consumer sentiment, as shown below, remains weak, the disappointment in consumption should not come unexpected. Looking forward, we will assess if the consumer recovery can continue with a smaller helping hand from Uncle Sam. It appears Congress will be on break through the month, so if there is any relief, it will likely have to come from executive orders.
The Baker Hughes Rig Count fell by 4 rigs to 172, from 176 last week, and a nearly 700 running rate prior to the crisis. Again, despite the price of oil stabilizing in the low $40’s, oil companies appear loath to expand drilling operations. This period of lessened activity is based on expectations for a continuation of weak demand as well as expectations for lower oil prices in the future. Currently, Crude futures predict little price change over the coming year. The current contract (September) is at $42.23, with the September 2021 contract at $44.67.
Over the last decade, stock buybacks have been a popular way for corporate executives to boost earnings on a per share basis. While earnings are not affected in a buyback, the denominator, number of shares, in the earnings per share (EPS) formula is reduced, thus EPS rises. The record number of shares buybacks, especially for larger companies, has been one reason attributed to recent stock gains over the last five years. Another reason has been a reduction in the number of listed companies. The graph and commentary below, courtesy the Market Ear, shows that there are about half as many public companies today versus 1996.
Tenants at Class C buildings paid 54% of rent by mid-month in June, but that percentage slipped to 37% in July. These renters are mainly blue-collar and heavily supported by fiscal stimulus. The decline in rents is likely the result of waning stimulus payments.
The graph below, courtesy Arbor Research, shows that investors have been rushing into inflation-protected bonds as inflation expectations have been rising.
August 14, 2020
Initial Jobless Claims improved again and dropped below the 1 million per week pace. Initial Claims were 963k versus an estimate of 1.15mm. The aggregate of all people receiving Federal and state unemployment aid also fell nicely to 28.25 mm from 31.3 mm. The two-week trend is positive, but the sheer number of claims are still enormous compared to January and February levels.
Corporate spreads and yields are at or near record lows, which denotes extreme economic confidence by investors. The condition is not necessarily confidence in the corporations and their ability to generate earnings, but solely due to Fed purchases of corporate bonds. By default, many bond investors must ignore the significant risks facing the corporate bond market and participate. The New York Fed recently made note of the risks in their article- Implications of the COVID-19 Disruption for Corporate Leverage – “Looking ahead, we find that a sizable share of U.S. corporations have interest expense greater than cash flow, raising concerns about the ability of those corporations to endure further liquidity shocks.”
To further stress the disconnect between yields and reality, Lisa Abramowicz from Bloomberg recently noted that “The lowest-rated US investment-grade bonds are trading as if they were Treasuries. Yields on BBB rated debt hit an all-time low of 2.21% on average last week, less than the yield on 3-month T-bills back in March 2019.”
The graph below shows that 30- year conforming mortgage rates have fallen below 3% to 2.88%, the lowest in the last decade. In fact, they are also the lowest since at least 1971, when the Fed started tracking mortgage rate data. As we will elaborate in an article next Wednesday, bond yields no longer provide financial, economic, or price information.
As we have mentioned numerous times, consumer spending accounts for nearly 70% of economic activity. With that in mind, consumer sentiment and willingness to spend are always important gauges. The graph below shows that nearly 25% of households are worried to some degree about their jobs. The data does not bode well for spending, but as shown the last time the survey was at a similar level was toward the end of the 2008/09 recession when the economy was recovering in earnest and the jobless rate would fall for nearly a decade. The hope is the survey is at or near its peak and will turn lower soon.
We leave you with a graph that shows how massive flows into passive investments, and by default, into market cap weighted indexes, has benefited larger companies much more than smaller ones. For more on this topic, please read our article Passive Fingerprints Are All Over This Crazy Market.
August 13, 2020
The Treasury reported that the year to date fiscal budget hit a record of $2.8 trillion. Over the same period, the amount of Treasury debt outstanding has risen by nearly $4 trillion, half of which was purchased by the Federal Reserve. With still two months remaining in the fiscal year, the deficit is twice the prior record ($1.4trln) from 2009. Over the last decade, annual deficits have been running between $500bn and $1trln per year.
As stimulus wanes, we have a growing concern that the economic recovery stalls. The most widely followed economic data, emanating mainly from the government, tends to lag by one to two months. Using this data in such a volatile environment like today makes it tough to assess changes in recent trends. Alternative data, on the other hand, such as credit card spending and weekly Johnson Redbook Retail Sales, are much closer to real-time and can provide more clarity. Per the Bloomberg graph below, using alternative data, the economy in the U.S. and other major countries appears to have plateaued over the last month.
Tesla followed in Apple’s footsteps and announced a 5 for 1 stock split. The stock rose 13% on the news.
CPI, like PPI on Tuesday, was hotter than expected at +0.6% monthly and +1.0% annually. Excluding food and energy, on an annual basis, CPI was up 1.6%, not far from the Fed’s 2% target. Typically, rising inflation puts pressure on bond yields, but given the Fed’s very active buying program, yields are unlikely to reflect the inflation situation.
Per Arbor Research, the percentage of listed companies classified as “zombies” is now at a 20 year high. The graph shows the strong correlation between the number of zombie companies and inflation-adjusted Treasury yields. Zombie companies are defined as those that pay more in interest than they earn. The relationship is not surprising, as lower rates allow weak and struggling companies to borrow and refinance debt at a lower cost and stay in business. In the case of Zombies, the debt, in many cases, is used to pay off old debt and not for productive investment that might grow earnings in the future.
August 12, 2020
Bonds were under considerable pressure yesterday. It is partially attributable to this week’s Quarterly Refunding in which the Treasury is issuing $112 billion in aggregate of 3yr, 10yr, and 30yr notes and bonds. $48 billion of 3yr notes were auctioned yesterday, with $38 billion 10yr notes today, and $26 billion 30yr bonds tomorrow. Frequently, banks and brokers, that will inevitably buy a measurable portion of the debt, sell bonds in advance of the auctions with the hope of buying them cheaper at auction.
PPI was stronger than expected at +.6% month over month versus -.2% last month. CPI, released at 8:30 today, is expected to 0.3% versus +0.6% last month.
Gold (-5.4%) and silver (-14.7%) got clobbered yesterday. The decline should not come totally unexpected given their recent breathtaking rallies of late. As we have noted over the last few weeks, both precious metals have become grossly overextended, and as such, we were expecting a pullback. In this week’s Major Market Buy Sell Review we stated the following:
Gold is extremely overbought and starting to push 4-standard deviations above the 200-dma.
We suggest taking some profits for now and look for a pullback to increase our sizing.
The graph below shows that prior to yesterday, silver was trading over 40% above the 50-day moving average. A feat last achieved 33 years ago. We are on the lookout for a good point to add back to our gold holdings.
The “Market Generals” and other momentum stocks are not leading the charge upward as they were in prior months. The graph below shows that MTUM, a popular momentum ETF has underperformed the equal-weighted S&P 500 (RSP) by about 10% since mid-July. The top four holdings of MTUM, accounting for almost 25% of the index, are Apple, Amazon, Microsoft, Tesla. The factor/sector rotation can also be seen in the NASDAQ 100, which has underperformed RSP by a similar amount over the last month.
Given the recent weakness in the “Generals” and gold and silver, along with some firming of the dollar, we are waiting to see if this is just a factor/sector rotation towards value-oriented sectors or a signal that risk assets, broadly speaking, are about to come under pressure.
According to Bank of America, the words “optimistic” or “optimism” were mentioned on nearly 50% of corporate earnings calls. That is the largest percentage since late 2016, and prior to that, coming out of the financial crisis in 2009. Despite the seemingly optimistic outlooks, announced stock buybacks are near the lowest levels in a decade.
August 11, 2020
PPI and CPI inflation data will be released today and tomorrow, respectively. On a year over year basis PPI is expected to be flat at 0% while CPI higher at +0.8%. Forward inflation expectations, as measured by the difference between TIPs and nominal 5-year Treasury notes, is currently +1.50% and are back to January’s levels. Friday will be active with Retail Sales, Industrial Production, and Consumer Sentiment on the docket. The early forecast for Retail Sales is a gain of 1.8%, well off the gains of the prior months (18% and 7%), but historically still a strong number.
Retail Sales are unchanged over the last 12 months, despite the global recession. The sole reason is the massive amount of stimulus provided by the Government via the Cares Act. To that point, President Trump, using an executive order, extended unemployment payments last weekend, albeit at $200 less than the prior amount. Trump also suspended the payroll tax. While both actions will help boost consumption, the big question is will the Democrats fight the legality of his actions? It is also worth noting that Goldman Sachs thinks the $400 weekly unemployment subsidy may only last a month or slightly longer. States are on the hook to pay $100 of the amount, which raises other concerns about payment. As an example, according to state Labor Department officials, Connecticut’s unemployment trust fund is headed for insolvency in the next 30 days. The additional $100 burden creates further problems for the state. This is a problem for many states.
Another issue with Federal stimulus is that PPP funds are exhausting quickly. Again, according to Goldman, via a survey of 10,000 small business owners, 84% of PPP loan recipients report that funding has been exhausted.
The Big Ten and PAC 12 athletic conferences are set to announce their plans for the upcoming college football seasons. It appears the options are delaying the start of the season or canceling it entirely. If they cancel, it may weigh on sentiment, especially if the other major conferences follow in their footsteps. If you recall, the suspension of the NBA was one of the events that seemed to tip the markets in early March.
New Additions to RIA Pro:
On the Dashboard tab, underneath the articles and videos, you will find the latest headline news.
On the Research tab, there is a new page that shows options pricing by expiry month.
August 10, 2020
The BLS Employment Report was better than expected at +1.76 million new jobs and unemployment fell to 10.2%. More good news, average hourly earnings rose 0.2% monthly and 4.8% year over year. Both were better than expected.
While the improvement is positive, we must maintain a proper historical perspective. Currently, the unemployment rate is the highest it has been since at least 1950, except for a few months in 1982. Further, as compared to February, there are now an additional 2.8 million people classified as out of the labor force. Because of this they aren’t classified as “unemployed”. The additional 2.8 million people would add 2% to the unemployment rate, pushing it well above the levels of 1982.
The BLS uses a birth/death adjustment to its employment numbers. The adjustment adjust the payrolls data for estimates of net new business formation. Over the last three months, 881k jobs were added due to new net business formation. Even more confounding, according to the BLS, there is a net of +223,000 new leisure and hospitality jobs related to businesses formed since March. The fact of the matter is that many more businesses went bankrupt than were started over the last three months. That statement is even more true for the leisure and hospitality industry.
Gold is up over 20% since early June. The media is taking notice, and many talking heads are asking how far it can go. Answering the question is complicated as gold does not have earnings and cash flows like most other assets. There are however, many different ways to model gold prices which can result in vastly different forecasts. Frequently, investors, given the choice of owning gold along with or instead of stocks, will compare the price of gold to the stock market. The graphs below show that the ratio of gold to the S&P 500 has risen recently, but on a long term time frame, the ratio is still close to 50-year lows. When using this ratio, one must keep in mind the ratio can rise if gold falls, but the S&P 500 falls at a much greater rate. It can also rise if gold increases at a much faster rate than the stock market. Either way, the graph argues that gold has a reasonable chance of outperforming the S&P 500, especially if the Fed continues to print money at unprecedented levels.
The Baker Hughes rig countfell to 176 the lowest since 2008. The graph below shows the decline has continued in recent weeks despite the recovery in economic activity and oil prices.
August 7, 2020
We finally got a dose of good news in the weekly Initial Jobless Claims report. Initial Claims fell from 1.435 million to 1.186 million. On an unadjusted basis, the number of new claimants fell by a similar amount.
The all-important BLS Labor report is slated for release at 8:30 this morning. The consensus estimate is calling for a gain of 2 million jobs and an unemployment rate of 10%. At 3pm today, consumer credit will be released. It has fallen for three consecutive months but is expected to rise.
The Ten-year real rate (10yr yield less implied inflation rate) is now below -1%. The math behind the negative rate is worth discussing. As shown below, inflation expectations (green line) have risen steadily over the last few months but bond yields (red line) have remained stubbornly flat to declining. The net result is plummeting real rates (blue line). Most often, Treasury yields positively correlate with inflation rates. This time is very different as the Fed is buying massive quantities of U.S. Treasuries with the intent of not letting yields rise. The market implies investors will lose 1% annually in purchasing power if they own 10-year Treasuries. That is a tough selling point considering the Treasury will be looking to borrow $3-4 trillion this year and $2-3 trillion next year.
The stunning graph below, courtesy of Bianco Research, shows that New York City subway ridership is running at about 20-25% of what was considered normal before COVID.
August 6, 2020
ADP reported that July payrolls rose by 167k versus expectations for a gain of 1.2 million jobs. A weakening of the uptrend should not come as a surprise given unemployment claims are now increasing and despite some recovery, still at historically high levels. ADP further jibes with other recent indicators pointing to a stagnation of the recovery. Further, if you missed it yesterday, please read our commentary on the Cornell labor survey which also paints a weakening jobs picture.
Initial Jobless Claims, to be released at 8:30 this morning, is expected to increase slightly from 1.43mm to 1.44mm. The graph below shows the strong correlation between Jobless Claims and the Google Trends search for the phrase “unemployment benefits.” Recently, the Google trends search turned higher while Claims are only marginally higher. Will Jobless Claims follow searches higher?
Strong manufacturing surveys of late have led to media to assume a manufacturing recovery is well in hand. While the survey results may be at traditionally high levels, we struggle with the media’s synopsis. The survey questions ask manufacturing executives, in what general direction do they think specific aspects of business are trending. The available answers are “better”, “same” or “worse.” The answer is binary without any quantification for changes in production. For instance, if I used to make 100 widgets a month, reduced it to 20 last month, and then upped production to 30 this month, my survey response would claim conditions are better than the previous month. In reality they are better, but still 70% short of preexisting production levels.
We are nearly 5 months into the economic crisis and slightly less than half of the respondents see either no improvement or a worsening of conditions. One would hope that if the recovery were strong, the index would be well above 80. In this case, the index points to expansion but marginal expansion at best, and in many cases, production levels are well below those before the crisis.
August 5, 2020
The ADP Employment report will be released at 8:15 this morning. The current estimate is for a gain of 1.89 million jobs. Investors will take cues from this report as it tends to have a strong correlation with the employment report.
While ADP and BLS Jobs data on Friday will likely be strong, Cornell, Jobs Quality Index, and riwi, released a coauthored survey which deduces that a second wave of layoffs and furloughs is underway. The survey was conducted during the last week of July and included individuals that were laid off and re-hired. In many respects, the survey measures the effectiveness of the PPP program. Of note, the following question with results: “Since being put back on the payroll by your previous employer have you?: Been laid off again 31%, Been told you could be laid off 26%, Neither 43%.
The following summary points to a weakening trend in employment that will not be picked up in this week’s reports: “Conversely, the new data supports earlier observations that increases in the number of private sector jobs and the decline in unemployment that began to surface in the May BLS Employment Situation Report, and similar employment gains in the June jobs report, were not reflective of workers being “re-employed”en masse — in the conventional sense that they were getting back to the business of actually working — but were rather being “re-payrolled,” in many instances in order to meet the loan forgiveness requirements of the PPP.”They go on- “The US is experiencing a second round of layoffs not otherwise showing up yet in the mainstream data, with 39% of re-payrolled, but not actually working, employees likely being at a high risk of losing paychecks.“
San Francisco Federal Reserve President Daly made an interesting comment yesterday. She said: “have room to let the economy go well beyond what people think is the maximum level of employment.” If you recall, a few Fed members have made similar comments about running inflation beyond their target. It appears both of the messages are the Fed’s way of expressing that they intend to keep the monetary pedal floored, will not raise rates for years, and aim to push employment and inflation well beyond its stated targets.
On a seasonal basis, August, September, and October tend to be weak months for equities. Not surprisingly, the graph below shows that realized volatility also tends to increase during those three months.
August 4, 2020
Nancy Pelosi said a $600 weekly Federal unemployment benefit is not negotiable. With that tough negotiating stance, we continue to wait on Congressional and Presidential agreement for an extension of federal unemployment benefits. In addition to extending legislation, we must also keep in mind that states are struggling to make good on their weekly unemployment benefit payments. It has been reported that many states may run out of funds as early as September. Secondly, most state programs have a six-month time limit. Those citizens that started collecting in March will reach expiration in September.
The most important economic data point week will be the employment report on Friday. Currently, the consensus expectation is for a gain of 2 million jobs, bringing the unemployment rate down to 10.5%. The range of estimates for payrolls spans from +350k to +2.5mm. We know that approximately 5.6 million people lost jobs during July based on weekly unemployment claims. The hard part is the estimate is how many new jobs were added in July. Making the task more difficult will be the fact that various parts of the country are opening up while other parts are stepping back their openings.
With last week’s Fed meeting in the rearview mirror, Fed members are free to speak again. This week there is at least one speaker a day on the docket. Still, we are on the lookout for discussions on yield curve control and Fed views on running inflation hotter than their 2% stated goal.
The image below, from Cornerstone Macro, helps explain why European equities have lagged the S&P 500 to such a large degree. Bottom line: Tech, Healthcare, and Communications account for nearly 50% of the S&P 500 versus only 20% of the MSCI Europe. On the flip side, MSCI Europe has a larger contribution from sectors that have been laggards.
The collage of headlines shown below, courtesy Pinecone Macro Research, speaks to the intense dollar negativity in the media. Similar sentiment pervades social media. Quite frequently, when everyone is on one side of a trade, it serves a strong signal of a reversal.
August 3, 2020
On Friday, the S&P 500 closed .79% higher, led predominately by Apple, Amazon, and Facebook. Apple was up over 10%, increasing its market cap by approximately $180 billion. To put $180 billion in context, Pepsi is the 32nd largest S&P company with a market cap of $190 billion and Abbot Labs is 33rd with a market cap of $178 billion.
Despite the strong efforts of Apple and a few other stocks, over half of the S&P 500 stocks closed lower. Two-thirds of the Dow 30 declined as well. The heat map below shows a lot of red for a strong gain.
The Atlanta Fed published their first estimate of Q3 GDP. They currently forecast, based on July’s data, an 11.9% increase in economic activity.
The Federal enhanced jobless benefits amounting to $2,400 monthly, on top of state jobless claims, expired on Friday. We believe a deal to extend the benefits will occur, but the amount will likely be reduced. The timing of an agreement will increasingly concern the market.
The picture below shows the world’s four major currencies and how they are all sitting on critical longer-term support or resistance. We believe the dollar will bounce off of support, which will translate to the other three currencies reversing their recent trends. If we are wrong, and the dollar breaks down further, the technical damage across the currency complex would accelerate the recent trends in all the currencies shown. While the U.S. may prefer a weaker dollar, as its good for trade and inflationary, the other countries pay the price. Stronger currencies result in deflationary pressures. Considering Europe and Japan have negative rates and are on the cusp of deflation, they can ill afford additional deflationary pressures.
During a typical recession, business inventories get drawn down as business owners are slow to restock inventory that is sold. The graph below quantifies the inventory drawdown of the last two recessions and the current state of inventories. This monthly data point serves as a good indication of business owner sentiment. When confidence improves, inventory growth should exceed sales, and the decline will reverse. In the last two recessions, the trough in inventories did not occur until after the recession.
One of our recent discussion points has been data inconsistencies in housing. Last week, for instance, we learned that pending homes sales were up 16.6% following a 44% increase in the month prior. At the same time, we stumbled upon the chart below showing that over 40% of renters are at risk of eviction. The divergences are confounding.
July 31, 2020
Last night, Amazon blew the doors off of earnings. They earned $10.30 versus an estimate of $1.51. Revenues also easily beat expectations. The company guided sales guidance up for Q3 from current estimates.
Google/Alphabet also beat on earnings and revenues versus estimates but posted a 2% decline in revenues due to a decline in ad revenue. The company committed to buying back $28 billion of its Class C shares.
Apple revenues were much better than estimates at $59.69 billion versus $52.30 billion. Earnings per share were also exceeded expectations at $2.58 versus $2.07. They surprised the market with an announcement of a 4 for 1 stock split. As a result of the split, Apple’s weighting in the Dow Jones Industrial Average (price-weighted index) will fall from 10.5% to 2.8% post-split. There will be no effect on the S&P and NASDAQ as they are market cap weighted.
Initial Unemployment Claims rose for the second month in a row. New claims were 1.434 million up from 1.422 million. Continued claims increased by nearly one million to over 17 million.
GDP fell 32.9%, which was slightly better than expectations. A much weaker than expected GDP Price Index benefited the GDP number by about 3%. The Price Index fell 2.1%, versus expectations for a 1.1% increase. The decline in GDP was incomparable to anything witnessed in our lifetimes, as shown below.
The Census Bureau began conducting a series of surveys to understand better how the COVID crisis is effecting households. The chart below shows how six of their weekly surveys have trended over the last 11 weeks. Catching our attention are the recent upticks in the “loss in employment income” and “expected loss in employment income” surveys. As noted above, unemployment claims are confirming this data.
The value in this data set, along with weekly credit card spending data, and Redbook retail sales, is that it is as close to real-time as we can get. More traditional measures of consumer financial activity are delayed by at least one month, and in some cases, by two to three months.
On July 21st we presented the following: “To provide further context, consider that the 20-day volatility on Ten-year Treasury futures is now below 2%. The last time it was 2% or below was in the 1990s. The record low was recorded in April 1997 at 1.71%.”
We expand upon the lack of volatility in the fixed income markets with the graph below. It shows that over the last 85 trading days the daily trading range between 3-month Bills and 10-year notes was the lowest since 1977. Record low volatility periods tend to reverse abruptly. Whether that may be a big upwards or downward move is the question. Answering the question is difficult because the Federal Reserve, the largest buyer of U.S. Treasuries, is both price insensitive and is not concerned with taking losses.
July 30, 2020
Yesterday’s Fed statement was nearly identical to prior statement from mid-June. They did add one line saying that economic recovery is very dependent on the course of the virus. Will the Fed be more or less aggressive based on new COVID cases this fall? The Fed also extended dollar swap and repo lines for foreign central banks through March of 2021. The use of these lines has been steadily declining over the last month.
The baseline market expectation going into yesterday’s FOMC meeting was for Chairman Powell and the Fed to say that they will do whatever it can to support economic growth. That is exactly what they did. Unlike prior meetings, the market liked the status quo. Powell’s press conference was uneventful as the reporters seemed to ask the same questions as the last few meetings. Powell did not disclose anything new.
It is worth mentioning that the Fed tends to release new programs, policies, and concepts at their annual Jackson Hole Conference. This year’s conference, while online, will occur August 27-28th.
We mentioned the critical role that consumer confidence plays in the economy yesterday. We follow that up today with the graph below showing the strong correlation of jobs to confidence. This strong correlation is one reason we are heavily focused on the weekly Jobless Claims data to gauge how quickly the jobs market is recovering. The consensus estimate for today’s Initial Jobless Claims is 1.388mm down slightly from last week’s 1.416mm. Also on today’s docket is GDP. The current consensus of economists is -35%, but the range of estimates is enormous (-38.5% to -28.5%). The current forecast from the Atlanta Fed’s GDPNow is -32.1%.
Visa, in its earnings report, provided more evidence that the recovery appears to be stalling. They said spending has plateaued over the final weeks of June. Powell made mention of this as well in his press conference.
Market mania has been on full display over the last few months. Wild price gyrations of bankrupt companies like Hertz and Chesapeake Energy were crazy. Trading in Kodak (KODK) over the last few days has been absurd. KODK, on the verge of bankruptcy, saw its shares soar on Tuesday when President Trump granted them a $765 million dollar loan to start producing drug ingredients. The market cap of the company prior to the loan was about $100 million. In the months leading up to the announcement, the stock traded between $1.50 and $3.00 per share. On Tuesday, it tripled from $2.62 to $8.06. Yesterday it opened at $18.50, hit a high of $53.37 and closed at $33.20. In pre-market trading it is back above $40.
July 29, 2020
The Fed extended most of its emergency lending programs for the remainder of the year, many of which were set to expire at the end of September. Per the Fed: “The three-month extension will facilitate planning by potential facility participants and provide certainty that the facilities will continue to be available to help the economy recover from the COVID-19 pandemic.”
The Fed will release its FOMC monetary policy meeting statement at 2 pm, and Chairman Powell will follow it at 2:30 with a press conference.
Consumer Confidence slipped from 98.3 to 92.6, led by a sharp decline in the future expectations index. Last month the future expectations sub-index was 106.1 as compared to 91.5 this month. The present conditions sub-index rose from 86.7 to 94.2. Only 31% of those polled see business getting better within six months. Consumer Confidence, while tough to effectively measure, is an influential gauge of economic activity as personal consumption accounts for nearly 70% of GDP.
One the more timely investment-related questions that we grapple daily is – Is inflation on the uptick, or does deflation remain a strong possibility? To help with the matter, consider the thoughts of Lacy Hunt. Hunt, is not new to the deflationary camp. He has written for years on declining economic growth resulting from the burdens of unproductive debt and the negative effect that has on prices.
To wit: in the following paragraph from his Second Quarter Outlook he states the following: “Four economic considerations suggest that years will pass before the economy returns to its prior cyclical 2019 peak performance. These four influences on future economic growth will mean that an extended period of low inflation or deflation will be concurrent with high unemployment rates and sub-par economic performance.”
To paraphrase, here are his four economic considerations are:
90% of world economies are in a recession; thus no region or country can help offset economic contraction.
A major slump in world trade is occurring. This is certainly COVID related but also a function of recently enacted trade barriers.
The massive debt being employed to fight economic weakness is unproductive and will, therefore, weigh on future economic growth.
“2020 global per capita GDP is in the process of registering one of the largest yearly declines in the last century and a half and the largest decline since 1945. The lasting destruction of wealth and income will take time to repair.”
In regards to the causes of slow economic growth and its deflationary impact, his views are similar to ours. Where we possibly diverge is around the topic of monetary and fiscal policy. In particular, the Fed is now directly monetizing massive fiscal stimulus. We are watching closely to see if the government and Fed’s combined actions are enough to drive inflation higher finally.
July 28, 2020
This week, 188 of the S&P 500 companies are set to report earnings. Thursday will be the most important day with market leaders Amazon, Apple, and Google scheduled to report after the close. The chart below shows the “most anticipated” releases this week.
The Fed will meet today and Wednesday, with the FOMC statement release and Powell’s press conference scheduled for Wednesday at 2:00pm and 2:30pm, respectively. We do not expect any material changes in Fed policy. Still, we will be on the lookout for any discussions on yield curve control, higher inflation targets, and/or new strategies.
On the economic front, Consumer Confidence will come out today at 10am and the University of Michigan Consumer Sentiment Survey on Friday. Also of note will be GDP and Jobless Claims on Thursday and Chicago PMI and Personal Income and Outlays on Friday.
Heading into tomorrow’s FOMC meeting, it is worth checking what the Fed Funds Futures markets are pricing in for the future rate moves. As you move forward on the monthly Fed Funds futures curve, expectations for a rate cut into negative territory slowly increase. By January of 2021, futures imply a 35% chance of a 25 bps cut. The odds continue to increase slowly throughout 2021 to a little over 50%.
One of the more notable recent trends has been the decline the U.S. dollar, which seems to be fostering upward moves in most asset classes. To quantify this negative correlation, we created a risk index comprised of one-third each of 30-year UST, S&P 500, and Gold. As shown below (red dotted line) our asset index was recently the most negatively correlated versus the U.S. dollar as any time over the last five years. Of the three assets, the negative correlation is strongest with 30-year yields/USD at nearly two standard deviations from the norm.
July 27, 2020
Gold is trading $40 higher in overnight trading, which at a new record high is besting its record from nearly ten years ago. The gains, in part, are due to the weaker dollar.
On Thursday, the BEA will release second-quarter GDP. The current estimate is -33%. Last Friday, JP Morgan released the following commentary- “We are lowering our 2Q real GDP growth forecast from -31.0% to -32.5% saar ahead of next Thursday’s [data]. We recently had been noting some downside risk to our forecast and we continue to see growth tracking below our prior estimate ..” Their reduced forecast is not surprising given recent real-time credit card data is signaling that consumer spending appeared to have stalled in June.
In Volatility Is More Than A Number. It’s Everything we stated: “volatility is an inverse gauge of liquidity, the foundation on which smooth-functioning markets and asset prices rest.” Volatility is currently sitting at 2-3x what was normal in 2019. As such, we know that underlying liquidity in the stock market is poor. Do not just take our word on it, just consider some of the rapid surges and declines that continue to occur months after the March fireworks. For further consideration of liquidity, the illustration below from The Market Ear describes how options volumes have exploded during the recent surge in markets. Options trades are a direct bet on volatility and are actively hedged by brokers/dealers. This means that as markets move, hedgers must buy or sell regardless of market conditions to remain hedged. Now consider point 5 below- “given the fall in stock liquidity (TME pointed out earlier this week) options risks risk magnifying underlying moves purely as an effect of dealers hedging.” Bottom Line: Liquidity is poor and therefore markets may experience abrupt moves up or down.
Over the last few days we have discussed quirky housing data and trends related to COVID. As such, below is a short list of recent housing trends that will make housing data difficult to assess, especially compared to historic data.
Consumers are leaving urban rental apartments to buy suburban homes which will skew purchase/rental data
Reduced supply of suburban homes
Work from home allows greater location flexibility and in some cases, people will move to cheaper geographic locations
Baby Boomers may delay downsizing to apartments or senior living facilities
Wealthier consumers appear more driven to buy second “getaway” homes
Home offices, usable patio/outdoor space, and other home amenities will add value to houses
Despite record low mortgage rates, non-conforming mortgages remain hard to qualify for
July 24, 2020
At 1.416 million, Initial Jobless Claims rose by 109k from last week’s number. The good news is that continued states claims fell by over 1 million. However, the total number of persons claiming unemployment benefits (federal and state) only fell by 200,000 to 31.8 million, representing approximately 20% of the workforce.
The market hit a rough patch yesterday afternoon when the Quinnipiac poll showed Floridians favor Biden at 51% over Trump at 38%. Polls can be very misleading this far from the election, but they can steer politicians’ actions, especially those fighting for re-election. In this case, some Republican Senators, locked in tight races, may take a tougher line regarding stimulus and spending to separate from the President. If so, the next version of the CARES Act could be a little more challenging to negotiate and possibly have reduced spending.
Is value finally starting to wake up? Per a Tweet from Bespoke- “Russell 3000 Value outperforming Russell 3000 Growth by 4.31% over the last three sessions. Biggest 3 day outperformance for that measure of Value/Growth since May 31 of 2001 if it holds into the close.”
With yesterday’s $20 gain, gold sits within $40 of record highs, yet gold miners (XAU Index) are still more than 30% away from its 2011 record price. The graph below compares the ratio of XAU to gold. As shown, XAU has outperformed gold over the past few months but has grossly underperformed it over the last 12 years.
German conglomerate Siemens will let many of its employees work from home two to three days a week permanently. Per Reuters, the policy applies to 140,000 employees at around 125 locations in 43 countries. Twitter and some other tech companies have made similar policy decisions. The implications for commercial real estate are massive if these companies are the leading edge of a full time or even partial work-from-home trend.
New and existing home sales have perked up recently, in part because COVID is making the land and space associated with houses more appealing than apartment buildings. We wrote about the recent robust housing data yesterday. Today we follow it up with the graph below showing the other side of the story. New York and Los Angeles are the nation’s two largest cities.
July 23, 2020
With the market rising on hopes for another round of federal stimulus, Tom Demarco, Chief Market Strategist at Fidelity, succinctly laid out possible market risks from a new stimulus bill. Per Tom: “The risk for the market is if the ultimate size of the finished product is less than $1.5T with little to no state aid, a cut in federal unemployment benefits, and a round of stimulus checks to fewer people than before.”
To one of his points, late yesterday afternoon, it was reported that the GOP is considering cutting federal unemployment benefits. Currently, the GOP is pushing for $400 per month, well below the current rate of $2400 per month, set to expire on July 31st.
Following three successive declines, existing home sales increased by 20.7%, the largest monthly gain since at least 1968 when records were first kept. Sales, on an annual basis, are still down 11.3%. June sales were bolstered by pent up demand, reduced supply, as well as demand to move from cities (apartment buildings) to the suburbs (houses).
After significantly lagging Gold’s gains since March, Silver is quickly catching up. Over the last five days, silver is up nearly 20%. It now stands at seven-year highs. Unlike Gold, which is within 3% of the 2011 record highs, Silver ($23.25/ounce) is still about half of its near $50 price from 2011. The graph below shows the ratio of Gold to Silver. After blowing out in March and April, the ratio is now in line with the trend of the last five years.
Initial Jobless Claims, released at 8:30, are expected to be 1.308 million, similar to last week’s 1.300 million.
As we start considering the consequences of a Biden or Trump victory based on current polling, we must recognize that presidential polls can gyrate wildly. The graph below shows how quickly voter preferences changed leading into the last five elections.
July 22, 2020
The U.S. dollar index fell sharply to 95.00 yesterday and stands close to its March 9th intra-day low (94.54). In only two weeks after the March low, the dollar stormed higher to peak at 104. The dollar, having since reversed the entire March surge, now stands at a critical juncture. If it breaks lower, there is little resistance until 88. However, if it bounces, as few expect, it may cause pain for the equity, energy, and precious metals markets. As if markets aren’t tricky enough these days, the possibility of a false breakout lower may catch investors/markets offsides.
The Chicago Fed National Activity Index for June gained further ground, however, June’s rate of growth was not nearly as robust as May’s, raising questions about the sustainability of economic resurgence. The Chicago Fed index is a weighted average of 85 economic indicators. In June 54 indicators made positive contributions and 31 were down.
Weekly Johnson Redbook retail sales continue to languish, also raising questions about the strength of the recovery. Keep in mind the index does not include on-line retailers who are gaining market share.
On Monday, the S&P 500 posted one of its most quirky days. Per Stock Charts, the percentage of stocks up was -28.8%, stunning considering the index posted an .84% gain. The measure subtracts the number of declining stocks from those advancing and divides it by the total number of stocks.
The scatter plots below compares daily instances of the advance/decline percentage and percentage gain/loss in the S&P 500 (2010-current). The graph on the left contains all of the data, while the one on the right zooms into to days where the S&P 500 was up or down by 1% or less. The orange dots highlight Monday’s anomaly. We went back to 2010 to see just how odd the occurrence was. Since January 1, 2010, there have been 410 days in which the market rose .84% or more. In all of the other instances, the percentage of advances over decliners was positive and at least by +20%. The average was 74%. We increased the number of potential anomalies by reducing the S&P gain threshold to +.50% or more, and there were only two other instances out of 700 eligible days. Based solely on this analysis, the S&P 500 should have been down .25% on Monday.
The graph below shows that real yields, or the yield after inflation, has fallen to -0.79%. It essentially quantifies how much stimulus the Fed provides the markets and the economy.
July 21, 2020
Monday was another oddly divergent day in the markets. The S&P (+.85%) and NASDAQ (2.88%) surged on the backs of the largest companies in those indices- Amazon (+7.93%) and Microsoft (+4.28%). Of the 11 S&P sectors, Consumer Discretionary, Technology, and Communication were up sharply, Health Care had a marginal gain, and the remaining seven sectors fell. 52% of S&P 500 stocks and 66% of the DJIA were lower on the day. The Dow Jones Industrial Average eked out a 0.03% gain and the Russell was lower.
This will be a slow week in terms of economic data, with Initial Jobless Claims on Thursday and the PMI Manufacturing Survey being the only two numbers of consequence.
Voting Fed members should be silent this week and early next week due to the Fed’s self-imposed media blackout heading into its July 28/29 meeting. Following Fed President Evan’s speech in which he laid the groundwork for running inflation higher than the Fed’s 2% goal, we will keep a close eye out for similar comments from non-voting Fed members. It’s quite possible, the Fed and/or Powell will comment on its inflation targets at next week’s meeting.
Yesterday we noted the historically tight range that Treasury yields are trading in. To provide further context, consider that the 20-day volatility on Ten-year Treasury futures is now below 2%. The last time it was 2% or below was in the 1990s. The record low was recorded in April 1997 at 1.71%.
As shown below used car prices are surging. Similar to supply trends in housing markets, there is a shortage of used cars for sale. Combine limited supply with a new sense of frugality opting for cheaper used cars by consumers. Further stoking the price gains is the various forms of federal stimulus. Per Scott Allen of Auto Land in Fort Worth, Texas- “I’ve seen a lot of down payments this month of exactly $1,200.” Quote courtesy Autoblog.
This week and next week we will see a majority of companies issue their financial reports. The table below shows expected reports by date.
July 20, 2020
The University of Michigan Consumer Sentiment Survey took a step backward, with both current and forward expectations declining. Expectations are now below levels from March and April. The graph below shows the strong correlation between changes in this survey and the S&P 500.
Chicago Fed President Evans made some comments last Thursday about inflation that largely went under the market’s radar. He stated as follows:
Timing for the Fed taking its foot off of the pedal is simple… Need to get inflation to 2% or 2.5%
It would be good to see inflation above 2% for some period
Evans is pushing for the Fed to continue aggressive monetary policy until inflation runs hotter than the Fed’s 2% target. The direct mention of 2.5% inflation maybe the Fed’s way of testing the waters for an eventual increase in the Fed’s target. There was little reaction from the three markets that would typically react to such news: Treasury yields, implied inflation expectations, and precious metals.
Treasury yields continue to chop around with little volatility. The 10-year U.S. Treasury Note, for instance, except two weeks in June, has traded back and forth in a tight ten basis point range (0.70% to 0.60%). It currently stands at 0.62%. A break below the consolidation level would likely accompany downward pressure in risk markets.
As we look ahead to the Presidential election, we are paying attention to the implied volatility futures markets (VIX) to quantify market concerns. As a general rule, the higher the VIX, the more worried it is, and vice versa. For instance, VIX is currently around 27. While much lower than it was in March, it is still over two times what it was prior to the COVID crisis. For purposes of gauging the pricing of volatility around the coming election, it’s not the level of VIX in October/November, but how it compares to the month’s surrounding it.
We follow @vixcentral and use their web siteto track the structure of the VIX curve. The first graph below is Friday’s VIX curve, and below that you will find the curve from July 18, 2016, the same period before the last election. Note in the 2016 graph, as circled, there was no discernible kink in the curve as there is today. We also looked at the same period prior to the 2012 and 2008 elections and did not find anything notable priced into October/November time frames.
Traders are more worried about this coming election than we have seen in the recent past. As you consider the potential implications of the election, both positive and negative, please consider that volatility is the opposite of liquidity. We will write more on this concept in a forthcoming article.
The tweet below from @macrocharts shows how sentiment for the NASDAQ has risen to nearly unprecedented levels over the last few weeks.
July 17, 2020
Initial Jobless Claims continue to stagnate (1.30mm vs 1.310mm last week). Non-seasonally adjusted (NSA) jobless claims rose by over 100k from the prior week. As a result, the NSA Insured Unemployment rate rose from 11.3% to 11.9%. The total number of persons claiming unemployment benefits (federal and state) fell from 32.4mm to 32 million.
The Retail Sales report was more optimistic. Retail Sales grew by 7.5% versus expectations of a 5% rise. After last month’s 18.2% increase, June was the second-largest gain since the data has been tracked. The juxtaposition between the employment data and Retail Sales is the result of the massive stimulus employed by the government. To reiterate an important point, the extension of existing stimulus programs will be vital for economic recovery to continue.
On July 31st, the Pandemic Unemployment Compensation (PUC) will expire. PUC provides an additional $600 to weekly unemployment insurance benefits. The Minneapolis Fed just published a telling article on who is benefiting from PUC and the effects if it is not extended. While we expect Congress to extend the subsidy, the economic fallout will be harsh if they do not. Keep an eye on Congress to see if it is extended and if any other stimulus might accompany the extension.
The National Association of Home Builders (NAHB) Index of market conditions rose sharply and sits close to pre-COVID levels. While a good sign, we remind you of a graph we presented last week, which showed the supply of homes for sales is down by about 30%. Also benefiting new home sales, many of which are in suburban and rural areas, is what appears to be the beginnings of a de-urbanization trend.
One of the more unique factors driving this bull market is massive speculation in the options markets, and in particular, the use of out of the money calls to make low-priced, high potential reward bets on stocks. A recent Bloomberg article noted that: “With the company’s (Amazon) shares up 66% this year, traders are bidding up the price of options that have it jumping another 50% in the next three months. Contracts betting on the online retailer to reach $4,600 by October were among the most-traded calls for that expiry month on Monday.” Record purchases of out of the money calls is yet another sign of the speculative fever gripping the risk markets. The article’s theme was summed up well by derivative specialist Chris Murphy who is quoted in the article as saying: “It’s all FOMO related.”
Bloomberg had an interesting article yesterday detailing how Japanese investors sold a record $34 billion of foreign equities last week. The amount is six times greater than any previous week. The anomaly may be quarter-end related or specific to SoftBank’s sale of T-Mobile. If, however, it proves to be more than a one time event, this story bears following. The graph below, courtesy Bloomberg, shows how irregular the selling was.
Rail traffic provides useful insight into economic activity. The table below shows the slump in rail traffic, by product, for the week ending July 11th and year to date. The graph below it shows the relatively strong correlation of rail traffic to GDP. The data in the graph is quarterly, so it only goes through the first quarter. For current reference, the latest monthly reading (through April) of rail traffic is down 17% versus last year.
July 16, 2020
After a slightly higher than expected CPI report on Tuesday, Import and Export prices also came in more than expected. Import prices rose 1.4% monthly versus +1.0% in the prior month and expectations of +1.1%. That marked the biggest gain in 8 years. Export prices were also up 1.4% on a monthly basis.
The table below provides estimates for today’s Retail Sales report. Initial Jobless Claims are expected to be near 1.3 million. Again, continued claims will be watched closely.
As we have noted over the last week, real-time spending data is starting to show signs of stalling. In that realm, Calculated Risk provides more evidence that consumers are struggling. To wit: The National Multifamily Housing Council (NMHC)’s Rent Payment Tracker found 87.6 percent of apartment households made a full or partial rent payment by July 13 in its survey of 11.4 million units of professionally managed apartment units across the country. More importantly, they note that figure marked a 2.5% decline in the share of households that paid rent versus the reading from June 13th. If the employment situation were truly improving, the percentage should be increasing. Further, the Census Bureau, in a late June survey, found that only 63% of Americans have “high confidence” in their ability to pay next month’s mortgage. 16% had “slight or no confidence” in their ability to pay. If additional unemployment benefits are not extended at the end of the month, the situation will worsen.
Per Bank of America, and as shown below, 77% of stocks in the S&P 500 have a higher dividend yield than the Ten-year U.S. Treasury note. With an annual yield of only 0.62%, Ten-year notes do not exactly provide a high hurdle for stocks.
July 15, 2020
JP Morgan earnings and revenues surprised to the upside, largely due to Fixed Income trading revenue- thank you Fed. The blemish on its report is a $10.47 billion provision for credit losses, as compared to what was expected ($9.15 billion). Their loss reserve is based in part on an estimate of a 10.9% unemployment at year end and 7.7% by the end of 2021. That compares to the Federal Reserve’s estimates of 9.3% and 6.5%, respectively. JPM is now holding $17.8 billion of loan loss reserves for its $140 billion book of credit cards, which assumes approximately 13% losses on their credit card book. JPM’s net interest income (margin) continues to decline as yields hover at record lows. The quarterly margin is now 1.99%, down from 2.37%. The lower the margin, the less likely a bank is to make new loans. Given that debt drives economic growth, reduced lending profitability is problematic for future economic growth.
Wells Fargo’s (WFC) report was not as good as JPM’s. They reported their first quarterly loss since 2008 and sharply reduced their dividend to $.10 from $.51. Like JPM, they also saw a sizeable decline in the net interest margin from 2.58% to 2.25%. WFC is now down over 50% year to date and trading below its peak prior to the Financial Crisis in 2008.
Maybe the most concerning information from the announcements are their forward economic outlooks: From WFC- “Our view of the length and severity of the economic downturn has deteriorated considerably from the assumptions used last quarter.” JPM’s CFO echoed the sentiment saying they now expect a “much more protracted” recovery. Simply, the banking sector does not have the rosy “V”-shaped recovery outlook the stock market has priced in. As you think about their outlooks, consider that banks have the latest economic data via credit/debit card spending, loan repayments, new loan applications, and a host other real-time economic indicators.
Monthly and annual CPI both increased by 0.6% for June. The gains were driven by food and energy prices. Excluding food and energy, monthly CPI rose by 0.2%.
Nancy Pelosi provided hope that further stimulus is a possibility by saying she would delay recess for stimulus talks. She provided the market a shot in the arm, which was trading poorly before her statement.
Last week we discussed the irregular divergence between the Citi Surprise Economic Index and Ten-year U.S. Treasury Yields. Today we present another chart, showing how copper prices are diverging from Ten-year yields. Is inflation starting to take hold? Treasury bond yields and implied inflation expectations are not signaling concern. The hardest part of trying to assess inflation is the Fed’s influence on yields and the dislocations they cause. Over the coming weeks we will look to earnings reports for warnings of rising input prices.
July 14, 2020
CPI will be released at 8:30. As we previously noted, this will be a tough data point to handicap due to supply line bottlenecks and irregular demand patterns. The estimate is for a gain of 0.5%, month over month, and +1.2% on an annual basis. Retail Sales will be released on Thursday. Economists expect another big month, with a +5.3% monthly gain (+17.7% May). The report is for June, so retail sales benefited greatly from Federal and state stimulus, but not to the same degree as May. Barring any new or extended programs and stimulus funds stimulus dollars will wane significantly over the next few months to the detriment of Retail Sales. Jobless Claims, also released on Thursday, is expected to see 1.323 million newly unemployed, a slight increase from last week.
This week, Banks, Airlines, and Pharmaceuticals kick off second-quarter earnings reports. Over the following two weeks, 61% of S&P 500 companies will report. Many companies did not offer forward guidance last quarter. We will be interested to see if they continue to stay tight lipped or are more comfortable providing investors with insight into their sales and operations.
Tesla shares opened up sharply on Monday, at one point rising nearly 15% from Friday’s close. The gains quickly vanished and the stock closed down nearly 5% on the day. As goes Tesla, as goes the NASDAQ. The NASDAQ 100 (QQQ) traded in a 4% range from the daily high to its closing price. The S&P was up over 1% at noontime and finished lower by nearly 1%. The Dow eked out a slight gain.
Los Angeles and San Diego schools will not open in the fall. Further, California Governor Newsom ordered all bars to be closed and no indoor seating for restaurants. California has the worlds fifth largest GDP, right behind Germany.
Home prices and sales of newly built homes have held up well despite the COVID crisis. One reason, as shown below, is that the supply of homes for sale is down nearly 30% from last years level. The Real estate industry is also witnessing an exodus from urban living to the suburbs. The trend is resulting in healthy, above market bidding for houses in desired areas. The negative effect on urban prices has yet to be documented.
July 13, 2020
The graph below shows the deteriorating breadth of the NASDAQ despite the index’s surge higher. This dynamic is yet another indicator that a handful of stocks are driving the major indexes higher, while many of the index constituents are underperforming.
The year over year change in Producer Prices (PPI) fell for a third straight month. The CPI report will follow tomorrow. While PPI shows a deflationary impulse, the CRB commodities index and implied inflation expectations have been on the rise. Bond yields have been flat to declining, showing no concern about inflation. The tug of war between inflation and deflation will continue to rage as supply lines, both domestic and international, remain fractured. The demand side, in aggregate, is also far from normal. Some sectors have recovered nicely and others remain depressed. The odd supply/demand combinations are leading to inflation in some goods and deflation in others. Needless to say, arriving at one aggregate inflation number is difficult and misleading.
The Fed’s balance sheet shrank by $88 billion last week, marking a fourth consecutive weekly decline. While the Fed added assets last week, its repo lending shrank to zero and dollar swaps with other central banks declined further. The lessened need for repo and dollar swaps is a positive sign that domestic and international dollar liquidity is plentiful. That said, we may see a temporary increase in repo facilities this week as individual and corporate taxes are due on July 15th. These are the payments that were delayed from April. There are $179 billion in dollar swaps that will roll off the Fed’s books in the coming weeks and months. Once these mature, the Fed’s balance sheet will head upwards as they continue to increase their holdings of Treasury, mortgage, and corporate securities.
For all those subscribers invested in the Cannabis space, Politico is reporting that Bernie Sanders is not having luck pushing Biden to add marijuana legalization to his platform. Per Politico “Another flashpoint over marijuana ended similarly: Sanders’ team argued in private meetings that they should legalize cannabis, but that idea was rejected. One task force member described the disagreements over qualified immunity and pot as “huge battles,” and multiple people involved said the criminal justice panel presented some of the biggest challenges for compromise.“
July 10, 2020
Initial Jobless Claims continue to decline slowly and remain at levels well above anything witnessed since the advent of unemployment insurance. The highest weekly total prior to this year was 692k. Last week 1.314 million people filed for insurance. Continued claims continue to drop but remain stubbornly high at 18 million. Most concerning within this report is that persons claiming benefits in all programs, Federal and state, rose from 31.5 million to 32.92 million. The data however, is two weeks old. This LINK contains the full set of data if you are interested.
The CBO released the latest Monthly Budget Deficit, which reports that the federal deficit for June was $863 billion. The current deficit for the fiscal year (October 1, 2019 – September 30, 2020) is already $2.7 trillion. In regards to June’s deficit, there have only been five annual deficits that have been greater. Four were in the years surrounding the financial crisis and the other was last year. The total annual deficit is already nearly two times the largest annual deficit from 2009 with three months remaining.
Yesterday we discussed the sharp decline in consumer credit. The graph below, courtesy Brett Freeze puts historical context to the drop.
Yesterday, the NASDAQ was up by .92% while the Dow fell by 1.39%. It seems that such divergences have been occurring with increasing frequency. As shown below, we analyzed historical data to see just how uncommon this is. To qualify as a daily divergence in the graph, one of the indexes needs to be up or down by more than half a percent. At the same time, the other index had to move in the opposite direction. For example, if the Dow was down .75% and the NASDAQ was higher on the day, that daily instance would qualify. The graph shows the number of such instances in rolling 50 day periods. Over the last 50 days, it has happened 11 times or more than 20% of the time. The last time there were 11 instances in a 50 day period was during the Financial Crisis. Before that in 2002.
July 9, 2020
Initial Jobless Claims, for release at 8:30, are expected to fall from 1.427 million to 1.375 million. Like the previous few weeks, we will pay close attention to continued claims.
Total consumer credit declined by over $18 billion, marking the third monthly decline in a row. Revolving credit, mainly credit cards, fell by $24 billion and has declined by over $100 billion in the last three months. Total revolving credit is now under $1 trillion, a level last seen in 2007. The decline in consumer credit is due to reduced spending, as well as individuals using stimulus money to pay down their cards.
Every Tuesday, Redbook Research Inc. publishes its proprietary Johnson Redbook Index. The index tracks retail sales on a weekly basis. We usually do not pay much attention to the index, but given the situation, it provides us with near real-time data on the health of consumers, which is about 2/3rds of GDP. More popular Retail Sales from the Census Bureau is monthly and lags by a few weeks. As shown below, the level of activity in the Redbook survey is still well below the same week last year. More concerning, it is aligning with other high-frequency data and signaling a stagnation in the recovery.
The Citigroup Economic Surprise Index measures how well economic analysts are forecasting economic data. When the index is high, it means the analysts are underestimating economic data and vice versa for low readings. As shown, the degree in which they have underestimated data is literally off the charts. This index tends to oscillate as analysts reformulate their forecasts. Given the volatility of economic data and highly unusual circumstances, the record level is not surprising. Also, notice that bond yields are well correlated to the index. This time however, bond yields are not reacting. The odd divergence is the result of the unprecedented economic environment, many unknowns regarding the virus, and importantly the Fed/QE. If historical correlations held up, Ten-year Treasury yields would increase by about 2%
Piper Sandler conducted the poll below to gauge the spending habits of those currently receiving unemployment benefits. The obvious take away is that about half of those receiving unemployment would cut their spending if the additional $600 Federal unemployment benefit were eliminated. Currently, that is scheduled to happen at the end of July. What we find stunning in the survey, however, is that only 2% of the people surveyed expect to be back on the job at the end of the month.
July 8, 2020
Atlanta Fed President Raphael Bostic voiced concern that the recent uptick in COVID cases is potentially slowing the recovery. In particular, he said the Fed is closely examining high-frequency data and seeing signs that businesses are “getting nervous again.” Further, “there are a couple of things that we are seeing and some of them are troubling and might suggest that the trajectory of this recovery is going to be a bit bumpier than it might otherwise.” His concerns are in line with recent credit card data (high-frequency), showing that spending growth has flattened.
The table below provides a big clue as to what is driving the S&P this year. First, the S&P 500 is market cap-weighted meaning as a company’s market cap increases relative to the market its weighting in the index increases and by default other company’s decline. The table is sorted by market cap deciles with the largest at the top. As you read down, from top to bottom, notice that the year to date returns (far right column) are largely ordered from highest to lowest. Also, note that the four fundamental ratios are also ordered mainly from most expensive to cheapest.
The table has the earmarks of passive investors driving the market. As investors buy the index, they indirectly are buying more of the largest companies and less of the smaller companies. For example, for every $100 invested in the S&P 500, an investor buys $6 of MSFT but only .01 cents of Xerox. As the index rises, the larger companies become a higher percentage of the index and the smaller ones diminish in their contribution. The process repeats over and over again. The trade today is to chase the largest companies. Conversely, the appropriate strategy for a market sell off is to rotate to the smallest companies. The interesting aspect of the table is that large-cap value stocks (those at the bottom of the list) are trading at respectable valuations in aggregate but are being shunned, simply because they have a relatively smaller market cap.
Over the coming few weeks, second-quarter corporate earnings will be released. As such, we thought we would share a graph from J.P. Morgan comparing how the first quarter stacked up in terms of margins, share counts, revenues and earnings per share versus the past twenty years. Keep in mind, while the earnings data was awful for Q1 and will be for Q2, many companies will experience earnings growth in the third and fourth quarters, which will improve the annual numbers for 2020. Currently, analysts expect 2020 EPS to fall 23% versus 2019. As is typical, that estimate will likely be revised lower over the coming quarters.
July 7, 2020
Jobless Claims on Thursday and PPI on Friday will be the two big economic data releases this week. There are a few Fed speakers on the docket, but we do not expect to hear anything new from them. Congress started a two week vacation, so news on potential stimulus renewals/extensions or new stimulus will likely be muted this week and next. Second-quarter earnings announcements will commence this week but mainly for smaller, lesser known companies. They begin in earnest next week when the banks and airlines release their financials.
This week the U.S. Treasury will offer $29 billion Ten-year notes on Wednesday and $19 billion 30-year Bonds on Thursday. Frequently, in advance of these offerings, bond yields rise and then reverse course after the auction. Given the Fed’s involvement via QE, prior trends may not hold.
The ISM Services survey broke into expansionary mode, showing that service managers are optimistic that the economy is getting better. The only concern in the report, and as we saw in the manufacturing surveys last week, is that the employment sub-index is still in contraction mode, which signals further job cuts.
While most Universities are working on a mix of online and live classes, Harvard bucked the trend and announced yesterday that all classes would be held on line. Further, they will limit dormitory housing to 40% of students.
The SBA put out a list of all the businesses that received at least $150,000 under the PPP program. The chart below provides some context as to how much was borrowed by industry and average loan size.
The graph below, courtesy of J.P. Morgan, tracks Chase consumer credit card spending. Consumer spending bottomed in early April and has been rising since. Over the last two weeks, however, the gains appear to stabilize. As we have mentioned, consumer stimulus, the largest driver of consumer spending, is waning. Credit card data, as shown below, should provide us an early indication that further gains in consumption are in jeopardy. This assumes, of course, that additional stimulus is not approved by Congress.
July 6, 2020
For the second month in a row the BLS employment data was much better than expected. The economy added 4.8 million jobs after adding 2.7 million last month. The unemployment rate fell to 11.1%.
Initial Jobless Claims, on the other hand, continue to paint a different picture. New claims remain stubborn at 1.427 million, a slight decline from 1.482 million last week. More troubling, continuing claims, or those that filed claims and have yet to be rehired, rose slightly to 19,290 million. The running rate before COVID was approximately 1.7 million, resulting in approximately 17.2 million unemployed.
On Friday, the U.S. Treasury bailed out trucking firm YRC Worldwide Inc with $700 million of funding. The government package required YRC to give up almost 30% of ownership to the government.
Per a CNBC article, Joe Biden told his donors that he would erase most of Trump’s tax cuts. The corporate tax cut signed in late 2017 reduced the corporate tax rate from 35% to 21%. Wall Street is in agreement that the legislation boosted S&P 500 earnings by at least 20%. If Biden is elected, and his plan passes through the Senate and House, which are two big ifs, S&P 500 EPS would likely decline by at least $25-$30 dollars.
Tesla, rallied 8% on Thursday based on better than expected deliveries. As shown below, its deliveries are in line with the prior four quarters and showing no growth over the last year. Regardless of fundamentals, Tesla now has the largest market cap ($222 billion) of all auto manufacturers. It is now almost $50 billion larger than Toyota, the previous largest manufacturer by market cap. To say Tesla is priced for perfection is an understatement.
July 2, 2020
As we noted yesterday, Consumer confidence bounced in the latest report by the Conference Board. However, that bounce in confidence came from those in higher income classes who participated in the market surge from the Fed’s liquidity. For the vast majority of citizens, confidence slipped.
We apologize, ADP was released yesterday, not today as we thought. The ADP jobs number showed an increase of 2.369 million jobs which was 1.1 million below expectations. However, ADP revised last month’s number from -2.76 million to +3.015 million. Considering ADP does not estimate and uses real payroll data, it is a bit confounding how they can have such a large revision.
ISM positively diverged from the Chicago PMI number on Tuesday. National manufacturing is now expanding, versus contracting in the Chicago data. Again, the critical point to consider is that while more companies are expanding versus contracting, these surveys do not quantify the degree of expansion. As we saw in Chicago, the employment sub-index in the national data also remains in contraction. The positive takeaway from the report is that it appears manufacturers are recovering.
The table below shows expectations and the prior month readings for today’s BLS employment report. Note the massive range in estimates. Initial Jobless Claims, also at 8:30, is expected to be 1.4 million for the week, versus 1.48 million last week.
The Fed minutes from the June FOMC meeting were released. As we suspected, yield curve control (YCC- also know as Yield Curve Targeting YCT) is actively being discussed at the Fed. In fact, the first topic of the meeting was a “Discussion of Forward Guidance, Asset Purchases, and Yield Curve Caps or Targets (YCC/YCT).” The discussion ended with the following statement: “All participants agreed that it would be useful for the staff to conduct further analysis of the design and implementation of YCT policies as well as of their likely economic and financial effects.” As we discussed in The Next Iteration, What is Yield Curve Control, YCC will be used by the Fed, we believe it is just a question of when.
The Fed continues to maintain a realistic view of the economy, to wit: “Officials saw extraordinary uncertainty and considerable risks for the economy.” The statement further confirms the Fed has no intention of letting its foot off the monetary gas pedal and will use its full range of tools to support the economy.
July 1, 2020
With quarter-end in the rearview mirror, some of the window dressing trades from the prior week will likely be reversed over the next few days. In other words, investment managers that put on new positions before quarter-end to make their quarter-end investment statements look favorable to clients, may sell and buy back what they previously owned. Given the volatile quarter we just had, it is likely some added risk in recent days to show they were aggressively chasing the rebound, while others reduced risk to show concern. This dynamic makes it tough to handicap.
Jerome Powell and Steven Mnuchin testified to Congress yesterday. Of interest, Mnuchin said: “Treasury and the Fed have not yet figured out a way to help commercial real estate.”
United States Consumer Confidence was encouraging. It jumped to 98.1 versus a consensus forecast of 91.8. It is still way off of January’s level of 131.6.
Despite increasing, Chicago PMI was disappointing, only rising to 36.6 versus 32.3 last month. While better than last month, it was well off of expectations of 45. Employment and new orders, which are good leading economic indicators, both contracted. The survey had a special question as follows: “What are your personnel plans for the rest of the year?” 55.8 of those surveyed said they were going to freeze new hires, 23.3% expect layoffs, and 18.6% plan to increase their workforce. The graph below shows the recovery in the PMI survey has been much weaker than consumer related industry data points. This should not be surprising as much of the stimulus thus far is geared towards employment and consumption, not manufacturing. The broader ISM manufacturing survey, released at 10am, will help affirm the PMI report.
On Monday, we wrote the following: “A second important factor driving consumer confidence and consumption are the benefits associated with Federal and state stimulus programs.” The graph below from the Hutchins Center quantifies and substantiates our concern. Per their forecasts, Federal and state stimulus will positively impact 2nd quarter GDP by 9.25%. That amount is projected to fall considerably to 4.55% in the 3rd quarter and .86% in the fourth quarter. By the 2nd quarter in 2021, they expect an economic drag with a negative fiscal impact of -5.35%.
We also recently explained the ongoing debate among investors on whether the stock (amount of total QE) matters more or less than the flow (recent percentage change in QE). The following graph, courtesy of Strategas, shows that as the percentage change in QE stabilized in recent weeks, the market has followed its cue and consolidated.
June 30, 2020
This week is short due to the Friday, July 4th holiday, however, it will be a busy one. Important manufacturing survey data will be released, including Chicago PMI today, and the PMI and ISM manufacturing surveys tomorrow. Keep in mind the surveys are misleading as the survey asks whether conditions are better this month as compared to last month. In almost all cases the answer is probably yes. The bigger question, which these surveys do not ascertain, is how much better.
Also, on Wednesday, ADP will release its employment report. Because of the holiday, the BLS will release the June employment report on Thursday, along with Initial Jobless Claims. Jerome Powell will speak at 12:30 this afternoon.
Late yesterday afternoon U.S. Commerce Secretary Wilbur Ross revoked Hong Kong’s special status. State Department Secretary Mike Pompeo tweeted: “If Beijing now treats Hong Kong as “One Country, One System,” so must we.” The U.S. actions were likely in response to China passing a national security law for Hong Kong. Details are light, but it is believed the law further restrains Hong Kong’s autonomy.
Many large companies are suspending advertising campaigns on Facebook and other social media sites. These actions are likely temporary, but for investors of social media companies, they will reduce revenue and profits. In 2017 we wrote about how social media are really just advertising companies. To wit:
“With that example of how the automobile industry grew revenue from all of the aforementioned highlighted sources, we consider social media. 88%, 95%, and 90% of revenue from three of the largest social media/internet firms, Google, Facebook, and Twitter respectively comes from advertising (data sourced from their most current annual reports). Needless to say, when we think about social media’s “product”, it is not cutting edge technology as some claim, but instead they are simply a new breed of mad men, in a mature advertising industry.”
The Small Business Administration will stop approving PPP loans on Wednesday. More than $134 billion has not been used. As the Daily Shot points out below, this is a common theme.
June 29, 2020
Concerns over the increasing number of COVID cases in Texas and Florida prompted their respective governors to walk back their reopening processes. Per CNN, California’s Governor is advising the county’s health department to reinstate its stay-home orders after it had a rise in COVID cases. The recent outbreak may also explain why the University of Michigan Consumer Sentiment Survey fell from 78.9 to 78.1. Given that personal consumption is about two-thirds of GDP, we will closely follow how consumers react to the surge in new cases.
A second important factor driving consumer confidence and consumption are the benefits associated with Federal and state stimulus programs. The first chart below, courtesy of Zero Hedge, shows that personal income has risen sharply over the last few months. Unfortunately, all of the increase is due to the $1200 stimulus checks and enhanced unemployment insurance benefits (transfer receipts). In fact, without the stimulus, personal income would be down sharply. The second graph shows the unprecedented extent to which unemployment benefits are supplementing lost wages. Given the large degree to which stimulus has supported personal consumption, we must be prepared for a situation in which any new rounds of stimulus are not large enough. More troubling would be the possibility of further stimulus getting caught up in election politics.
The June rally in the equity markets should really be called the Apple rally. Here is a tidbit from Philip Davis at www.philstockworld.com explaining:
AAPL is up 14% in June and the Nasdaq has gained 600 points or 6.3% so, essentially all of June’s gains so far have come from Apple’s $45 run and, in the Dow, each component $1 is worth about 8.5 Dow points (yes, it’s an idiotic index) so AAPL contributed 382 points to the Dow’s 400-point gain for the month. That would be 95.5% of the gains…
The Wall Street Journal had an interesting article about the way Starbucks plans to adopt to COVID and post-COVID consumer trends. To wit: “For their part, Starbucks is planning to build more locations in urban areas designed specifically for takeout and advance ordering. While these locations will have lower sales potential than a traditional cafe, the savings on labor and occupancy costs will be significant.”
June 26, 2020
Initial Jobless Claims continue to remain at high levels. The non-seasonal adjusted number of claims fell by a meager 6,000 people. Total continuing claims including Federal programs rose from 29.2 million to 30.5 million. More importantly, despite the reopening of the economy. unemployment claims have flattened out at levels higher than any previous point in history.
The combination of Fed intervention and record debt issuance pushed trading volumes in investment grade corporate bonds to a record high as shown below.
With the large increase in equity prices, many funds are likely over-allocated to equities and under-allocated to bonds. As such, large pension funds and other balanced funds will need to rebalance their portfolios at quarter-end. CNBC published There’s a wave of selling estimated to be in the billions that’s about to hit the stock market which discusses how this quarter’s imbalance could lead to a large trade out of equities and into bonds. Given the size of the potential trades and the desire to front-run the market, these trades are already being done and will continue throughout the month.
Calculated Risk put out an interesting article discussing how commercial real estate construction is struggling to recover. Specifically, the article mentions the AIA Architecture Billings Index which has stopped declining and is not recovering like other sectors. It currently sits below the trough of 2008. Given the overbuilding of commercial real estate over the past ten years in many areas and now the work from home movement, this sector will likely struggle.
While economic data bounced over the last month, this has simply been a function of going from extremely depressed levels to less depressed levels. This was seen yesterday in the Durable Goods report which showed a large bounce in the headline number but new orders remain substantially below 2019 levels.
Lastly, one of the big risks to the market has been the potential for a “second wave” of the virus, which curtails the economic recovery. The surge in new cases is coming at a time when the “first wave” had not fully subsided as of yet pushing both Texas and Florida to “pause” their reopening plans. As JPM noted yesterday, there is already evidence that rising cases are stating to hit consumer spending again with restaurant bookings declining.
With the inability to get activity back to normal levels, the risk of more business closures and job losses puts the hope of a “V-shaped” recovery at risk.
Lastly, we have avoided banks in our portfolios as zero interest rates, monetary interventions, and a weak consumer don’t lend to stronger profitability or stability of major banks. Yesterday, another hit came to the financial sector as the latest Fed “stress test” found potential threats to the financial system which resulted in both a capping of bank dividends and restricted stock buybacks for the sector. Given that stock buybacks have been a major source of producing Wall Street “EPS beats,” expect banks to continue to underperform the broader markets in the months ahead.
June 25, 2020
Initial Jobless Claims will be released at 8:30. The current estimate is for 1.38 million people to file initial claims. The chart below shows how the claims stimulus is monetarily incentivizing people to stay at home versus seeking employment. This odd dynamic makes it hard to truly assess the labor market until unemployment insurance reverts back to its old pay rate.
The winds of trade war are starting to blow again. Earlier in the week Peter Navarro hinted at trouble with the China Trade deal. Now there is talk that Trump is considering $3.1 billion of new tariffs on exports from France, Germany, Spain, and the U.K.
Fitch downgraded Canada’s credit rating from AAA to AA+. The combination of weaker growth and more debt drove the action.
One of the factors making the current recession worse than prior recessions is that it is occurring simultaneously around the world. As shown below, the World Bank expects more than 90% of economies to be in a recession this year. The percentage dwarfs all prior recessions and is even greater than the Great Depression.
The following graph plots forward estimates for the Dollar index versus the current value of the index. As shown, the dollar has mostly been above forecasts and is currently above future expectations. Interestingly, these bearish outlooks have not fallen over the last few months as the Fed’s balance sheet has surged in size and the Federal deficit is ballooning. We must keep in mind, dollar demand increases as foreigners borrow more dollar-denominated debt to fight the economics effects of COVID.
The following Tweet and graph from Troy Bombardia is interesting.
June 24, 2020
Texas Governor Greg Abbott said he might stop or slow down the state’s reopening plans if the contagion keeps expanding at what he calls an “unacceptable rate.” California is considering similar steps. New York City and other major east coast cities, on the other hand, are taking steps towards reopening. Reopening will like likely have fits and starts due to the size of the country and the different timing in which the virus hit each geographic area. The following graph shows how the recent outbreak in the Houston area has weighed on restaurant traffic.
Over the last few weeks, one of the more notable oddities of the equity markets has been the daily performance divergences between the major indexes. In previous commentaries we made a note of the uncorrelated relationship between the Dow Jones Industrial Average and the NASDAQ. The Wall Street Journal picked up on this as well. They wrote:
A surge in big technology stocks has helped the Nasdaq Composite rally 12% in 2020, while the Dow Jones Industrial Average of blue-chip stocks is down 8.8%. The benchmark S&P 500 is hovering in between them, off 3.5%.
The Nasdaq’s advantage over the Dow and S&P 500 is the biggest since 1983. The gap between the S&P 500 and the Dow is the widest since 2002, when the Dow was ahead.
There has been a lot of debate about how much economic damage was caused by the economic shutdowns and what a second round of shutdowns might mean for the economy. Data out of Sweden and Denmark helps shed more light on the question. Sweden, which did not shut down, saw spending decline by about 25%. Neighbor, Denmark, which had a full shutdown, saw spending fall about 30%. While a small sample set, the government imposed shutdowns may not matter as much as what individuals do or do not do. As we learned, despite complete freedom to consume, the Swede’s, by and large, voluntarily shut themselves down. Click LINK for the whitepaper by the University of Copenhagen.
The following graphs show the yields on junked rated BB and CCC corporate bonds. As shown below, the recent spike in yields pales in comparison to the prior recessions of 2008 and 2001. The red lines show the current yield to compare to historical levels. Note that BB-rated securities are just about at all time record low yields despite a deep recession. CCC-rated bonds are not as overbought, but still well below where they should be given that we are in a recession and credit losses are picking up. The outperformance of BB versus CCC is likely due to the fact that the Fed is predominately buying BB-rated securities in its corporate bond QE program. Returns on junk rated debt are now heavily dependent on the Fed’s activities and not the underlying fundamentals of the corporations themselves. This is yet another massive market distortion caused by the Fed.
On the topic, American Airlines is in the market with a secured junk bond offering. The company just increased the offering yield from 11% to 12% as demand was tepid. The offering gives us some hope that there are some instances within the junk-rated bond market where investors are still being paid to take risks.
June 23, 2020
Like the previous night, the overnight session witnessed a bout of volatility. After trending higher after the close, Peter Navarro said the trade deal with China is “off.” The markets plummeted on the news, with the S&P down almost 60 points from its highs. Navarro quickly backtracked and said the comments were taken out of context. The market rebounded quickly and is set to open about 15 points higher.
This week is expected to be quiet on the Fed front with only two speakers. The Fed’s annual Jackson Hole retreat/meeting scheduled for late July will now be held virtually. In recent years, the Fed Chairman has used the event to announce new policies or discuss changes in their economic forecast. We suspect that yield curve control could be discussed at length at the meeting.
A few manufacturing surveys will be released this week and as always Initial Jobless Claims on Thursday. We continue to closely follow claims data as it has a strong correlation to employment, and in turn, greatly affects the Fed’s operations. Next week’s BLS employment report will be a test for the V-shaped recovery camp. The consensus estimate is for a gain of 3.6 million jobs on top of the 2.5 million from May. The unexpectedly strong May report raised the bar for how quickly investors expect the labor force to be redeployed. Given optimistic expectations, any significant downside miss versus expectations will bring into question the trajectory of the recovery and the reliability of economic data during this period of economic turmoil.
There is a big debate among investors about the market benefits of QE. In particular, whether it is the stock or total amount of QE, or the flow, the weekly change in QE that drives the market. The graphs below show that while the stock of QE administered over the last few months has been massive, even when compared to 2008, the flow has slowed dramatically. In fact, as can be seen in both graphs the Fed’s balance sheet shrunk last week. The decline was primarily due to a reduction in repo operations and foreign currency swaps. This should be a one-time event but the growth in the stock and rate of flow will be minimal compared to the prior months.
Shown below is a graph from J.P. Morgan in which they highlight that correlations amongst a wide variety of global assets have increased sharply to its highest level in at least the last 20 years. Correlations spiked briefly in 2008 as economies struggled (represented by the red line). At that time QE was introduced by the Fed, ECB and BOE and markets around the world benefited in unison from the liquidity. This crisis is seeing unprecedented monetary liquidity in terms of the amount of securities the banks are buying but also in terms of the number of different asset classes they are buying. One of the downsides to their actions is the benefits of diversification are diminished.
June 22, 2020
Quadruple witching day proved to be volatile, especially around the time options were to expire. The market opened up higher, soared minutes before the options were set to expire, reversed the gain equally as fast, and then proceeded to fall for the remainder of the day. Stock futures fell sharply after the close but rebounded in Sunday night trading and recaptured most of the losses. The NASDAQ bucked the trend on Friday as investors again flocked to the “safety” of tech stocks.
The ring leader of the fad of buying junk companies provided us with yet another entertaining view of how “newbie” investors are deciding what stocks to buy. In the video linked below, David Portnoy literally pulls three Scrabble letters out of a bag and proceeds to buy 200k worth of the stock (RTX). Fortunately, or unfortunately, we hold RTX in our equity portfolios.
The current Atlanta Fed GDP Now forecast for second quarter growth is -45.5%. While improving since early June, it is still well below the consensus forecast of -35%. One reason for the difference is that GDP Now uses only available data while most forecasts use actual data and estimates for unknown data. June should see continued improvement, which will push GDP Now higher over the coming weeks.
In a recent interview on Bloomberg, Kevin Warsh, former Fed member, criticized the Federal Reserve’s policy efforts. In particular he stated: ” They (Fed) seem to be incredible aggressive even as risk assets are at incredible highs.” He followed that with “I wish the same aggressiveness was being felt in the policies they are putting on Main Street.”
Like, Mr. Warsh, we believe the Fed is doing everything in its power to keep asset prices stable or even higher. The problem is that so little of their efforts will help the economy in the short run but are accompanied by negative economic and societal consequences in the long run. From a macro perspective, higher stock prices despite weakened long term economic growth do not bode well for investors in the future.
June 19, 2020
Initial Jobless Claims came in higher than expected at 1.51 mm versus 1.29mm expected, and 1.57mm last week. Of concern, continuing claims have been relatively flat for four weeks running. This number should be declining rapidly if the economy is to recover as quickly as many think it may. The chart below shows state and federal unemployment continuing claims.
The Philadelphia Fed Business Outlook Survey showed great improvement from -43.1 to +27.5. Diffusion indexes like this survey do not report actual levels of activity but simply whether or not things were better or worse. Given the poor conditions in May and reopening in June, it is not surprising that there was an improvement in the outlooks of business managers’.
It is widely reported that U.S. shale producers will bring about 500K barrels per day back online by the end of June. The price of crude oil has consolidated in the $35-40 range over the past few weeks in what is hopefully a sign that the gross supply/demand imbalance that caused negative oil prices has corrected.
The graph below from the Man Instituteshows the degree to which “garbage” stocks have outperformed the market during the most recent leg of the rally. They define garbage stocks as those having a credit default swap price of over 1000. In other words, these companies are solidly in junk-rated corporate debt territory.
The graph below compares the strong recovery in Retail Sales versus the nascent recovery in Industrial Production. Retail sales are directly boosted by a variety of stimulus programs. On the other hand, Industrial Production has not benefited to nearly the same degree from fiscal stimulus. This divergence, in the words of @peter_atwater, is a “K-shaped” recovery. Basically, Peter argues there are the haves and the have nots of this recovery.
The biggest question facing the economy is can consumers continue to carry the weight as fiscal stimulus programs wane. If not, can the government pass another round of stimulus before the election?
June 18, 2020
Initial Jobless Claims, released at 8:30 am, are expected to fall from 1.542 mm to 1.22 mm.
The following Tweet and graph from @renmacllc raise the question of whether the recovery in employment is starting to level off. The data in the graph is based on daily readings.
Friday is Quadruple Options Expiration day, meaning that four sets of stock options expire, including futures options, index options, single stock options, and single stock futures options. This event, occurring four times a year (3rd Friday of March, June, September, and December) tends to result in increased volume and volatility as securities and options are bought and sold to replace expiring options, re-hedge positions, or to meet the needs of a contract expiring. This Friday will see a larger than normal number of options expiring, which could result in additional volatility.
Per the Mortgage Bankers Association (MBA) 8.55% of mortgages are in forbearance, equating to approximately 4.3 million households. The graph below shows the percent of loans in forbearance by the three mortgage types and the total. For consideration, would retail sales have been as strong if 4.3 million households made mortgage payments?
It is not all gloom in housing. Also, according to the MBA, mortgage purchase applications hit an 11 year high. The data is seasonally adjusted so it is likely skewed as March and April activity got pushed to May and June.
The chart below from Moody’s shows its baseline, optimistic, and pessimistic expectations for global corporate default rates. Based on the fact that U.S. credit spreads are nearing record low levels, the market is clearly banking on a better than best case scenario. Keep in mind the Fed is buying corporate bonds so yield levels and spreads do not properly account for market default expectations.
June 17, 2020
In testimony to the Senate, Chairman Powell largely reiterated the same overall message from last Wednesday’s FOMC meeting. While he is encouraged with signs of recovery, he said the economy would continue to struggle until a cure or vaccine is discovered. Facing some Senator’s concerns about the Fed’s burgeoning balance sheet, Powell said the Fed’s intention is not to monetize Federal debt. Whether that is their intent or not, the Fed’s balance sheet has grown by $2.95 trillion while the amount of federal debt outstanding has risen by $2.88 trillion since the new year. He also said the Fed is “some years away” from halting asset purchases.
Like unemployment, Retail Sales far exceeded the best expectations. On a monthly basis, retail sales rose 17.7%, almost double what economists expected. Retail sales are off 10% from the peak. Sales are greatly benefiting from the various forms of government stimulus. As those benefits wane, we will get a clearer reading of retail sales and other consumer spending data.
On Tuesday morning, the market rallied strongly on an infrastructure bill. While stimulus is frequently good for the markets, the chances of a major bill happening before the election is very low. For one, we must ask how likely is it that House Democrats pass a bill that would help Trump’s reelection chances. Equally important, we have heard more about deficit and spending concerns from some Republicans. Given the political climate and upcoming election, a big funding bill, barring a reemergence of crisis conditions, will be very difficult to pass.
The May monthly Treasury statement shows that federally withheld income tax receipts fell 33% from May of 2019. Given that withheld taxes are directly tied to paychecks, the massive gap between this data point and the May employment report raises a lot of questions.
According to a popular Bank of America survey, a record amount of professional money managers think the stock market is overvalued. While seemingly a bearish signal, markets are known to climb a wall of worry. It is worth noting that in the recent market decline, the survey never reached low levels, let alone the levels achieved at the end of the last two bear markets (2003 and 2009).
June 16, 2020
The Fed announced they will start buying individual corporate bonds as part of their corporate bond-buying QE program. The specific bonds they intend to buy will be based on an index which will satisfy the Fed’s criteria. LINK to the press release. Before the announcement, the Fed was only buying corporate bond ETFs. The stock market took the statement as a positive, but it represents no change in strategy or in the amount they will buy in the corporate bond market. The Fed just seems to have cleared an operational hurdle and will go ahead with their original intentions.
Yesterday was another roller coaster in the markets. The S&P 500 was down nearly 90 points or 3% in the overnight session. It came back throughout the morning and then took off on the Fed announcement. It closed up nearly 1% on the day and is up another 1% coming into this morning’s session. The culprit for the latest rally is a proposal from Trump for $1 trillion infrastructure spending.
Jerome Powell will speak today at 10 am and tomorrow at noon. Last week he came off as bearish about a swift economic recovery and did not commit to more stimulus. In times of economic crisis, which we are still in despite the market rebound, investors always want more. We have no doubt the Fed will do more if “needed.”
Retail Sales and Industrial Production will be released this morning and Jobless Claims on Thursday. Retail Sales are expected to rebound sharply, following a drop of 8.7% in March and 16.4% in April. The consensus of economists is calling for a +7.5% rebound in May. Like all economic data, Retail Sales has a massive range of estimates (+2.3% to +12.2%).
In one of the more bizarre events we have witnessed, Hertz will offer new equity. The proceeds will be used to pay back bondholders that are being defaulted upon. Despite the new funds, bondholders will still be owed money, which leaves the new and existing equity holders with little to no value. The bondholders are taking advantage of investors that have flocked to shares of bankrupt companies. In the SEC filing for the new shares, Hertz makes it clear that the offering is fraught with risk. To wit: “Consequently, there is a significant risk that the holders of our common stock, including purchasers in this offering, will receive no recovery under the Chapter 11 Cases and that our common stock will be worthless.”
Tesla’s stock recently surpassed $1000 per share and, in doing so, topped Toyota with the largest market cap in the industry, as shown below. To help assess whether its current price is fair or not, we can compare Tesla to Toyota. The bet on Tesla is a big bet on its abilities. For Tesla to justify its current valuation it would need to increase its car sales by nearly 30x. That is a tall order, especially considering that over the next year or two all of the major auto manufacturers will be selling electric vehicles and, in many cases, at more reasonable prices than Tesla.
June 15, 2020
Friday was a volatile day. After the sharp loss on Thursday, the market opened up nearly 3%. It proceeded to give up the entire gain and fall slightly below the 200-day moving average. Toward the end of the day, it rallied again to close up 1.30%. This morning the market is weaker and trading below its 200-day moving average.
The June Preliminary University of Michigan Consumer Sentiment Survey was positive, coming in at 78.9 versus estimates of 75. It was 72.3 in the prior month. Current conditions and future expectations both rose nicely. While the data is encouraging, it comes with a disclaimer. Per Barrons: “The interesting thing to note is that the recent improvement in sentiment has a partisan skew. The improvement in sentiment as reported by the University of Michigan is being driven almost entirely by self-identified Republicans and independents.” The political divide may not be as much about politics but a result of the larger cities, which tend to have more democrats, getting hit harder by COVID and enduring longer shutdowns.
The New York Fed puts out the Weekly Economic Index (WEI), a real-time estimate of economic growth. After bottoming in late April, the index has slowly risen. Of concern, the latest reading fell slightly from -9.6% to -10%. While one weekly decline is not concerning, it does point to a slow and tenuous recovery, unlike what the market and most pundits seem to be expecting.
As we have shown, economic data has been very volatile, at times misleading, and often data is at odds with other data. Such confusing economic data may remain with us for a few months as the economy levels off and begins to rebound. Given the unique situation, we are looking for signs that economic data is generally trending in the same direction and are careful not too read too much into one piece of data.
In its latest Quarterly Refunding projection, the U.S. Treasury estimated it will have a cash balance of approximately $800 billion at quarter-end, down significantly from its current $1.5 trillion surplus. A big reason for the massive surplus is the fact the Treasury is holding reserves for PPP loans and other CARES Act expenditures. In the case of the PPP loans, the Treasury will need to make the banks whole for loans that are forgiven or defaulted upon.
June 12, 2020
The media headlines explaining yesterday’s decline were as follows: COVID cases in states that re-opened early are surging, Jerome Powell was not optimistic about a strong economic rebound, and Trump’s poll numbers are slipping. Those are the narrative. The primary reason is that the market was technically grossly overbought. Going forward, it will be important assess whether the decline is part of a healthy correction/consolidation or a reversal. The S&P 500 broke slightly below the important 200-day moving average, but is trading above it this morning, and it is still well above the 50-day moving average. Where the market closes to end the week will be important as to our positioning going forward. We will have more on this topic in this weekend’s newsletter.
The yield on the 5-year U.S. Treasury note is just one basis point from its all-time low. With yields nearing record low levels, stock investors hedging with bonds have a problem. As long as the Fed steers away from a negative rate policy, Treasury yields will likely have a floor. Therefore, with limited price upside, the offsetting benefit of holding bonds is potentially much less than in years past.
The graph below shows the difference between current yields and the record lows achieved over the last few months. The table below the graph calculates the potential price gain if the bonds were to fall back to their respective record lows. As shown, other than 30 years bonds, there is little room to profit, unless the bond market begins to price in negative yields.
Initial Jobless Claims met expectations for a decline of 1.542 million jobs. Continuing claims were higher than expectations and largely unchanged from the prior week. The bottom line from recent claims data is it seems like there is a lot of job churning as some people are getting laid off while others are getting re-hired. Producer Prices (PPI) were slightly higher than expectations at +0.4% versus 0.1%. Excluding food and energy, PPI met expectations at 0.1%. The Fed tends to rely on the data excluding food and energy as they tend to be volatile.
Not surprisingly, the Baker Hughes oil rig count and Crude oil are well correlated. With the price of crude back to near $40 a barrel, we are interested to see if rig counts start rising. If not, it may be that the financial damage to oil producers of the last few months will preclude a lot of wells from being put back online in the short run. If this is the case, reduced supply and increasing demand for oil would be a nice tailwind for the price of oil. Despite the strong rally in crude, it still about 30% below where it started the year.
June 11, 2020
The Fed statement was very similar to what we have heard from numerous Fed speakers in that the Fed will do whatever it takes. The only statement of note is that the Fed will buy bonds “at least at the current pace” for now. This appears to be a floor they are putting under QE in regards to the amount of weekly purchases. Per Bloomberg- “In a related statement, the New York Fed specified that the pace of the increase would be about $80 billion a month for purchases of Treasuries and about $40 billion of mortgage-backed securities.” As we discussed yesterday, it is likely that massive Treasury supply and the inability of the market to absorb the bonds concerns the Fed.
The table below shows the new Fed economic and rate forecasts through 2022. Of note, they expect the unemployment rate to end 2020 between 9% and 10% and Fed Funds are expected to stay at zero through 2022. The Fed expects inflation to run below 2% for the period and GDP to recover back to 2019 levels by the end of 2022.
Per Jerome Powell’s testimony:
Yield Curve Control (YCC), in which the Fed manages QE toward specific yield targets across the maturity spectrum of Treasuries, was discussed and will be in upcoming meetings, but they are not ready to act upon it yet. They also do not appear to have any interest in negative rates.
Powell doesn’t believe that the additional stimulus related debt being added to federal and corporate balance sheets will dampen future economic growth. This “logic” flies in the face of data from the last 40 years.
“We’re not thinking about raising rates. We’re not even thinking about thinking about raising rates.”
May CPI fell 0.1% monthly and annually versus expectations of a 0% inflation rate for both. Core CPI (excluding volatile food and energy prices) was also down 0.1%. Food prices rose 0.7% for the month, the largest monthly gain since 1984. Lower energy prices offset the gain in food prices. This trend will reverse as recent increasing energy prices take a few months to show up in CPI data.
This was the first time since at least 1957, in which Core CPI fell for three straight months. Since 1957 there have been 761 monthly CPI reports. In only 12 of them, including the three most recent, have core CPI prices declined.
Starbucks announced weaker than expected earnings yesterday. In particular, we thought the following data was interesting: In China, 99% of their stores have opened but sales are still down 21% from a year ago. In the U.S., 91% have opened and sales are down 43%. As the economy continues to reopen and people feel comfortable going out, sales will rise. The question is how much will the recession hamper sales versus customers concern over the virus.
Tesla’s stock surpassed 1000 yesterday and is now up 235% on the year. Its market cap is almost three times larger than that of GM and Ford combined.
June 10, 2020
The key event today will be the Fed’s statement at 2pm and Jerome Powell’s press conference following at 2:30. We expect the Fed will keep promoting their aggressive policy actions and offer to do more if needed. We doubt they will give any indication that they are considering taking their foot off the gas pedal.
In yet another sign of bullish exuberance, the Put/Call ratio continues to fall to multi-year lows. As of Tuesday, the index stood at .37, a level last seen five years ago. The ratio measures the proportion of put options to call options purchased on each day.
The market rotated back to its favorite sector yesterday as the NASDAQ crossed 10,000 for the first time. Yesterday the NASDAQ was up .29% while the Dow fell 1.09%. We are watching to see if the divergence is the beginning of a rotation back to larger cap and higher quality companies from poorer quality stocks that have recently been playing catch up. We noted in last Friday’s Sector Relative Value Report, that the tech sector (XLK) was moving towards deeply oversold territory versus the S&P.
On Friday June 5th, the Fed’s overnight repo program for Treasuries exceeded $100 billion for the first time since early March, as shown below. The recent uptick may be an early warning that the banks are struggling to absorb record amounts of Treasury debt issuance. Making the task harder is that the Fed is drastically slowing their purchases of Treasury securities. Fed Treasury bond purchases peaked in late March at $362 billion per week. Since then, it has declined to about $25 billion per week. In May, the amount of Treasury debt outstanding rose by $759 billion, or $190 billion a week.
If the Fed is concerned that banks and investors are struggling to buy the massive debt issuance at current rates, we should expect them to increase the amount of QE directed toward Treasuries. The topic may be mentioned by Powell today, but we suspect any changes will show up in their weekly QE guidance.
As we have discussed, the nationwide protests are largely propelled by racism and police misconduct. Still, they are also driven by economic dissatisfaction due to the growing divergence of wealth and poor. This should not be surprising given the wealth inequality gap is now the widest since the late 1920’s. Given that the latest crisis is substantially widening the gap even further, we should expect protests here and abroad to be a mainstay at least through the election. We recently read an article from Albert Edwards of SocGen in which he shows the recent protests in America are part of an increasing trend of global protests occurring over the last decade. His paragraph is below. (CLICK TO ENLARGE)
S&P cut Japan’s sovereign A+ rating outlook from positive to stable. While not a rating cut per se, it does set the stage for S&P to reduce the rating soon. We will likely see more negative ratings moves on sovereigns, municipals, and corporations as debt levels have increased markedly against a backdrop of slower growth and decreased revenues.
June 9, 2020
Inflation data and the Fed take center stage this week. CPI will be released Wednesday, followed by PPI on Thursday. The consensus expectation for CPI is for 0% inflation on a monthly and annual basis.
Also of interest is the NFIB Small Business Optimism Index released this morning. After falling sharply in March and April, it improved in May. Given the importance of small businesses, this is another potential sign that a recovery has begun.
The Fed meets on Tuesday and Wednesday, followed up with the FOMC statement and Jerome Powell press conference at 2:00 and 2:30, respectively, Wednesday afternoon. In addition to updates on the state of monetary policy and the economy, we are looking for hints on whether yield curve control (YCC) may be the next iteration of QE. We will have more on YCC in an upcoming article. We are also on the lookout for any signs of taper, as the financial markets appear to be liquid and on a sound footing.
The ramp in equities has been increasingly led by a rotating set of stocks, many of which were the most beaten down in March. The action appears to be largely momentum based. In other words, those stocks up the most in the previous days are likely to be attractive today. Caution is warranted as the list of “in” stocks changes quickly and without much reason. To that point, Chesapeake Energy (CHK) rose 181% yesterday but is slated to open down 50% this morning as they are preparing to file for bankruptcy.
Robinhood is a rapidly growing broker designed for small retail investors. Robinhood is popular, in part, because it allows partial share trading and markets to younger investors. The graph below shows how their popularity accelerated at the market lows in March.
Robinhood publishes daily data on which stocks its users are holding. On June 4th we downloaded their top ten holdings and found that those stocks in aggregate beat the S&P by about 15% since May 1st. In the list are many companies hobbled by the recession such as Ford, American Airlines, Delta, Carnival Cruise Lines, and Norwegian Cruise Lines. While Robinhood users are small and not big enough to move markets, we do believe their mindset of chasing momentum, regardless of valuation, applies to a much larger population of investors. To wit, we saw a tweet from a well-known options trader as follows: “Between $AAL$DAL$UAL$SAVE$LUV the five Airlines have traded 1.3M calls today Then $CCL$NCLH$MGM another 588,000 calls Never seen this amount of activity, crazy“
Speaking of excessive bullishness comes the following tweet and graph from @sentimentrader.
“This is stunning. At the peak of speculative fervor in February, small traders bought to open 7.5 million call contracts. This week, they bought 12.1 million. Watch what people do, not what they say. They’re full-bore bullish, on steroids.”
The takeaway is that this bout of speculation can certainly continue, but be careful as excessive speculation is a hallmark of a market top, not the beginnings of a bull market.
June 8, 2020
The employment data on Friday was truly stunning. The BLS reported that 2.509 million jobs were added in May versus expectations for a 7.725 million decline. Considering a miss of 100,000 used to be considered significant, we do not know how to describe a miss of 10 million. March and April were revised lower by a combined 640k jobs. The unemployment rate fell from 14.7% to 13.3%.
Making the report even more confounding is that the data is at odds with initial jobless claims data from the BLS. Also leading us to question their findings is the following from AP and this LINK from the BLS.
Friday’s report made it clear the government continues to struggle with how it classifies millions of workers on temporary layoff. The Labor Department admitted that government household survey-takers mistakenly counted about 4.9 million temporarily laid-off people as employed.
The government doesn’t correct its survey results for fear of the appearance of political manipulation.
Had the mistake been corrected, the unemployment rate would have risen to 16.1 percent in May. But the corrected April figure would have been more than 19 percent, rather than 14.7 percent.
If you are interested in learning more about how difficult measuring employment is today, the following LINK from the BLS is worth a read.
Regardless of the accuracy of the data, the good news is that the labor market appears to be improving. We hope the rest of May’s economic data being released throughout June confirms the strong BLS report. In case you still crave more on employment, here is our take from this past weekend’s Newsletter.
The Wall Street Journal recently published the graph below which helps us better formulate our employment outlook for the next six months. Per the chart of small business employment expectations, small businesses expect to end the year with 75% of the employees they started the year with. In January, small businesses, defined as 49 employees or less, employed 33.1 million employees. If these companies get payrolls back to 75% of January’s level, it implies that over 8 million jobs will not return. The total workforce in January was about 151 million people. If we make the bold assumption that all other companies (more than 49 employees) return to peak employment levels and the survey in the graph is correct, we can expect an unemployment rate of 8.8% at yearend. That includes the 8 million from small businesses and the 3.5% unemployment rate from January.
Late on Friday it was reported April revolving credit for April fell -$55.7 billion, a record decline at -5.4% month over month. That follows a $29.7 billion decline in March. The combination of $1200 CARES Act checks and sharp spending declines are driving this unprecedented drop in revolving consumer debt, such as credit cards and home equity loans.
OPEC agreed to extend the current 9.7 million barrels per day cuts by one more month. All members appear to agree on the extension except Mexico.
June 5, 2020
Initial Jobless Claims were slightly worse than expectations at 1.87 million versus the consensus estimate of 1.79 million. Continuing claims increased by 649k to 21.48 million. Interestingly, the BLS added a new table, shown below, which shows that total claims, including state and Federal programs, are close to 30 million. 30 million unemployed should equate to an unemployment rate of 23%.
With the BLS jobs number being released at 8:30 today, we shed a further thought on Wednesday’s surprising ADP number to help us better appreciate what may be reported this morning. ADP reported that 2.76 million jobs were lost based on data from mid-May when the survey was taken. During the same period in May, 5.133 million initial jobless claims were filed. The only explanation for the difference is that 2.3 million people found jobs in the first two weeks of May.
The updated estimate for this morning’s BLS report, with consideration for the ADP report, is for the workforce to shrink by 7.725 million jobs, bringing the unemployment rate to near 20%. Prior to the release of the ADP report, the consensus was for a loss of 8.663 million jobs. Clearly, the consensus of economists is not putting much faith in the ADP report.
The ECB increased its sovereign bond buying program by 600 billion euros. The increase allows them to buy up to 1.35 trillion by June 2021. They kept their main deposit rate unchanged at -.50%. The latest action shows the ECB doesn’t seem to care about the recent ruling by a German high court in which they said the ECB’s QE Program breached Germany’s constitution. We will wait to see if Germany responds to the ECB’s announcement.
As shown below, courtesy Bianco Research, small caps are now more overvalued than at any time in at least the last 25 years.
June 4, 2020
The ADP report was much better than expected. For the month of May, ADP reports that 2.76 million jobs were lost. While a large number, it was well below estimates of 8.663 million. We are hopeful the report signals that the trough in job losses will occur over the next month or two, and job gains begin. ADP has a good historical correlation with the BLS report coming Friday, so fingers crossed that the BLS number is equally as strong.
On the heels of the ADP report, Mark Zandi Chief Economist at Moody’s, said “the good news is I think the recession is over, the COVID 19 recession is over, barring a second wave, a major second wave, or real serious policy errors.” While job growth and an end to the recession would certainly be welcome news, it could be many years before GDP gets back to its pre-COVID levels. Despite what appears to be positive quotes from Mr. Zandi h he projects unemployment will level off around 10%, unless there is more fiscal stimulus.
Since 1947, there have been 11 recessions, and only one of them, 1981-1982, saw the unemployment rate surpass 10%. In February, the month prior to the COVID shutdowns, the unemployment rate was 3.5%, the lowest in nearly 50 years. For more context on historical unemployment rates see the graph below.
It is being reported that the President and Mitch McConnell have started discussions about a new round of economic stimulus. Apparently, McConnell wants to keep the amount below $1 trillion with a focus on initiatives that encourage people to go back to work and consume. Consumption within the travel and leisure industry is being specifically mentioned. Given the riots and upcoming election, along with strong markets and moderating economic data, we believe passing a new round of stimulus through both houses of Congress will be significantly more complicated than the last round.
The graph below, courtesy Bloomberg, shows that the Barclays index of investment-grade corporate bonds is now close to the record low for yields.
Illinois will be the first state to tap the Feds new Municipal Liquidity Facility. Per the FT, they will borrow $1.2 billion at a rate of 3.82%. The interest rate is lower than that in which they can borrow in the open market. The Fed has allotted $500 billion to lend to states and local municipalities.
June 3, 2020
On Monday, Amazon locked in record low borrowing costs with a $10 billion, multi-maturity debt offering. The issuance included 3 year, 5 year, 7 year, and 10 year maturities. The 3 year notes carry an interest rate of only 0.40%.
Bank of America and JP Morgan have tightened credit standards for new mortgages and refinancings. Yesterday, Wells Fargo said they would stop making loans to most independent car dealerships. While these actions are probably smart credit decisions, they will no doubt cause borrowers (mortgage or auto dealers) to seek higher rate loans or possibly falter. Tightening credit standards is another headwind to the recovery.
Corporate debt issuance has surpassed $1 trillion for the year, already matching the record annual pace of the last few years. Prior to the COVID crisis, the amount of corporate debt was rising faster than corporate earnings and GDP. The pace has accelerated under the crisis due to reduced economic activity and more debt. If corporations use the borrowed money toward productive purposes, the borrowing is beneficial. If it is used for buybacks, dividends, or short term liquidity, the debt will hamper earnings and long term economic growth. As shown via the increasing trends below, debt has primarily been employed for non-productive purposes. If that were not the case, higher levels of debt would be more than offset with even higher profits and GDP and thus declining ratios.
ADP, a reliable proxy for Friday’s job report, will be released at 8:30. The estimate is for a decline of 8.663 million jobs versus last month’s reading of 20.236 million. The range of estimates is extremely wide, ranging from -11mm to -3.3mm.
As shown below, non-commercial positioning of S&P 500 futures (mini contracts) shows that traders are as net short today as anytime since 2015. Despite the rally of the last two months, the net short position has not alleviated as is typical. During Q4 of 2015, the last time net shorts were at equivalent levels, the market rallied but sold off sharply later that year and early into 2016.
June 2, 2020
The ISM manufacturing survey rose slightly from 41.5 in April to 43.7 in May. While still deeply in contraction territory, the increase from last month is a hopeful sign that April marked the economic bottom. On Wednesday, ADP will release its employment report, followed by Jobless Claims on Thursday and the BLS monthly employment report on Friday. The current estimate for Friday’s labor report is a loss of 7.725 million jobs bringing the unemployment rate to 19.8%.
As shown below, protests have occurred in over 140 cities and almost every state. The demonstrations and looting will further hamper economic activity and may lead to a resurgence of COVID cases in many places that were seeing good progress in slowing the spread. Per Thomas Lee @fundstrat: “Whatever ‘stay at home’ restrictions, limits on gathering size, etc., — these ended this weekend., … these large gatherings effectively cancelled all the efforts over the past 10 weeks to .. mitigate transmission. So, the next 2 weeks will be important to watch.“
China is taking actions that appear to signal that they are walking away from the trade agreement. Per Reuters – CHINA HAS ASKED MAJOR STATE FIRMS TO HALT PURCHASES OF SOYBEANS, PORK FROM U.S. AFTER U.S. ACTIONS ON HONG KONG
Now for a bit of Macroeconomics. Demographics play an important role in forecasting economic growth. Much has been written on the aging of the baby boomers and the effect that reduced spending and saving of this oversized generation will have on economic activity. We think the status of the Millennials deserves equal if not greater focus. They are quickly becoming the nation’s prime consumer and political leaders.
The graph below, dating back over 200 years, shows that economic growth per capita during the first 15 years of Millenials careers has been the slowest on record. Weak economic growth along with onerous debt levels, and relatively low wage growth will weigh heavily on the generations ability to consume. The generational changing of the guard, so to speak, should be taken into deep consideration when thinking about the long run growth potential of the nation.
June 1, 2020
Personal income rose by 10.5%, while personal spending fell by 13.6%. As shown below, courtesy @ErnieTedeschi, the sharp and unexpected rise in income is due solely to unemployment benefits and the $1200 checks from the government. As a result of the large divergence in income and spending, the savings rate surged to 33%. To be honest, it is hard to make sense of the data and what it may mean for the state of the economy. All three data points were the largest increases or decreases on record.
Jerome Powell made some interesting comments on Friday.
“Negative rates interfere with bank credit intermediation” and “Not clear that negative rates are appropriate for the U.S.” – The Fed is holding off on negative rates as they hurt banking profit margins. As such, we do not expect the Fed to reduce the Fed Funds rate to below zero unless things get very dire. For what it’s worth, the Fed Funds futures market is still priced for a 50% chance of negative rates throughout most of 2021.
“Forward guidance and QE are no longer standard tools” – As we learned after 2008, QE is here for good.
“Fed’s Balance sheet can’t go to infinity” “Fed is not close to any limits on its balance sheet” -A lot more QE is possible but it’s not unlimited. The limit is inflation.
Powell did not mention yield curve control yesterday but, Cleveland President Mester added her support for it. Per Reuters: FED’S MESTER SAYS SHE VIEWS YIELD CURVE CONTROL IS A SUPPORT FOR FORWARD GUIDANCE IF FED WERE TO USE IT
The Atlanta Fed’s GDPNow forecasts that the second quarter’s economic growth (not annualized) will be -51.2% versus -40.4% on Thursday. Personal spending, noted above, was responsible for the downward revision to the prior forecast.
From the latest available data, ranging from May 20th to the 27th, the Treasury’s outstanding debt rose by $222 billion and the Fed’s balance sheet increased by $60. The net effect is a drain of $162 billion of liquidity from the markets. A continuation of the trend would raise our concerns over the sustainability of the current stock market rally and the tightening of corporate bond spreads.
At the start of the March sell-off, as shown below, the NASDAQ (QQQ) fell in line with the S&P 500 (SPY) and the Dow Jones (DJI). However, once the market began to recover in mid-March, the QQQs outperformed the other two indices by 10-15%. Over the past week, the QQQ’s have come under pressure relative to the broader market. The recent divergence is likely the result of investors rotating into stocks that are still beaten down from the QQQ leaders that rallied back to their prior record highs. Based on our relative value model, QQQ has returned to fair value versus the S&P 500, after having been overbought. Conversely DJI, which was nearly 1.5 standard deviations oversold a week ago, is closing in on fair value versus the S&P 500. As an aside, small-cap and mid-cap stocks are now grossly overbought relative to the S&P 500, having been in oversold territory for the last two months. Value has improved but still remains oversold versus growth.
May 29, 2020
Initial Jobless Claims were slightly higher than expectations at 2.123 million, down from 2.446 million last week. Federal Unemployment Assistance rose by 1.192 million. There was some good news as well in the report. The number of insured unemployment claims fell by 3.86 million to 21.052 million. The decline means that some people who filed claims in the last two months have been rehired by their employer or found a new job. Georgia, one of the first states to reopen, saw the largest drop in weekly claims at -65,000.
First Quarter GDP was revised slightly higher to -5% from -4.8%. Of note, the price index was revised upwards to +1.4% from 1.3%.
We have been reading that retail traders, and in particular small investors using the brokerage service Robin Hood, are driving the market higher. To debunk the theory first consider, and as discussed yesterday, the market gains are mainly occurring during the nighttime futures sessions, where retail traders have little to no access. Second, retail traders are small by definition and pale in comparison to the institutional traders that move the markets.
While the stock market continues to grind higher and check off technical signals supporting a bullish thesis, the VIX is not confirming the move. Since May 11th the VIX has risen marginally despite the S&P 500 gaining over 4%. We suppose there are a lot of leery investors and traders using options to hedge their increased equity exposure.
The 2yr/10yr U.S. Treasury yield has slowly widened to 50bps. We would have expected the curve to widen much more due to the uber-aggressive Fed operations and the longer term inflationary consequences of their actions. This time is different, however. The Fed is concerned that higher long term rates would be too large a burden on the government and corporations due to record debt levels. The market understands their fear, which is likely keeping longer term rates from going much higher and the yield curve from widening as it normally would. On the topic, we will be very interested to see if Jerome Powell brings up yield curve control in his speech this morning at 11am.
May 28, 2020
A pattern has been easy to spot over the last two days in which the market rallies at night and then sells off during the day session. This action has been somewhat consistent throughout the year. Per Bespoke, if you bought at the close and sold at the next days opening you would be up 19.7% this year versus losing 16.9% if bought at the open and sold the close. Holding for the full period would leave you down 6.1%.
As we have mentioned, the value of the Chinese yuan versus the U.S. dollar can serve as a barometer for the China-U.S. relationship. A weaker yuan is a sign that things are not going well. Not surprisingly, given the pressure China is applying to Hong Kong and the rhetoric being spewed between both leaders, the yuan has depreciated (higher price versus the dollar in the graph below). The yuan/USD depreciated to 7.17 yesterday, surpassing the prior high of last August and matching the weakest level since January 2008.
New York Fed President Williams said the Fed is “thinking very hard” about targeting yields along the Treasury yield curve. This is not surprising given the massive amount of debt the Treasury will be issuing and, therefore the need to keep interest rates low. We could see such an announcement as early as the next Fed meeting on June 10th.
As shown below, Commercial and Industrial loans (C&I) spiked by $367 billion in the last month as corporations aggressively drew down their credit lines to build liquidity.
The figure above does not include corporate debt issuance, which also increased markedly over the last month. In fact, as shown below, per the Financial Times, U.S. companies have already borrowed near similar amounts this year versus the annual entire amounts of each of the last eight years. Before the crisis, corporate debt was already at a record high versus GDP. These new borrowings will be a further drain on earnings going forward and potentially negatively impact their respective credit ratings. Per a new S&P report-“Downgrade Potential Rises to All-Time High” “The number of potential downgrades has widened to 1,287 as of April 28, from 860 in March and 649 in February.“
May 27, 2020
The S&P 500 was up over 1% yesterday despite three of its four largest stocks being lower (AAPL -.68%, MSFT -1.02%, and AMZN -.62%). The divergence can be interpreted as a bullish sign, in that the broader market is carrying more of the weight. It can also be seen in a bearish light as the market’s generals tend to lead. This was but one day of trading so do not read too much into its significance yet, but it is worth paying attention to.
One of the broadest measures of economic activity, the Chicago Fed National Activity Index, fell well below the consensus -3.5% expectation. For what it’s worth, a value below -0.70% has historically indicated the increasing likelihood of a recession. The index is comprised of 85 data points covering all relevant sectors of the economy.
This week will be quiet in regards to economic data. Of importance will be Initial Jobless Claims on Thursday (expectation 2.05mm) and the revised Q1 GDP report also on Thursday. Jerome Powell will speak on Friday at 11am.
A few weeks ago, a German court ruled that parts of the ECB’s QE operations were illegal under German law and needed to be changed. The ECB responded yesterday by saying they would launch infringement procedures against Germany if they stop buying bonds. Further, they are working on contingency plans to carry out purchases of German bonds even if the Bundesbank were to quit the program. The euro rallied yesterday to 1.10/dollar, which is about 5 euros above the lowest levels since 2003. If the spat between the central banks escalates, the euro could fall sharply, resulting in appreciation of the dollar, which is what the Fed has been trying to prevent over the last two months.
The graph below charts the popular crude oil ETF (USO) versus the price of the front-month crude oil. As shown, USO and crude had a nearly perfect correlation when oil sold off from January through April. At the time, USO largely held the front-month futures contract as they do not physically store oil. Accordingly, a strong correlation between futures and USO should have been expected.
The ETFs structure became problematic when the price of the front-month contract fell in price much more than the rest of the oil complex. When the price of the front contract approached zero, the price of the ETF should have theoretically also fallen to near zero. Instead of an ETF failure, the manager opted to change the structure, electing to hold less of the front-month contract and more later maturity contracts. Management did save the ETF and their management fees going forward, but investors locked in losses as they did not partake in the recent recovery in the front-month contract as shown below. Currently, the ETF owns seven different contracts out to June 2021, with the front-month contract only representing 15% of the ETF.
May 26, 2020
Hertz went bankrupt this past weekend. While widely expected, the event is unusual because the Fed, due to its holdings of junk ETFs HYG and JNK, is an indirect holder of HTZ debt and now a creditor in the bankruptcy process.
A sharp decline in the number of oil rigs has helped the price of crude oil surge. The latest data from Baker Hughes shows the North American rig count fell to 237, the lowest level since 2009. The current number of operating rigs is about one-third of the count at the beginning of the year.
Fed Vice Chairman Richard Clarida gave his inflation outlook in a recent speech. To wit: “While the COVID-19 shock is disrupting both aggregate demand and supply, the net effect, I believe, will be for aggregate demand to decline relative to aggregate supply, both in the near term and over the medium term. If so, this decrease will put downward pressure on core inflation.” The important takeaway is that Clarida believes the inflationary tug of war will favor deflation over the “medium term.” His outlook, which is likely the same view as Powell and a large majority of the Fed, provides the Fed cover to continue QE and possibly negative rates. While we suspect they will tout deflation to justify their actions, keep an ear out for changes in the forecast by Clarida or other Fed members as any concerns of inflation could prevent the Fed from being as aggressive as they currently are.
The graph below shows that over the last 20 years, the correlation between forward earnings expectations and the S&P 500 has been very strong (.90). The relationship has fallen apart in the recent rally with the correlation over the last two months falling to -.90. Will the relationship correct with improved earnings forecasts or lower stock prices? To wit we wrote the following recently (LINK):
“As stated, over short-term periods, the stock market often detaches from underlying economic activity as investor psychology latches onto the belief “this time is different.”
Unfortunately, it never is.
While not as precise, a correlation between economic activity and the rise and fall of equity prices does remain. In 2000, and again in 2008, as economic growth declined, corporate earnings contracted by 54% and 88%, respectively. Such was despite calls of never-ending earnings growth before both previous contractions. “
May 22, 2020
Initial Jobless Claims were slightly higher than expectations at 2.438 million. We are now over two months into the economic crisis, and the number of weekly new claims is still multiples of what is typically seen at the troughs of recessions. Continuing claims just elapsed 25 million.
In addition to the aforementioned data from the states, 2.22 million people filed for Federal Pandemic Unemployment Assistance (PUA- CARES Act) last week. The PUA is for those ineligible for state jobless claims programs. The right weekly initial claims number, adding the state and federal numbers together, is more like 4.6 million.
The recently released Fed minutes from their April meeting included the following statement:
“A few participants also noted that the balance sheet could be used to reinforce the Committee’s forward guidance regarding the path of the federal funds rate through Federal Reserve purchases of Treasury securities on a scale necessary to keep Treasury yields at short- to medium-term maturities capped at specified levels for a period of time.”
In other words, the Fed might enlarge its mandate to manage not only the Overnight Federal Funds Rate but also target yields of longer Treasury maturities. Japan is already capping interest rates, and the United States did it during and after WWII (1942-1950). One look at the 10-year U.S. Treasury yield makes one wonder if they have already started informally capping the yield at 0.75%.
The Wall Street Journal reported (LINK) that about 15 million credit card accounts and 3 million auto loans did not get paid in April. The numbers will be larger in May. As these delinquencies age, they become default risks for the banks. Lack of solvency for millions will not just be the banks’ problem but a significant drag on the economy.
One of the questions we are frequently asked is how do the Fed’s QE operations support stock prices. To help answer the question, consider that in March, as shown below, foreigners (net) sold $387 billion of U.S. Treasury securities. At the same time, the U.S. Treasury debt outstanding rose by $242 billion. Had the Fed not bought Treasury securities via QE, domestic investors would have needed to buy the $629 billion worth of bonds from the foreigners and the Treasury. Those dollars would mostly have come from investors selling other investments, including stocks.
Further, the Treasury bonds would have required a higher interest rate to attract the funds. Instead, the Fed bought $1,570 billion of securities in March, more than covering the $629 billion shortfall. Not only did they cover the gap but they took an additional trillion of bonds from the market. As such, those investors that sold bonds to the Fed needed to reinvest in other markets. In some cases, that was the stock market.
May 21, 2020
Crude oil rose 5% to $33.50 as President Trump issued a new round of sanctions on Iran and is “mulling” the seizure of Iranian oil tankers involved in trade with Venezuela.
The Treasury issued $20 billion of a 20 year bond. It was the first issuance of a 20 year bond since 1986.
Fed Chairman Powell will speak at 2:30 today. We do not expect to hear much new from him, given he testified to Congress on Tuesday and was interviewed by 60 Minutes on Sunday night.
Daily, the media and Wall Street try to diagnose why the market was up or down. Some days the explanations make sense. Other times it seems they are fishing for a rationale to explain price action. Yesterday Tom DeMarco, from Fidelity, avoided providing his readers a rationale and spoke the truth:
“Once again there is no good explanation behind the rally other than the same tired themes – reopening, positive linearity, drug/vaccine hopes, earnings rebound, stimulus, and super-cap tech.”
The market over the last few weeks is very reminiscent of 2019 when the U.S. and China were engaged in trade talks. Positive commentary, Tweets, and even specific words from the administration would trigger sharp moves higher and lower. At the time, the market had poor liquidity, which allowed algorithmic programs (algos) to easily move the markets with trades that keyed on various words from news feeds. Today’s markets seem very similar, but the algos are focused heavily on words related to reopening and vaccines. While the markets may seem stable, poor liquidity coupled with an unprecedented economic environment will result in violent moves up or down. Given the many unknowns about the virus, we suggest you stay vigilant.
The chart below is a fascinating result of our changing habits due to COVID. Per Bespoke: “As of last Wednesday, for the first time the market cap of ZM actually surpassed the total market cap of those nine major airlines as shown in the chart below.”
May 20, 2020
Monday’s explosive rally was led in large part by the announcement of positive vaccine test results from Moderna. Those hopes were tempered yesterday as the company said its vaccine trial is not working as well as expected. Making this odd sequence of events even fishier, Moderna raised $1.34 billion in a stock offering on Monday night. The offering was at $76 per share, $10 a share above where it closed on Friday. The stock fell over 10% yesterday to close at $71.67 after the bad news.
One of our biggest challenges going forward is correctly forecasting the tug of war between inflation and deflation. Currently, deflation is raging as demand dropped sharply and suppliers can not slow production fast enough. This was highlighted with oil prices when they went negative last month. While we have all seen some instances of higher prices, especially for food items and paper goods, inflation is not a story for today.
Tomorrow is a different story. In fact, an interesting divergence has emerged between investors view of future inflation versus consumers. The chart below compares the sharp divergence in expectations from the University of Michigan 1 year inflation survey versus the implied inflation from the TIPS market. The current 2.16% gap is more than twice the average differential of the last three years.
The graph below from job search agent Indeed provides some cause for optimism in the labor market. While the number of job postings is still well off the pace of a year ago, it has recently begun to trend higher. Over the past two weeks it improved from -39.3 to -37.2%.
The equity put-call ratio indicator compares put volume to call volume. The ratio tends to be a good sentiment indicator. When the ratio is high, it signals that investors are bearish as they are buying more puts than calls. Puts are often used as a hedging tool. Conversely, when it is low investors are bullish. Extreme readings can be signs of a pending market reversal.
Currently, the ratio is very bullish. Since 2004, the current level of .47 or less has only been met on 74 trading days or less than five times a year on average. The last time the ratio was below the current level is the standing record high set on 2/19/2020 when it hit .45. While very telling about the degree of bullish or bearish sentiment in the market, the ratio is not always a reliable indicator of an imminent change of direction, so take the current reading with a grain of salt.
May 19, 2020
A “buying panic” on Monday morning resulted in a record opening tick reading with 2049 stocks on the NYSE opening with positive upticks. As shown, that is unprecedented in at least the last 20 years. The combination of Jerome Powell saying the Fed has a lot more room for monetary policy along with positive reports that Moderna has positive test results for a COVID vaccine drove the record opening.
This week should be quiet on the economic data front. The Fed will be active with Jerome Powell speaking to Congress today at 10am, numerous Fed Presidents will speak throughout the week, and the Fed will release its minutes from the last FOMC meeting on Wednesday.
The June crude oil contract rose over 10% yesterday to $32.74 a barrel. The recent surge in price, especially the price action of the front month contracts has flattened the pricing curve. A few weeks ago, we talked about the unprecedented difference between the front contract and those 3-6 months out. That gap has completely filled with the front month contract standing only $1 less than the October contract. To put context around the change in the curve, the January 2021 contract is unchanged from a month ago (4/17/2020), while the June 2020 contract is up over 50% over the same period. Fingers crossed, but it appears the storage problem has improved.
In a 60 Minutes interview on Sunday night, Jerome Powell mentioned that the Fed can still do a lot more monetary stimulus. Actually, the amount is unlimited except for one crucial regulator that could slow or even halt their actions. The Fed has three mandates, one of which is stable prices. In deflationary times, such as today, the mandate gives them plenty of cover to print money to boost inflation.
As shown below, the money supply is up over 25% in just the last two months.
The economic environment is still overwhelmed by deflationary forces, and therefore, the Fed can print a lot of money. However, as the economy reopens, the combination of surging money supply and increased monetary velocity along with higher energy and food prices, could quickly push traditional measures of inflation higher. The Fed has mentioned on many occasions they prefer market-based inflation expectations to assess future inflation. The Five-year Breakeven Inflation rate (implied inflation from TIPS) has recovered from near zero to .84%, but it is still well below the 1.5-2.0% running rate of the prior years. This indicator may be the most important signal that inflation is a concern for the Fed and they may have to curtail QE. The Five-year Breakeven Inflation rate can be followed daily on the St. Louis Federal Reserve FRED site.
May 18, 2020
Stocks surged in overnight trading on comments from Jerome Powell on 60 Minutes in which he stated:
Powell to CBS: “There is no limit to what we can do under these emergency powers.”
CBS: “Where does the money come from?”
Powell: “We print it digitally.”
April Retail Sales were worse than expected at -16.4% versus the consensus estimate of -11.2%. More surprising, sales excluding gas and autos declined by a similar amount -16.2% versus forecasts of -7.6%. The only sector that saw an increase was non-store retailers like Amazon.
With the latest data, the Atlanta Fed lowered its GDP forecast for the second quarter to -42.8% from -34.8%. The estimate is based solely on released data. As such, it is probably overestimating the quarterly decline as economic activity will pick up as the economy reopens. Currently, the consensus of Wall Street economists ranges from -22% to -40%. These forecasts estimate activity for May and June.
Saber rattling with China continued on Friday. Per CNBC:
The Trump administration moved to block shipments of semiconductors to Huawei Technologies from global chip makers
The U.S. Commerce Department said it was amending an export rule to “strategically target Huawei’s acquisition of semiconductors that are the direct product of certain U.S. software and technology.”
Huawei is a leader in 5G technology and the world’s second largest smartphone maker. Huawei was a pawn in the first round of trade negotiations, so it’s not surprising to see this company once again in the spotlight. We would not be surprised to see the Chinese threaten companies like Apple or Intel.
Last week, the Fed bought $305 million of corporate bond ETF’s on its first foray into the secondary corporate bond market. They are approved to buy up to $750 billion. When the program was first announced the yield spreads between corporate bonds and Treasury bonds compressed meaningfully. Essentially, Wall Street bought at much lower prices to ultimately sold to the Fed at higher prices.
Over the last two weeks as Wall Street prepped for the Fed’s entrance, spreads have widened slightly. The graph below shows the ratios of the popular Investment Grade ETF (LQD) and High Yield ETF (HYG) to the 7-10 year UST ETF (IEF). In both cases, the corporate ETF’s outperformed after the program was announced in late March, but since mid-April have slightly underperformed.
One of the more prominent trends of the past two months has been the strong performance of momentum stocks like the FANMGs (FB, AAPL, NFLX, MSFT, and GOOG) as compared to the weak performance of value stocks. The chart below shows that the divergence between the two has reached an extreme not seen in at least the last 15 years.
May 15, 2020
Initial Jobless Claims were worse than expected at 2.981mm versus 2.5mm expected. Continuing claims surpassed 25 million, or 13% of the workforce.
More deflationary warnings came from the BLS in its Import and Export Prices report. The data measures the prices of nonmilitary goods and services traded between the U.S. and the rest of the world. The year over year change in imports and exports are -6.8% and -7.0% respectively.
Retails Sales, released at 8:30 this morning, is expected to fall by 11.2%. Prior to last month’s 8.2% decline, the largest monthly decline in the last 30 years plus was 2.92%.
The University of Michigan Consumer Sentiment report is expected to come in at 66, well off the recent February high of 100, but above the 57.7 low reached during the 2008/09 recession.
Despite the recovery of the major stock market indexes, the banking sector is not following. The graph below shows that the nation’s four largest banks, JP Morgan, Citi, Bank of America, and Wells Fargo, are all trading near the lows of March. Given that marginal growth in the economy is largely driven by debt and the ability of banks to issue new debt, this is a troubling sign for future economic growth.
The next graph shows the price ratio of the banking sector ETF (XLF) t0 the S&P 500 (SPY). As shown, the ratio is back to the lowest levels of the Financial Crisis.
As rates across the maturity curve compress towards the zero bounds, banks’ profit margins, aka net interest margin, are also compressing. Couple, reduced profit potential with surging delinquencies/defaults on consumer debt and the outlook is not great. As Europe and Japan can attest, negative rates are a big problem for banks. If the Fed Funds futures markets continue to imply negative rates, it should be tough for the banking sector to rebound meaningfully.
May 14, 2020
Producer Prices (PPI) were weaker than expected, declining 1.3% versus expectations for a .5% decline. The year over year rate is now -1.2%.
The consensus expectation for initial jobless claims, released at 8:30 am, is for an additional 2.5mm people to join the ranks of the unemployed. That is less than the 3.169mm from last week, but still almost 3x the largest weekly increase prior to this episode.
Fed Charmian Powell confirmed what other Fed Presidents have recently been saying about negative interest rates. To wit, he repeated a line from a prior FOMC meeting statement- “All participants judged that negative interest rates currently did not appear to be an attractive monetary policy tool in the United States.” He did call for more fiscal spending, which indirectly entails more monetary stimulus (QE) to help ensure rates do not rise as the supply of debt in the market is increased.
GE fell 3.5% to a price last seen during the depths of the Financial crisis of 2008. At that time, investors were concerned that GE was a bankruptcy risk. That rumor is once again circulating.
For all of the fundamental reasons to be bearish the stock market, investor sentiment is providing a reason for some bullishness. Bearish US investor sentiment, at 52.6%, is the highest it has been since January 2013. The S&P 500 rose 30% that year. As they say, markets like to climb a wall of worry.
Speaking of a wall of worry, famed investor Stanley Drunkenmiller stated the following on Tuesday: “The risk-reward for stocks is as bad as I’ve seen.” Within hours of Drunkenmiller’s comment, CNBC reported: “Young investors pile into stocks, seeing ‘generational-buying moment’ instead of risk.”
The following article from Bloomberg, Tax-Averse Nashville Goes Where Few other Cash-Poor Cities Dare, discusses the impact that COVID is having on Nashville’s finances and the tough decisions it is being forced to make. While the article is generally focused on the city of Nashville, it rings true for many states, counties, and cities throughout the United States. Given the dire situation these municipalities face and an election coming in months, we suspect a large second round of federal stimulus will ultimately be approved to help bailout out some of these entities. From the article:
“Congress has earmarked $150 billion for states and local governments — Nashville is slated to receive $122 million but the money must be spent on public health and can’t be used to fill budget holes.
State and local governments are in “uncharted territory” and will have to start making serious cuts if they don’t get more help, said Richard Auxier, a senior policy associate in the Urban-Brookings Tax Policy Center.”
May 13, 2020
The winds of a trade war with China are picking up. Yesterday, President Trump ordered that Federal retirement funds invested in Chinese equities should be liquidated. It will be interesting to see if China reacts as they are the second largest foreign holder of U.S. Treasury securities coming in at just above $1 trillion. The complete listing by country and one-year holdings history is found HERE. It is unclear how much in U.S. equities is held by the Chinese government and its citizens and corporations.
Adding to the pressure is legislation from Senator Ted Cruz that seeks to end reliance on China for rare earth metals. The bill is part of a larger push by Congress to reduce U.S. dependency on goods of national interest from China. Apple piled on yesterday when they announced they are working to shift “a significant portion of its production to India from China.”
April CPI fell 0.8%, reducing the year over year rate from 1.5% to 0.3%. Despite the broad based deflationary pressures, the BLS reported that the price for “food at home” aka groceries, rose by 2.6% in April, the largest increase in 45 years.
The degree or amount of monetary stimulus is often judged by real rates or the level of interest rates less the rate of inflation. With the sharp decline in CPI yesterday, real rates spiked higher, despite nominal rates falling over the last few months. For instance, the 10-year Treasury real rate in April was -.64%. With the latest CPI print, the real rate is now +.30%, a nearly 1% increase in real rates. Many economists argue that current monetary policy, despite massive stimulus, has actually tightened. Higher real rates is likely what is driving Fed Funds future below zero.
The problem of higher real rates is not lost on the President. On Twitter yesterday Trump stated: “As long as other countries are receiving the benefits of Negative Rates, the USA should also accept the “GIFT”. Big numbers!”
The following Reuters headline quickly followed the President’s Tweet :FED’S KASHKARI SAYS FED POLICYMAKERS HAVE BEEN ‘PRETTY UNANIMOUS’ IN OPPOSING NEGATIVE INTEREST RATES.
In addition to Kashkari, a few other Fed speakers were out yesterday and discussed a need for fiscal responsibility when the crisis is over and limits on how much monetary stimulus can be used. Chairman Powell will speak today at 9 am, and we shall see if he continues on these same themes.
The market traded sharply lower in the last hour of trading yesterday on a report that Los Angeles is likely to extend the stay at home order for at least three more months.
The Treasury announced that April’s budget deficit was $737.9 billion. Since at least 1980, there was only one other deficit in the month of April, and that was $82 billion. April tends to be a surplus month due to tax revenue.
Speculative short positioning of the 30yr U.S. Treasury Bond futures contract hit a record level. This class of investors represent hedge funds, CTA’s and other institutions trading for profits and not as a hedging activity. Frequently, when speculative positioning in futures is extreme, the market will reverse its recent trend. The chart below makes the case for bond prices to rise and yields fall. We are watching the situation closely as we would like to add to our bond exposure.
May 12, 2020
Saudi Arabia will reduce its oil production by 1 million barrels per day starting in June. It is unclear if other OPEC or non-OPEC nations will join them. Even with recent reductions, it is still believed supply is firmly outstripping weak demand, and with limited storage facilities, the pricing problems of April are likely to resurface. The June contract goes to settlement on May 19th, so pricing volatility will likely erupt later this week and early next week if that is, in fact, the case.
Per the Global Times: “China officials may consider invalidating Phase One of the trade deal and negotiating a new deal to tilt the scales more to the Chinese side.” The Trump administration countered by saying renegotiation of the deal is unlikely.
Chairman Powell will speak on Wednesday at 9am. The speech is not a planned appearance and its substance is unknown.
On the economic data front this week, inflation figures will be of the most importance. Currently, there is a significant lack of demand and, at the same numerous supply line problems. While we think the aggregate effect is deflationary, predicting CPI and PPI will be very difficult as there are certain products whose prices are rising rapidly, as many others fall. CPI, released at 8:30 this morning, is expected to decline -.8% month over month, bringing the annual number down to +.5%. A large part of the decline is due to oil prices. On the other hand, food prices are providing some upward pressure. The annual CPI excluding food and energy is expected to be +1.8%.
PPI, released on Wednesday, is also expected to decline. We expect PPI to show more deflationary tendencies than CPI as the prices are based on raw commodities, which have fallen sharply in price. The graph below courtesy of Thompson Reuters shows the 30%+ decline in the CRB index in 2020.
The other interesting economic data release this week will be Retail Sales on Friday. The current expectation is for an 11.2% decline, following last month’s 8.7% drop. Personal consumption is nearly 70% of GDP, so this number weighs large in GDP forecasts.
The chart below shows each date the national debt eclipsed the rounded $1 trillion level. Note the top three bars are all from 2020 and the year is not even halfway over. There will likely be at least two more bars added to the graph before yearend.
May 11, 2020
TheBLS reported that 20.5 million jobs were lost in April, bringing the unemployment rate to 14.7%, the highest level since the Great Depression. The big question going forward is how many of these job losses will become permanent. The BLS commented on the topic: “The number of unemployed persons who reported being on temporary layoff increased about ten-fold to 18.1M in April. The number of permanent job losers increased by 544,000 to 2.0M.”
The employment to population ratio fell by 8.7% to 51.3%, which is the lowest rate since at least 1948 when records were first kept by the BLS.
The U6 unemployment rate rose to 22.8% from 8.7%. The 14.1% increase in the U6, was much more than the 10.3% increase in the often quoted U3 rate. The U6 is those included in the U3, plus discouraged workers no longer seeking jobs and part-time workers seeking full-time employment.
The average hourly earnings data is skewed as the majority of those getting laid off are lower paid employees. The labor force participation rate fell to the same levels of 1973.
To put some context around Friday’s jobs data, aggregate job losses from the last nine recessions, dating back to 1958, total 20.5 million jobs. Also, consider that two months ago we had the lowest unemployment rate in over 50 years and today we have the highest rate in over 80 years.
After the jobs report, the Atlanta Fed released its revised annualized GDP forecast as follows: “The GDPNow model estimate for real GDP growth (seasonally adjusted annual rate) in the second quarter of 2020 is -34.9 percent on May 8, down from -17.6 percent on May 5. After this morning’s releases of the employment report by the U.S. Bureau of Labor Statistics and the wholesale trade report from the U.S. Census Bureau” It is worth noting the number is scarier than it looks. For one, it is annualized. Secondly, it assumes that May and June will be like April. Odds are they should improve as the economy opens up.
These times are truly unprecedented indeed! Data covering quarterly earnings calls from large corporations shows the word “unprecedented” is being used to describe business conditions about 50% more often than during the Financial Crisis of 2008/09. As we wrote last week in Extraordinarily Uncertain Indeed, those in the media and on social media with predictions of a “V” shaped recovery and a prompt return to normal, are clearly not recognizing the unprecedented nature of what is occurring. While we certainly hope they are correct, we must also prepare for a wide range of potential outcomes. Managing wealth is not about hope, it is about properly assessing risk, especially in times like these.
May 8, 2020
Initial Jobless Claims rose by 3.169 million last week down from 3.846 million in the prior week. Continuing claims are now 22.6 million, which is over three times the 6.6 million peak of the previous recession.
As shown below, in aggregate consumers paid down their credit cards at an unprecedented rate last month. There is $1.066 trillion of revolving consumer debt, so even though the net amount of the paydown is large, it is still a rather small percentage of the debt outstanding.
December 2020 Fed Funds futures contracts and those further out in maturity, fell below zero yesterday. The market is implying the Fed reduces rates into negative territory by yearend and stays at or below zero until the spring of 2022.
Despite the eye-popping equity rally of the last month or so, investor sentiment remains extremely bearish. As shown below, those that characterize themselves as bearish are now at the highest level since 2013. The percentage of investors considering themselves bullish remains at the lows for the year, but, unlike bearish sentiment, is not quite at extreme levels. Taken on its own, this survey paints a bullish picture for the weeks ahead.
The Turkish Lira has been depreciating rapidly versus the U.S. dollar over the last few weeks, pointing to an acute dollar shortage in Turkey. On Thursday, Turkey banned three large international banks from partaking in currency transactions in a bid to slow the depreciation. The Fed has yet to offer Turkey currency swap lines to help alleviate the situation. Likely, any relief from the Fed will be in coordination with some sort of political favor from Turkey. The graph below shows the long term depreciation of the Lira and the recent collapse. Turkey’s situation is just another example of a second order effect that is difficult to predict, but carries with it the potential to create meaningful economic and geopolitical impacts.
May 7, 2020
The ADP report was slightly worse than expected, showing a loss of 20,236,000 jobs in April. Over six million of the losses came from small businesses that employ less than 50 people. Further data on job losses by industry and company size is found HERE. The million dollar question going forward is how many of these job losses become permanent.
Our model is forecasting a loss of 18,125,000 jobs in Friday’s jobs report.
Yesterday we highlighted that Treasury yields are backing up do to supply. A reader asked us if they may also be rising in sympathy with inflation concerns. The graph below shows that implied inflation expectations, calculated from nominal and inflation-protected Treasury yields, show no indication of a recent change in inflation expectations. Again, this move seems to be corporate and U.S. Treasury supply related.
To wit, the U.S. Treasury announced that the amount of debt outstanding rose by $1 trillion last month to over $25 trillion outstanding. The Federal debt to GDP ratio shot higher to 117% from 106% at the end of 2019. Given the stimulus spending plans for the remainder of the year and the inevitable decline in GDP, this ratio will continue to higher.
Since April 20th, the front month Crude Oil futures contract traded as low as -$40 per barrel and recently has risen to over $25. As we have discussed, this massive price volatility of the front contract(s) are largely the result of excessive supply, weak demand, and a lack of storage facilities. Without sufficient storage, producers must dump oil on the market and accept whatever price can be had.
On April 22nd, we shared the first graph below to highlight the divergence between the front month contract and longer term contracts. It is updated as of May 6th to show that the spread remains wide but is back to more normal levels. The second graph below shows how the price of each monthly contract has changed since April 20th. All of the price improvement in the crude oil complex is occurring in the first three contracts. In fact, prices have declined slightly for months five and six over the period. If the storage problem is solved, the curve should remain relatively flat. If not, expect the front month contracts to fall victim again to extreme volatility. From an economic and investment perspective, we should primarily focus on the out month contracts for a truer economic price of oil.
May 6, 2020
Upward pressure on Treasury bond yields in recent days is partially attributable to “rate locking” for expected corporate debt issuance. Banks and Broker/Dealers, on behalf of corporate issuers, will short U.S. Treasury securities to help lock in an interest rate for upcoming bond issuance. This week alone, we have seen Apple ($8.5bn), Amgen ($4bn), Starbucks ($3bn), Altria ($2bn), Schlumberger ($1.5bn), and Kraft Heinz ($1.35bn) come to market with large issuance. When the deals price and the hedges are lifted (shorts covered), bonds may see improvement, all else being equal.
In an interesting twist of events, Germany’s constitutional court in Karlsruhe, found that the EU overstepped its powers when it backed the legality of the ECB’s QE operations. The court is giving the ECB three months to change the rules of operation.
The most important data point of the week will be Friday’s BLS jobs report. The stunning consensus estimate for job losses and the unemployment rate, as well as the extremely wide band of estimates, are shown below. As a point of reference, the highest unemployment rate since 1948 was 10.8% in 1982, and the largest monthly drop in non-farm payrolls was 1.959 million, right after WWII. This morning’s ADP report is expected to show a 20 million decline in jobs last month, somewhat in line with expectations for Friday.
The good news is that the latest data from the TSA shows that air travel is slowly improving. The bad news is that air travel is still well below 90% of normal.
May 5, 2020
President Trump is ratcheting up pressure on China as a result of the economic fallout from the virus. For now, they are just words, but outside of the Corona Virus and its economic impact, his words and possible actions may be the most critical geopolitical factors to follow. Per Fox Business Network- MNUCHIN SAYS HE EXPECTS CHINA TO MAKE GOOD ON ITS TRADE AGREEMENT WITH U.S., WILL BE VERY SIGNIFICANT CONSEQUENCES IF THEY DON’T.
Accordingly, we will closely watch the Chinese Yuan versus the dollar to see if the Chinese are depreciating their currency. If so, it means they are taking action to cheapen their exports and at the same time make the import of U.S. goods more expensive. Currently, the yuan sits at 7.06 per dollar. It is widely believed part of the original trade agreement involves China keeping the yuan at 7 or lower. A move above 7.10-7.15 would be concerning.
Much was made of the annual Berkshire Hathaway (BRK/A) annual meeting this past weekend. To summarize, Warren Buffet is very concerned about the markets and economy. Of particular note, he sold his entire holdings of U.S. airlines. BRK/A is sitting on at least $128 billion in cash. His actions are a clear indication that one of history’s most astute investors is not buying into the recent rally.
Employee withholding federal tax receipts were down 14.61% in April. That provides a rough indication of what this Friday’s employment report may look like.
The following LINK from TD Securities provides a comprehensive listing of all of the fiscal and monetary measures being taken by the G10 countries.
The biggest question for investors is when economy will open up and, once opened, how quickly will economic activity returns to normal. The graph below provides some guidance in that regard. Per Open Table reservation data, people had sharply cut back on eating out a week or so before mandated so by state lockdowns and closures. We suspect that regardless of state actions to open commerce, consumers will be slow to resume normal activities. This is undoubtedly due to a fear of catching the virus but also increasingly a result of reduced economic means.
If you are an investor of REITs or considering buying into the REIT sector, the chart below provides some guidance as to how various real estate sectors are faring.
May 4, 2020
The Fed will slow its balance sheet growth further in the coming week to $40 billion. Last week, the Fed’s balance sheet grew by $83 billion (Wednesday to Wednesday), continuing the trend downwards in recent weeks. In the week prior to last week, the balance sheet grew by $206 billion, which is also down significantly from the $557 billion growth for the week ending March 1. Make no mistake, they are still very aggressive, buying $5 billion per day, but it is now more comparable to prior QE.
The Citi Economic Surprise Index fell to an all-time low. This index measures the divergence between the consensus of economists estimates for incoming economic data versus the data itself. A negative number, as it stands today, tells us that forecasts have been overly optimistic versus the actual economic conditions. In other words, economic data has been surprising to the downside. This index, like many other economic data points, is not as valuable as they were due to the inability to assess how rolling lockdowns throughout March affected economic activity. We suspect the accuracy of consensus forecasts will improve when April data is released throughout May.
Phil LeBeau of CNBC provided a first look at April economic data as follows: “April auto sales plunge 48% with April ‘20 sales rate was 8.6 Million units versus 16.52 million units last April according to the research firm AutoData”
We recently read that regulations prohibit certain types of foods that are destined for restaurants to be sold in supermarkets. Like we have written about meat, pork, and poultry, the amount of food is not necessarily a problem, but the ability to get the food to our supermarkets is a big problem. A lot of food is being wasted due to numerous constraints.
According to Neilsen: In the past week, prices have risen for fresh meat by 8%, eggs by 31%, cheese by 11% and cow milk by 10% versus this time last year. The graph below from Neilsen provides an interesting perspective on how our dining habits have radically changed since Covid19. Follow @nielsen on Twitter for many other unique consumer statistics.
May 1, 2020
Initial Jobless Claims rose by 3.839 million, down from 4.442 million last week, but still running at over five times the prior weekly record (1982 -680k). To put the data into a more modern context, the high point in the 2008/09 crisis was in March of 2009 at 661k.
The Personal Savings Rate surged to 13.1% from 8.4%. The predominant driver is a lack of consumption and therefore, “forced” savings. The rate is the highest since the early 1980s, however, at that time, there was incentive to save with interest rates over 10%.
The Fed expanded the scope and eligibility of its Main Street Lending Program (LINK) to include riskier firms with higher levels of debt. This program involves the Fed and Treasury lending up to $600 billion to small and medium-sized businesses. Like other Fed/Treasury programs, this one is set up as an SPV. The Treasury puts up the initial funding for the vehicle and retains a small percentage of default risk. The Fed then leverages the Treasury’s funding up to ten times and retains the remainder of the risk.
J. Crew will file for bankruptcy this weekend. In its wings are bankruptcy rumors from fellow retailers, The Gap, Neiman Marcus, and JC Penny.
On Wednesday, we wrote about the inflation/deflation problem that is simultaneously resulting from the closure of meat processing plants. Today we further the discussion with two graphs showing the extreme divergence between retail beef prices (USDA) and Live Cattle prices on the Chicago Mercantile Exchange (CME). The first graph shows that Live Cattle futures are trading at ten year lows. At the same time, as shown in the second graph, wholesale beef prices spiked to ten plus year highs. High meat prices and reduced inventory should become very noticeable at your local butcher in the coming days and weeks. In theory, prices should converge as the supply of cattle will decline when processing plants re-open and some animals are culled. At the same time, demand will drop due to higher retail prices. However, like negative oil prices, who knows what this market oddity will bring us.
April 30, 2020
Yesterday’s FOMC statement (LINK) is essentially a pledge to keep the Fed Funds rate at zero, maintain QE to “support smooth market functioning“, and support/provide other stimulus as needed until the economy is back on track to achieve the Fed’s price and employment goals. Based on the fact that there were no dissenting votes, it appears the idea of cutting rates into negative territory was not seriously discussed. The Fed did not provide forward guidance as they typically do, but based on the following statement they are not on board the “V” shaped recovery bandwagon: “The ongoing public health crisis will weigh heavily on economic activity, employment, and inflation in the near term, and poses considerable risks to the economic outlook over the medium term.”
A few takeaways from Chairman Powell’s press conference:
SPV programs that buy corporate and municipal credit are unlimited in size.
He reiterated that they would use their tools “forcibly and confidently” until the U.S. is on the road to recovery.
He mentioned risks to the outlook that the Fed is keyed on. 1) The spreading of the virus, new outbreaks, and the development of vaccines and drugs. 2) Lasting damage to the productive capacity due to extended unemployment and small and medium-sized business failures. 3) “global dimension” – how global economic activity affects the U.S. economy.
“We are going to see data for Q2 that’s worse than anything we’ve seen“
He seems to believe that inflation is guided by inflation expectations. As long as inflation expectations remain anchored, he does not expect to see deflation.
“We won’t run out of money.”
First Quarter Real GDP was worse than expected at -4.8%. The slowdown was led by a sharper than expected 7.6% decline in consumer spending, the largest drop in 40 years. Consumer spending was only expected to fall by 1.5%. Bear in mind, the GDP report only captured a few weeks of the shutdowns, with over two-thirds of the reporting period having occurred during a relatively healthy economic environment. Interestingly, the price index was stable from last month at 1.3%.
GDP data will likely be revised significantly in the coming months and even years, as we have seen with prior recessions. Page 8 of the GDP report (LINK) provides the contribution of the components making up GDP. The graph below shows the breakdown by major sector groupings.
Despite the GDP data, stocks surged on optimism from Gilead that its Remdesivir Corona Virus treatment showed positive results. Dr. Fauci also spoke with optimism-“what it has proven is that a drug can block this virus … This drug happens to be blocking an enzyme that the virus uses.“
Jobless Claims will be released at 8:30 with expectations of 3.5 million new claims being filed. Chicago PMI will also be released with a consensus of 37.9 and wide range of estimates from 29.8 to 42. National PMI and ISM manufacturing surveys will follow on Friday. All of these corporate surveys, which used to provide economists dependable forward guidance, will be impossible to make sense of. Investors and economists will likely put little weight on their results.
April 29, 2020
GDP will be released at 8:30. The consensus expectation is for a decline of 3.7% ,with estimates ranging from 0 to -10%. The Fed will release the minutes from its FOMC meeting at 2:00 and follow up with Jerome Powell’s press conference at 2:30. Fed Funds futures are priced at 8bps, implying an 18% chance rates are cut into negative territory. The Fed Funds curve is flat through at least October 2021, meaning there are no additional expectations for further decreases or any increases for a long while.
As expected, Consumer Confidence fell sharply in April to 86.9, down from 120 in March. The drop was led by the present conditions sub-component, which fell from 164 to 76.4.
On CNBC’s Squawk Box Treasury Security Mnuchin stated “I would say that’s highly unlikely” in regards to the Fed buying stocks. We have little doubt this statement will prove false if the market tumbles back toward March lows.
In an optimistic sign of improvement in the credit markets, LIBOR spreads to Treasuries continue to compress. The current 3-month spread is 38.5bps down from nearly 100bps. LIBOR indicates the rate that banks can borrow from each other. The tighter the spreads, the better condition banks are in.
One of our concerns about the sustainability of the current equity rally is the two week divergence between junk bonds and stocks. When the Fed announced they will buy junk-rated debt, the popular junk ETF (HYG), spiked higher. However, since then, it has retraced all of the gains. Over the same period, the S&P 500 has continued to grind higher. The correlation between junk bonds and stocks tend to be strong over time, so this divergence bears watching closely.
The most common theme from earnings announcements this quarter has been the withdraw of 2020 forecasts and guidance. Making sense of Q1 earnings is already a difficult task, but trying to assess how the virus will impact certain companies in the coming quarters is now nearly impossible without the qualitative and quantitative input from corporate executives.
Tesla’s valuation summed up in one picture- (TTM Rev. = Trailing 12 months of revenue)
April 28, 2020
This week will be important for corporate earnings. Some of the more important corporate earnings announcements by day are as follows:
Tuesday- Pfizer, Merck, 3M, Google, Caterpillar, and Pepsi
Wednesday- Boeing, Humana, Tesla, Facebook, Microsoft, and MasterCard
Thursday- American Airlines, Apple, Twitter, McDonalds, Amazon, Visa, and United
Friday- Exxon, Chevron, Clorox, and Honeywell
Given the record concentration of the five largest stocks in the S&P 500, all of which report this week, earnings may amplify volatility in the markets. Potentially further stoking volatility will be the Fed’s FOMC meeting statement and Powell’s press conference on Wednesday, along with GDP also being released on Wednesday.
Diamond Offshore (DO), a large offshore oil driller, filed for bankruptcy protection over the weekend. Continental Resources (CLR), the largest shale producer in the Bakken region is shutting in most of its production. CLR was producing over 200k barrels per day. Headlines like these will likely become more common as many small to mid-size energy producers are unprofitable at current oil prices and saddled with tremendous debt loads. As we discussed last week, there will be a lot of assets for sale at deep discounts, and the larger energy companies with strong balance sheets, diversified products, and the ability to withstand sub $20 oil prices for a while will benefit.
Crude oil fell almost $4 a barrel or 23%. Continued fears about a lack of storage and overproduction continue to haunt the price.
GM will suspend dividends and cancel buybacks. Delta Airlines is suspending contributions to it pension fund. Boeing’s CEO said it would take “years” before they start paying dividends again. Headlines like these will be common themes going forward as companies take necessary action to preserve cash. It is worth considering that reinvested dividends and share buybacks were the key drivers of stock prices for the last decade.
Fox News said that a negative payroll tax is on the table. Negative interest rates, oil prices, and now possibly taxes. Economics is being turned on its head.
The Fed expanded its $500 billion municipal lending facility to include smaller cities and counties. Click this LINK for the press release.
April 27, 2020
The Fed will further reduce QE purchases this week to $10 billion per day, down from $15 billion last week.
On Tuesday and Wednesday, the Fed will conduct their regularly scheduled monetary policy meeting. The market is not expecting much in terms of additional actions. Still it is worth noting that ex-Fed President Kocherlakta penned an editorial urging the Fed to consider dropping rates into negative territory at this week’s meeting. The BLS employment number will not be out until next Friday, but the Fed will have a decent estimate of that much anticipated number and may opine on it.
Also, GDP will be released on Wednesday. The current estimate is for a 3.3% decline. Q1 has the potential to vary significantly from the estimate as various local and state lockdowns occurred at different times throughout March. We also have to consider that economic activity in February and March was boosted by corporate and consumer stockpiling.
One of last week’s themes in the daily commentary was the extraordinary oil price volatility resulting from the supply/demand imbalance. Today we shift focus to meat products that are facing an odd set of supply/demand imbalances. Per a Bloomberg article, “about a quarter of American pork production and 10% of beef output has now been shuttered.” The closures are due to employees and meat inspectors that have contracted the corona virus and the risks to other employees. The article states that 100 USDA inspectors have tested positive for the virus and at least one inspector has died. These inspectors travel from plant to plant and can quickly spread the virus. Since the processing plants are closing, the growing supply of animals is also becoming a problem. The article notes, “Minnesota farmers may have to kill 200,000 pigs in the next few weeks.” There also reports that 2 million chickens are being “depopulated” in Maryland and Delaware.
As a result of supply chain impediments, the prices of certain finished meat goods may rise sharply at grocery stores and restaurants while the prices of raw products in the futures market trade near the lows of the year. Essentially, there is downstream inflation for consumers of processed meat products and, at the same time, deflation for farmers selling the animals. You can track futures pricing for cattle, hogs, and a host of other commodities at Finviz.com. Supply chains around the world are fracturing and resulting in imbalances that can be inflationary, deflationary, or both.
The graph below shows that the annualized number of new fracking operations in the Permian, Eagle Ford, and Bakken basins has fallen by about 75%. Today, the lack of demand is dwarfing the supply cuts, but as the economy recovers production cuts, coupled with increased demand should provide a substantial boost to the price of oil.
Per Bloomberg News- “U.S. homeowners seeking to delay mortgage payments topped 3.4 million, up 17% from a week earlier, according to Black Knight. About 6.4% of mortgage borrowers have entered forbearance.”
April 24, 2020
Initial Jobless Claims rose by 4.427mm, bringing the total for the last five weeks to 26.5mm. The unprecedented nature of job losses is shown below.
The ECB joined the Fed and will now purchase junk-rated corporate debt under certain conditions. Rumor has it the ECB will also accept junk-rated debt as collateral for loans to banks. The BOJ joined the party by removing limits on the amount they can buy under existing QE programs. Further, they will double their purchases of corporate debt.
Yesterday we added positions in Exxon (XOM), Chevron (CVX), and the SPDR Energy ETF (XLE) to our portfolios. We believed the companies offered significant value before the crisis and offer even more today despite the sell-off in oil. Based on our discounted cash flow model for XOM and CVX, we think that both stocks are about 25% undervalued. The model assumes very conservative earnings projections for the next three years and a low earnings growth rate thereafter. In addition to trading at a good discount, we think their strong balance sheets put these companies in a prime position to purchase sharply discounted energy assets in the months ahead. These stocks and the sector will be volatile for a while, but our intention is to add to these positions in the future and potentially hold them for a long time.
The graph below shows that the stimulus checks to individuals will have limited economic stimulative benefits. Over 50% of the funds will go towards savings or paying down debt. Typically a much higher portion would go towards expenditures and contribute to economic activity.
Throughout the week we have written about the massive imbalance in the supply and demand for oil and how it is killing oil prices. Now we take a macroeconomic view and consider how weakened demand for oil might affect U.S. GDP. To quantify the relationship, we share two graphs below. The first one is a scatter plot, with each dot representing the annual intersection of the change in economic activity with the change in energy consumption (data since 1977). As shown, the relationship is statistically solid with an R-squared of .55. The next graph compares GDP to a forecast based on the regression analysis from the scatter plot. Again, it visually shows the strong relationship between the two factors.
Based on the analysis above, if we assume total energy consumption will be down 25% for the entire year, then the estimated annual GDP should decline by 8.68% for 2020.
April 23, 2020
Jobless Claims will be released at 8:30. The current estimate is for 4.250mm new claims, a decline from 5.245mm last week. On Friday, the University of Michigan will release its revision to last week’s April Consumer Sentiment reading. Last week the index was 71.0 down from 89.1 in March and 97.2 in April of 2019. The current estimate is 68.0.
Per Lisa Abramowicz/Bloomberg- “Total hedge fund capital fell by $366 billion in Q1 to $2.96 trillion, falling below $3 trillion for the first time since 2016: HFR data. Investor outflows totaled about $33 billion in Q1, the 4th largest in industry history & the biggest quarterly outflow since 2009.”
Congress approved an additional $320bn allotment for PPP loans for small businesses. Given the backlog of requests, it is widely expected the funds will be exhausted by the weekend.
It is troubling to think about, but with the price of oil so low, we must consider the possibility of conflict in the Middle East as a way to help boost prices. To that end, President Trump tweeted the following: “I have instructed the United States Navy to shoot down and destroy any and all Iranian gunboats if they harass our ships at sea.”Iran followed up with a call to the U.S. to “remove forces from the region and end bullying.” Given the recent volatility in oil it is hard to pin the exchange of barbs for yesterday’s 21% gain in crude oil. Crude oil is up another 10% this morning to $15.30.
According to FactSet, Q1 S&P 500 profit margins are expected to decline to 9.4%, which is about 2% lower than the running rate of 2019. It is also the lowest level in over four years. Given the economic headwinds that will emerge after this crisis, we must now consider that lower profit margins may not be a crisis-related, one-off instance, but a trend. Supply lines have been damaged, and in some cases, those changes are permanent. We believe that many countries will become less dependent on China as the lowest-cost producer. Having witnessed economic vulnerabilities, they will likely mandate that a larger percentage of domestic production for goods deemed essential. Globalization improved margins in the past and de-globalization will deduct from margins in the future.
Second, given the unprecedented monetary and fiscal efforts of the central banks and governments, inflation is a distinct possibility in the future. Will corporations be able to pass on higher costs to consumers? The answer to the question is clouded by what will likely be a slow recovery in employment, wages, and hours worked. Add to the equation, more debt at the federal, municipal, corporate, and consumer level, which will further impede consumption. These considerations will no doubt play a role in the way we assess stocks for our portfolios.
April 22, 2020
With the May crude oil contract now expired, June becomes the new front month contract. Unfortunately, June is following in May’s path. The June contract fell 36% to $12.90. Unlike Monday, where the energy complex, as a whole, held up much better than the front crude contract, yesterday’s bearish action was much more encompassing. Brent Crude Oil was down 22%, gasoline down 20%, and heating oil down 16%. The commodity complex also got hit hard, as most metals, precious metals, meats, and grains were lower. As shown below, the Thompson Reuters CRB commodity index was down over 10% yesterday and has fallen 55% year to date. Over the last week, the ten-year breakeven implied inflation rate is 0.35% lower to 0.94%, in sympathy with commodity prices.
Based on our discussion of oil spot and futures prices in yesterday’s commentary, we provide some context to the historical spreads. The graph below compares the rolling front month contract (within 30 days of expiration) to the rolling 3 month and 6 month future contracts. The contracts that expire 3 and 6 months from today are priced about $20 more per barrel than the front contract. Typically they are within $5 of each other.
The graph shows that at times the futures contracts trade above the current price of oil and other times below it. In futures trading parlance, the difference is called contango when the future price is higher than the current price and backwardation when the current price is higher than the futures prices. There is no question, given the current instance of severe contango (current prices < futures prices), that the demand and supply for oil are grossly misaligned.
USO, the largest crude oil ETF, with $2.6 billion of assets, has seen its shares fall precipitously with the price of oil. It has been estimated that the ETF owns approximately a quarter to a third of the open interest in June crude oil contracts. If the ETF were forced to unwind, as we have witnessed with other ETFs during bouts of severe volatility, the fund’s managers would likely have to sell those contracts, which would add further pressure to oil prices in the short run.
China experienced the virus and the shutdown months before the U.S. was stricken. As such, we can see how effectively China is “opening up.” The graph below tracks auto traffic congestion in Beijing. The general takeaway is that traffic is back to normal for the morning weekday commute, but the afternoon commute is not as congested. This is probably the result of people working less than a full day. Second, as highlighted in yellow and evident on the weekend days, there is no congestion outside of workers commuting to and from their jobs. Until there is a viable treatment or vaccine, we think similar patterns will play out in the U.S. and Europe. Workers will return to work if possible, but most people will avoid non-essential activities. Such behaviors bode poorly for travel, retail, food, and the entertainment industries. To that end, Bloomberg posted an article titled-“Wuhan’s 11 Million People Are Free to Dine Out. Yet They Aren’t.“
April 21, 2020
The Chicago Fed National Activity Index fell to -4.19, which is near the lows of 2008. The only difference is that in 2008 the index deteriorated for more than a year until it reached its trough. This time the decline took one month. The 85 economic indicators that comprise the index are computed as a standard deviation from the norm. A four standard deviation event, as it now registers, should occur once every 83 years!
Spot oil, oil for delivery in May, plummeted to an intra-day low of -$40 a barrel on Monday, yes negative! We thought the price action was so unbelievable that we provided a picture below of oil from 2:30pm, when it was trading at -$13.98.
At the same time, next month’s oil contract, for settlement in late May and delivery in June, traded down 15% to $21.09 per barrel. This morning the June contract is down a further 20% to $16.40. We received many questions voicing confusion about which is the “real” price of oil. To help answer the questions, we share an article we presented last week which discussed the difference between the S&P 500 and S&P 500 futures –How To Use S&P 500 Futures to Indicate the Market Open.
As defined in the article, cash and carry is equally applicable to the oil market. The difference between today’s oil price and the price of oil in the future, is a function of the amount of time, borrowing costs, delivery costs, and, most importantly today, storage costs. The big difference between the S&P and oil is that holding the S&P benefits the holder with dividend income, whereas holding oil results in a storage cost. Currently, the lack of demand and overproduction of oil has filled up storage facilities. With no storage remaining, producers are now being forced to have to pay someone to take their oil. You can find the price of the monthly crude oil futures at the CME. For more on the storage problem, Reuters had an informative piece out yesterday on the glut of oil stored at sea- LINK
Please note we have removed the Chart of the Day. Recently, we have been adding pertinent/timely charts to the Daily Dashboard and will continue to do so going forward. The Chart of the Day has been replaced with News about your portfolio holdings and alerts, which you can set for your portfolio holdings. The alerts, when triggered, will send you an email alert.
April 20, 2020
The Conference Board’s Leading Economic Indicators plummeted from -.2% in February to -6.7% in March. That was by far the largest decline in the index’s 60-year history. The biggest reason for the deterioration was the recent surge of initial jobless claims.
The Fed continues to slow down the pace of QE. On Friday, they further reduced the daily pace of purchases to $15 bn, down from $30 bn in the prior week, and $75 bn at the peak. Even at $15bn per day, the pace of purchases is still larger than the peak pacing of QE1. Given the massive issuance expected by the Treasury, we will closely follow yields on longer duration Treasury bonds to see if these reductions have a negative effect on yields.
Per Barry Diller on CNBC– “At Expedia we spend $5B a year on advertising. We won’t spend $1B in advertising probably this year. You just rip that across everything. There you are.” Facebook, Google, and a host of other social media outfits are advertising companies. To wit, we wrote the following two years ago- “Facebook (FB) and Google (GOOG), two of the hottest tech stocks in the market, are simply advertising companies. Based on current financial reports, 95% and 88% of revenue from FB and GOOG respectively come from advertising. These companies and others like them are the new Mad Men.” While there may be more eyes on the sites and users as everyone is bored at home, Diller makes it clear that profits from advertising for the social media sector could be cut significantly.
The graph below shows the ratio of the financial sector (XLF) to the S&P 500 (SPY). XLF is grossly underperforming the market, and, the ratio is hitting new lows despite the broader markets run higher. This underperformance is occurring despite the Fed providing the sector with massive liquidity and quite frankly generous handouts. During the last financial crisis, the ratio fell from .21 in 2007 to a low of .07 in March of 2009. It was at the ratio’s lowest point when the broad market finally bottomed and turned upward. The global economic model is massively dependent on growing debt levels and banks to issue and administer debt. This is what makes XLF a sector to watch to assess macroeconomic conditions.
April 17, 2020
China’s Q1 GDP declined 6.8% year over year. Considering China was afflicted with the virus and related economic shutdowns throughout the quarter, the GDP official number is likely better than reality.
Jobless Claims rose by 5.245 million people through April 11th, bringing the four week total to over 22 million. The prior record for cumulative claims over a four week period was 2.6 million in 1982. All of the new jobs created since the last recession have now been erased.
The point in sharing horrific data and putting it in historical context is to help you understand that the structural damage being done, even if somewhat temporary, is unprecedented. Recovery in a “V” shaped fashion, as the media and Wall Street are hyping, is nice to think about, but is it really possible?
The following comes from frequent RIA author Mish Shedlock:
More than 1 million people – over a quarter of Michigan’s workforce – have filed for unemployment during the COVID-19 pandemic, the state’s top labor official said Monday.
Last week, Michigan reported more than 828,800 unemployment claims filed in the state from March 8 to April 4. Michigan’s pre-coronavirus record for new unemployment claims occurred during the Great Recession in January 2009, when there were 77,000 claims in a week.
Keep in mind that Michigan was hit hard during the 2008/09 recession as GM and Chrysler filed for bankruptcy and Ford was close.
Conoco is slashing North American output and further reducing capital spending. Per Reuters, “North American oil producers have so far announced 550k in production cuts for the year.” That number will undoubtedly grow over the coming weeks. In the long run production cuts and reduced capital spending are bullish for oil prices. However, in the short run, the massive drop in demand is thwarting efforts to stabilize the balance between supply and demand and, ultimately prices.
On CNN, Los Angeles mayor Eric Garcetti said it is likely that he will not allow any concerts, sporting events, or anything where thousands of people gather, until 2021
The graph below shows Moody’s default rates on high yield corporate debt (junk) as well as a range of forecasts for default rates next year. Despite the Fed’s actions to help the sector, Moody’s believes that defaults will be on par with those of the last recession. The Fed’s corporate bond buying operations have driven spreads, that in most cases, are not commensurate with the risk. Buyer beware!!
We are not sure how reliable data going back over 300 years is, but the graph below is stunning none the less.
April 16, 2020
March Retail Sales fell 8.7% versus expectations for a 7.3% decline. The monthly decline is more than twice the worst monthly change during the 2008/09 recession (-4.0%). This is even worse considering the full brunt of the shutdowns did not occur until the second and third week of March in many places. The hardest hit sectors and their changes versus March 2019 are as follows:
Clothing/Accessories -50.7%
Furniture -24.6%
Department Stores -23.9%
Restaurants/Bars -23%
On the positive side, grocery stores saw sales grew by 29.3% and non-store retailers registered a gain of 9.7%.
The Empire Manufacturing Survey (New York State) fell to -78.2, a stunning reading as it is more than double the lowest reading at the trough of the 2008 recession.
Today’s Chart of the Day highlights the strong correlation between inflation expectations and the price of oil. Note that in recent days the price of oil has fallen sharply while inflation expectations are still on the rise. If oil continues to trade near recent lows, there is a good chance that inflation expectations will decline and re-correlate with oil. This was another factor in our decision to temporarily sell our holdings of inflation protected bonds.
One of our recent points of discussion is the probability that the current liquidity crisis morphs into a solvency crisis. Per Atlanta Fed President Bostic via Reuters, we are not only one with this concern- “Bostic- BUSINESS CONTACTS TELLING HIM THAT MAY IS “LOOMING” AS A MONTH WHERE LIQUIDITY PROBLEMS COULD EVOLVE INTO SOLVENCY PROBLEMS.”
In case you missed it, Lance and Michael explained the difference between liquidity and solvency in the Real Investment Show from April 9th. Click HERE to watch.
The graph below shows how the virus has impacted revenue for small businesses. Some of these businesses will qualify for PPP loans and hopefully weather the storm. Many others can not or will not apply for the loans. Small business accounts for about two-thirds of employment and consumer spending accounts for nearly 70% of GDP. As you consider media and Wall Street forecasts for a “V” shaped economic recovery and a swift return to normalcy once shutdowns are lifted, just consider the damage already done to individuals and small businesses. Currently, the PPP program is set to run out of funds with the next day or two. Negotiations in Congress are ongoing to increase funding for the program.
April 15, 2020
Two weeks ago crude oil bottomed at just below $20 a barrel and then proceeded to climb nearly 50% to just shy of $30. The risk-on markets followed suit, especially those assets that were hardest hit in the prior few weeks. Oil prices, despite a huge reduction in production from OPEC, have now completely given up the entire gain of the last two weeks. Oil stocks which have risen in equally impressive fashion have thus far held onto their gains. The recent divergence between oil stocks and oil, as well as between oil and the risk markets in general bears paying attention to.
JP Morgan (JPM) released its Q1 earnings yesterday. Of note, they built loss reserves by $6.8bn in the prior quarter, which equates to $1.66 per share. The amount of new reserves brings total reserves close to the $8.29bn that they now have provisioned for credit losses. This amount, which will surely grow, is just shy of their peak provisions from the financial crisis ($8.6bn). Building reserves brought their EPS down to 78 cents and well below the estimate. We expect all banks to aggressively build reserves in the first quarter and more in the second quarter. JPM released the table below showing various financial factors that greatly affect their financial statement. This table also provides us a glimpse of what is happening to the economy and the credit markets.
Yesterday we sold our 5% holding of STIP. We originally bought the security because we thought future inflation rates, implied by inflation-protected securities, were too low, as shown below. Since then, implied inflation rates have risen sharply. We still harbor concerns that the monetary stimulus being supplied by the Fed is inflationary in the long run, but in the meantime, we think implied inflation is back to close to fair value. We also would not rule out another decline in expectations if the market falls again signaling weaker economic activity and another burst of deflationary pressures.
Annie Lowery of The Atlantic published a stunning article entitled Millennials Don’t Stand a Chance. The article highlights how the economic downturn is impacting the millennial generation. She writes: “In a new report, Data for Progress found that a staggering 52 percent of people under the age of 45 have lost a job, been put on leave, or had their hours reduced due to the pandemic, compared with 26 percent of people over the age of 45. Nearly half said that the cash payments the federal government is sending to lower- and middle-income individuals would cover just a week or two of expenses, compared with a third of older adults. This means skipped meals, scuppered start-ups, and lost homes. It means Great Depression–type precarity for prime-age workers in the richest country on earth.”
A link to her source for the article, Data For Progress, can be found in the article. The link has stunning graphs showing how the impact of the virus is affecting different demographic groupings.
April 14, 2020
The mayor of Vancouver Canada projects that the city will lose nearly $200 million in tax revenue and claims it is “at risk of going bankrupt.” He stated that approximately one in four homeowners are unable to pay their property taxes. What Vancouver is experiencing is likely being felt by almost all municipalities in the U.S. and many other nations. We have little doubt that the national governments and central banks will add to their stimulus packages to help these municipalities/local governments avoid bankruptcy, but municipal spending on non-essential items will be sharply curtailed. As an example, from the Washington Post- Maryland Governor Larry Hogan “froze all non-coronavirus state spending after a new analysis shows the pandemic could reduce the state’s tax revenue by $2.8 billion over the next three months.”
First quarter earnings releases will start up in earnest this week, with the bulk of the reports coming from the banking and airline sectors. Today’s highlights will be JPM, Wells Fargo, United Airlines, and J&J. Bank earnings will be especially unpredictable as they are likely to add significantly to their loss reserves in advance of Q2 and Q3 credit losses. On the economic data front retail sales, will be released Wednesday and are currently expected to decline 7%. Like many March reports, this one will be tough to decipher and may vary widely from expectations. Of interest will be the breakdown of sales across the various industries. Jobless Claims will be released Thursday, with an additional 5.5 million expected to join the ranks of the unemployed. If there is a silver lining, it is that if the expectations hold, it would be the second straight decline in the number of new unemployment filings.
President Trump is claiming that OPEC may come back to the negotiating table and further cut production to 20mm barrels a day from the just negotiated 9.7mm reduction. Also helping to stabilize the price of oil are discussions that many countries will soon fill their emergency oil reserves. Countering those actions, it is estimated that the demand destruction from the virus is possibly as high as 35mm barrels a day. Oil closed slightly lower yesterday as Trump’s claims, in addition to the deal agreed to on Sunday, still fall short in the market’s eyes of what is needed.
JP Morgan announced that new mortgage originations now require a FICO credit score higher than 700 and 20% down. At a time when banks are getting bailed out and the Fed is buying debt of junk-rated corporations, JP Morgan’s ratcheting up of credit on the public will not sit well. One of our concerns is that at some point, the inequality of the stimulus and bailouts will result in political angst and protests.
The graph below shows the stunning decline in the newly introduced New York Fed Weekly Economic Indicator. Index components are found in the fine print.
April 13, 2020
The UK is the first large country to officially embrace MMT, even if only “temporary and short term.” The Bank of England (BOE) will print money to directly finance the government’s financing needs during the crisis on an as-needed basis. This move allows the government to use the BOE’s printing press to regulate the amount of debt issued. For instance, when the amount of debt issuance is determined too large for the market to digest in an orderly fashion, the BOE will supply the excess funds to the government. While such a plan may sound prudent, the consequence, if enough money is printed, will be a surge in inflation. The Fed and other central banks do not have the same ability to print money directly into the economy yet. They purchase assets from the market in exchange for reserves at banks. Those reserves can then be used to create money via new debt. This two-step process is not as effective, as it relies on the willingness of banks to increase their lending.
The Fed enhanced its corporate bond buying program to include newly downgraded junk-rated debt and junk-rated debt ETF’s. This enhancement doesn’t include individual bonds that were rated junk prior to March 20th, however, it indirectly includes all junk debt as they can buy junk-rated ETF’s. Click to enlarge the paragraph below from the Fed’s revised term sheet.
The full press release can be found HERE with the term sheet for corporate debt towards the bottom. Treasury Secretary Mnuchin followed the press release with a subtle reminder that the Fed buying stocks is a possibility- “MNUCHIN SAYS NO TALKS RIGHT NOW ABOUT POTENTIAL TO HAVE FED BUY STOCKS.”
Jerome Powell spoke after Thursday’s Fed actions and stated, “One thing I don’t worry about right now is inflation.” He is correct that deflation is the greater worry in the short run, but when the economy recovers, inflation will be a substantial risk unless the Fed is willing and able to reverse their crisis related actions quickly. To that end, we have some concern the Fed may not be quick enough to remove stimulus- Per Powell “Fed Will Only Pull Back Support When Economy Is Well On Its Way To Recovery.”
A stunning 6.6 million more Americans filed for unemployment claims last week, bringing continuing claims over the previous three weeks to nearly 22 million, or about 15% of the 151 million person workforce. CPI fell 0.4%, which is the first monthly decline in a decade.
As expected, OPEC finally agreed on a 9.7mm a day production cut. Crude oil is only 20 cents higher this morning after an extremely volatile last Thursday in which it spiked over 10% in the morning to $28.25 a barrel but then fell sharply to close the day at $23.54. Either the market thinks the cut is not enough given the massive decline in demand or that participating countries will not adhere to their commitments.
Over the last few weeks we have received many questions asking how S&P 500 futures trading at night or early morning determine how the market will open. To help answer these questions and provide the calculation necessary to make sense of after hours trading we provide you with the following article. CLICK TO READ IT
April 9, 2020
Jobless Claims will be released at 8:30 this morning. The current estimate is for another 5 mm people to join the approximate 10mm of newly unemployed from the prior two weeks. Also of interest, PPI will be released today and CPI tomorrow. Both inflation figures are expected to be down by 0.3%, but like all other data, the results may stray far from expectations. Jerome Powell will speak at 10 am. We suspect he will remind us once again that the Fed will do whatever it takes to stimulate the economy and stabilize the markets.
OPEC will hold an emergency meeting at 10 am. The rumor is that they will announce an output reduction of up to 10 million barrels per day. Crude oil rose over 10% and stocks zoomed higher as the rumor circulated yesterday.
Stock and bond markets will be closed on Friday for Good Friday.
The Fed released its minutes from their March 2nd and March 15th emergency Fed meetings. We share a tweet from Wall Street Journal Fed reporter Nick Timiraos that sums up the Fed’s concerns- “Wednesday’s FOMC minutes use the adverb “sharply” 18 times to describe changing economic and financial conditions. Some form of the word “deteriorate” and “severe” appears 14 and eight times, respectively.”
The VIX has steadily declined from over 75 to its current reading in the low 40s. While still very high, the reduced volatility is becoming more noticeable with daily and even hourly market gyrations having calmed down a bit.
We recently increased our exposure to gold and gold miners and bought a new position in STIP, a short term inflation-protected Treasury bond ETF. These additions are, in part, due to a growing concern we harbor that the Fed’s massive and unprecedented efforts to manage markets and minimize the economic impact of the virus will be inflationary when the economy normalizes. Because of this concern, we have been looking at commodity producers that may benefit from higher prices. In our opinion, it is still early to start buying but time to start making a shopping list. The graph below charts how various commodities have fared year to date.
April 8, 2020
Per the Mortgage Bankers Association (MBA), the percentage of mortgages not making payments (in forbearance) has risen from .25% to 2.66% as of April 1. Mark Zandi of Moody’s Analytics thinks that number could rise as high as 30%.
Moody’s recently published a list of B3 Negative and Lower (Junk or soon to be junk-rated) corporate debt ratings and it is now at its highest level. Currently, 311 companies are on the list, beating its prior peak of 291 companies from 2008 financial crisis.
Based on an FT article, dividend futures contracts imply that dividends will not return to 2019 levels until 2028. To put that into context, it only took three years for dividends to fully recover from the 2008 crisis, but nearly 20 years to get back to even after the Great Depression started.
As of Tuesday morning, Gold futures were trading about $25 above spot gold. In other words, gold purchased for settlement and delivery in the future is trading more than gold for current settlement and delivery. Such an anomaly has not occurred since 1979. This condition is very odd as banks, dealers, central banks, and investors can buy gold for spot settlement, sell the futures contract at the same time, and earn a rewarding risk-free return. The possible explanation is that physical gold is not available in enough size to obtain the risk free arbitrage. If we learn more we will pass it on.
On a positive note, New York City has admitted less Corona Virus patients than they discharged for four straight days. Today’s Chart of the Day shows that many countries are experiencing a similar drop off in cases as they pass their peak. Tempering the good news, other big cities like Washington, Chicago, and Los Angeles are concerned that they are still ramping up to their peaks.
April 7, 2020
Stocks shot out of the gates on Sunday night, added to the gains throughout Monday and again through last night. Unlike the stock rallies of last week which were based on Saudi Arabia and Russia agreeing to production cuts, this one came with a deal looking less promising and oil trading lower. Bond yields are up slightly but not as much as one would have expected given the stock rally. Also of interest, the dollar was relatively flat and gold closed above $1700, reaching an eight year high.
The Fed created another new facility. This one offers financing to the banks and other investors that own the new small business loans (PPP) guaranteed by the SBA. This will enable the banks to borrow using the loans as collateral, which should allow them further liquidity to create new PPP loans. These loans are guaranteed by the SBA. At some point, the SBA will require a bailout as many of these loans will not be paid in full. Fed Chair Powell will speak at 10 am on Thursday, presumably on a broad range of monetary policy and economic topics.
Rumors are circulating that a potential suspension or reduction of the long term capital gains tax is a possibility.
Since the market sell-off began in February, the S&P 500 has fallen nearly 900 points (through last Friday). The chart below shows that only 27% of the losses have occurred during the day trading hours, with 73% occurring during the futures overnight sessions. For most investors, the inability to manage risk during the more volatile overnight trading hours makes trading in this environment even more difficult.
The chart below shows that year to date, share prices of some of the nation’s largest department stores are down 65-75%. JC Penny (JCP) stock is trading at 27 cents a share and is on bankruptcy’s doorstep. It does not take a leap of faith to suspect that the others are not far behind if the shutdowns continue longer than are expected.
As we ponder the fate of these stores, there is an equally troubling problem to consider. Large department stores like the ones shown above are the cornerstones for malls. Through low interest rates, leverage, and insatiable investor demand for yield, shopping mall REIT’s like SPG, SKT, and TCO, developed what in hindsight may have been an excessive amount of mall square footage. Per Statista, the mall square footage per capita (23.5) in the U.S. is about 5x greater than the U.K., Italy, and Japan. The only two countries that come close to the U.S. are Canada (16.2) and Australia (11.8). Despite sharply discounted share prices, economically sensitive shopping mall REITs are leveraged and heavily reliant on shutdowns ending and a healthy consumer coming to the rescue. Needless to say, we urge extreme caution and be careful not to get fooled by double-digit dividend yields, as dividends will be reduced.
The calls for allowing the Fed the power to buy stocks got louder yesterday when Janet Yellen promoted the idea on CNBC. To wit:
“It would be a substantial change to allow the Federal Reserve to buy stock,” Yellen told CNBC’s Sara Eisen on “Squawk on the Street.” “I frankly don’t think it’s necessary at this point. I think intervention to support the credit markets is more important, but longer term it wouldn’t be a bad thing for Congress to reconsider the powers that the Fed has with respect to assets it can own.”
April 6, 2020
The employment report was much worse than expected as 701k jobs were lost and the unemployment rate rose to 4.4% from 3.9%.
Of the 701k jobs lost, over half (417k) came from the restaurant industry. It is estimated that the industry employs over 15 million people, so unfortunately, Friday’s number may have just been the tip of the iceberg. The graph below puts the losses into context with prior recession experiences.
The data used for the Friday employment report was based on surveys up to March 12th. Bloomberg says that the early consensus for the April report, which will capture the rest of March and the full impact of the economic shutdown, is around -20mm with a 15% unemployment rate. As if that forecast was not bad enough, we need to factor in that many employees that still have jobs will have their hours and salaries reduced.
As we have mentioned, the value of the dollar can tell us a lot about the acuteness of the global dollar shortage. This past week the dollar index rose about 3% and with it concerns are rising about liquidity.
Crude oil rose sharply again on Friday as it appears Russia and Saudi Arabia are discussing production cuts. Assuming those two countries can agree, a deal may be contingent on some sort of reductions to U.S. supply. Given that the government does not control U.S. oil production, nor does the government own oil companies, this seems like a tall order. Further, many shale producers are independent and not owned by the majors. That said, given the dire situation, the big oil companies may be able to come to some agreement and appease Russian and Saudi requests.
Credit Suisse announced that its once-popular 3x leveraged inverse crude oil ETF (DWTIF), which was a victim of the sharp rally in oil the last few days, will be delisted as its value went to zero on Thursday. This ETF once had over $1 billion in assets. We suspect that the SEC will outlaw 3x leveraged ETFs as they cannot stand up to extreme volatility. It would also not be surprising to see leveraged ETF’s also banned at some point.
Per The Numbers, the number one grossing movie on Thursday, March 19th was Disney’s Onward. It grossed $33,296. The Invisible Man came in second at $21,800. Since then, the situation has worsened. Total box office sales last week were only $5,179.
April 3, 2020
The number of new Jobless Claims for the past week was 6.6 million. To put that into perspective, the highest weekly claims number during the 2008 crisis was 665,000, and the total number of jobs lost during the crisis was about 9 million. Continuing claims from just last week and this week are now at 10 million.
Crude oil rose nearly 25% as China announced it would add oil to their reserves. Also helping the price are rumors that Russia and Saudi Arabia are discussing production cuts.
The Fed’s balance sheet for the week ending Wednesday increased by $586bn, which is about $30bn more than the entire QE2 operation which lasted about 8 months. Since March 4th it has risen by slightly over $1 trillion.
From April 1st through April 8th, the U.S. Treasury will issue $486 billion in new debt. Despite being only one week into April, that is half of the total for April 2019 and 75% of the issuance for all of April 2018. Stimulus spending and falling tax revenue have the potential to generate a $3-4 trillion deficit this year. There is no doubt that QE will be used to monetize this massive surge in debt.
The helpful table below from Bank America summarizes credit card spending by day and category. This is a good tool to help with stock/sector selection.
The following Tweet from David Schawel is very telling of the disillusion that many investors had going into this crisis. Over the last month, as shown below, the yield on Macy’s 4-year debt rose from 2.9% to 15%. David’s tweet and other messages of his imply that a 15% yield is too high. Instead, David should consider that the 2.9% yield that existed before the crisis was too low. Macy’s was slowly going out of business before the crisis hit. Their stock (M) fell from 52 in 2015 to 15 prior to the crisis, and it currently sits below 5. 15% is a fair yield for a company that has a good chance of filing for bankruptcy. Had Macy’s been properly priced at 8% or 10% before the crisis, the current yield would seem appropriate and may not be as shocking to most market participants.
Barbara Corcoran of CNBC’s Shark Tank was recently interviewed about the state of her small business investments. Of the over 70 small businesses/partnerships she is invested, she believes they have reduced staffing by 25-30%. More concerning, she stated that a majority of her investments will not survive. Further, all of her entrepreneurs are applying for Federal help and many of them are having trouble with the first step of the process, applying for help from the SBA. She did not seem optimistic Federal aid will help many of these companies.
April 2, 2020
The ADP Employment Report was lower by 27k jobs versus an estimated loss of 180k jobs. The report is clearly not capturing the bulk of the layoffs that have occurred over the last two weeks.
All economic data lags and some of it by up to a few months. Because of the delay, we and most other market participants are putting little stock in the current round economic data. In 2-3 weeks, corporations will begin posting Q1 results. The results will be mixed as January and February should have shown decent activity, especially for domestic companies. In most cases, we will look past the profits and losses and focus on forward guidance. Ideally, we would like to hear some optimism about a pickup of activity in Asia, as they are a month or two ahead of us in terms of dealing with the impact of the virus.
The table below shows the consensus of economist expectations for Friday’s March BLS Employment Report. Our model estimates a loss of 56k jobs. Because of current circumstances, we have no faith in our model’s predictive ability. For what its worth, Citi is predicting job losses of 10mm in the April report due out in early May. The worst monthly number during the Financial Crisis of 2008 was -800k jobs.
Financials, Real-Estate, and Utilities were the worst performing sectors yesterday as they are credit intensive industries, and despite the Fed’s efforts, there remains a lot of stress in the credit markets.
UK and European banks are canceling and/or deferring all dividends and buybacks, with some minor exceptions. Are the U.S. banks next? While many smaller banks may take those necessary steps, we believe the larger banks will stop buybacks, if they haven’t already, but will try to keep dividends intact. European banks started the crisis in a much worse financial situation, so their actions may not reflect on the domestic banks. We also think that dividends signal financial health, and in times like today they care dearly about appearances. Also consider, the Fed will do whatever it takes to avoid bank failures.
April 1, 2020
Macy’s recently furloughed 125k workers, and The Gap and Kohl’s furloughed about 80k workers each. These actions are in line with similar measures from many large retailers. At 8 am this morning, ADP will release their employment report. There is no estimate at this time. Jobless Claims will follow on Thursday (est. 4mm vs. 3.28mm last week), and the BLS jobs report on Friday. Currently, we cannot find a BLS payrolls estimate, but we will share one if we do.
It is worth noting that when an employee is laid off, they receive COBRA insurance, but in most cases will have to pay the full health insurance premium and not just the co-pay. As if losing income is not bad enough, healthcare will be an additional financial burden on many households. These and other mounting financial problems for individuals is one reason we sold Visa (V) yesterday. Unless jobs are recovered quickly, or stimulus is increased rapidly, the discretionary and financial sectors will disproportionately suffer.
The Fed has been very aggressive in their purchases of mortgage-backed securities (MBS). Over the past week, the spread, or yield difference, between MBS and comparable maturity U.S. Treasuries has shrunk from 2% to just 0.67%, which puts current coupon MBS at or near the lowest spread ever. While this is undoubtedly welcome news for those looking to refinance or buy a new home, the fact of the matter is that in many cases, the individuals’ employment situation or outlook may likely preclude them from taking either action.
The graph below shows BBB-rated corporate yields on a nominal basis (green) as well as a spread to U.S. Treasuries (black). Note that nominal yields have only risen to the prior peak levels of the post-2008 era. The spread to Treasuries is higher, having eclipsed peaks over the past decade, but it is still well below the levels of 2008. One possible takeaway is that corporate yields and spreads can increase a good amount more. That view, however, should be tempered by the fact that the Fed can actively buy corporate bonds, an action they were never able to do in the past.
March 31, 2020
Despite the strong rally, the daily volume on SPY, the popular S&P ETF, has been declining rapidly over the past few days. Weakening volume is a clue that buying power is exhausting.
Crude oil fell over 5% and broke below $20 a barrel for the first time in this selloff. The demand destruction has left many oil storage facilities full, resulting in oil being dumped onto the markets.
Nearly $200 billion of stock buybacks have been suspended over the last few weeks as companies shore up their cash balances. Despite lower share prices, we expect the number of buybacks to decrease sharply from the prior few years. Keep in mind buybacks were a big driver of the bull market.
Goldman Sachs revised their economic outlook as follows:
Q1 GDP -9% (Q/Q annualized)
Q2 GDP -34% (Q/Q annualized)
2020 GDP -6.2%
Unemployment 15% by mid-year
As we have been postulating, QE for stocks may be the next trick in the Fed’s hat. The new SPV partnership with the Treasury allows the Fed to buy corporate bonds and related ETFs and ,therefore, a mechanism that seems to get around the Federal Reserve Act regulating the Fed’s activities. As an aside, the Act prohibits purchasing corporate bonds and stocks. Frequently the Fed will leak policy ideas to gauge the market’s response. Might a recent article from CNBC- “Nothing is out of the question: What it would take for the Fed to start buying stocks” – be a leak from the Fed? Another angle to consider is that the Fed would prefer not to use SPV’s to buy equities, but may hang it out there to help support equity prices.
CNBC had an interesting article yesterday entitled- Mortgage bankers warn Fed mortgage purchases unbalanced market, forcing margin calls. Essentially, the article states that the massive mortgage purchases by the Fed created incredible volatility which crippled many mortgage bankers due to their rate hedges. Expect to see many unintended consequences from the Fed unprecedented activities.
The table below shows how severe the lack of liquidity has been in ETF space. All ETFs have a natural arbitrage mechanism that helps ensure the ETF trades very close to their respective net asset values (aggregate value of underlying securities). Any variance between the ETF and NAV is a risk-free profit arbitrage opportunity for any dealer able to transact in the underlying securities and the ETF. As shown, the variance at times has been exceptionally large, meaning dealers are forgoing outsized profits. Clearly liquidity is grossly lacking as the spreads below should never happened otherwise.
March 30, 2020
Late Friday afternoon, the Fed announced they would scale back QE next week from $125bn to $100bn a day. The market sold off sharply on the unexpected news. Our best guess at this point is the Fed is concerned that Treasury and Mortgage securities, often used as collateral for margin and derivative trades, is becoming scarce.
During the last week of quarter ends, portfolio managers tend to aggressively rebalance their portfolios back to their desired/mandated allocations. Due to the substantial change in asset prices over the past month, rebalancing actions will be much more impactful than normal. For example, if an investor started the year with a simple stock/bond portfolio comprised of 75% SPY and 25% IEF, the portfolio allocation would have changed to 68%/32% over the prior quarter. If the portfolio manager wishes to return to the original 75/25 allocation, they would have to buy about 7% of SPY and sell 7% of IEF. These investment flows tend to occur in the last week of the month, but in many instances are completed a day or two prior to the end of the month.
QE, zero interest rates, repo, and many, but not all, Fed liquidity programs rely on the member banks to re-offer the Fed’s liquidity to counterparties in need. The big question for the next few weeks is whether or not the banks will take the baton from the Fed, lend the money, and take on additional counterparty risk. Thus far, it appears the banks are taking a very conservative stance. To wit, on Friday morning, at the Fed’s repo window, banks only submitted and received a total of $6.75bn in overnight repo and had zero demand for a 3-month repo offering.
The stimulus bill has a provision allowing affected homeowners to postpone mortgage payments for up to a year. While that will help struggling individuals, the onus will be put on banks who will miss those payments. Further, in the case of securitized mortgages, banks, loan servicers, and the agencies (Fannie/Freddie) will be on the hook to make the missing payments to mortgage security holders.
Treasury Bill yields continue to fall deeper into negative territory. On Friday, the yields on both the 1 and 3 month T-bills were below -.20%.
As we have noted over the past few days, the volatility index (VIX) has not confirmed the recent rally. Typically the VIX will decline as the market rises and vice versa. The red trend line in the graph below shows the relationship well. Interestingly, and as shown with the orange dot, for the five days ended last Thursday the market was up nearly 15% and the VIX was about 5% higher. Based on the statistical relationship (r2=.5019), the VIX should have been down 25-50% or even more. The instance is an anomaly and likely signaling that either the VIX or the S&P are wrong.
The following Tweet caught our attention. We hope they are right but are skeptical as bear markets do not often end so quickly or with optimism.
March 27, 2020
Weekly Initial Jobless Claims were shocking, coming at 3.283 million new claims versus a 1.7 million estimate. The graph below shows the claims number is simply beyond compare versus any print over the last 50+ years. The number is roughly 2% of the entire civilian workforce. We suspect initial claims will continue to rise by the millions for the coming weeks, which in turn will cause continuing claims to skyrocket as well.
Today’s Chart of the Day shows that small firms do not have adequate cash buffers to survive an extended lockdown. 25% of all small businesses hold less than two weeks of cash, meaning a good number of them will have to borrow money if possible or take drastic financial and employment actions to stay in business. We remind you small business accounts for about two-thirds of new jobs in the U.S.
In a positive sign that global demand for dollars is weakening, the dollar index is now down to 99.54, about 3 points lower on the week. A weakening dollar points to less stress in foreign dollar funding markets.
Boeing (BA) is up 89% this week through Thursday. While dreams of instant riches are fueling sentiment that a bottom is in, and easy money to be made, it is worth reminding you that BA is still down 39% for the month. Percentages can often tell a misleading story.
Per Yahoo Finance: “S&P has cut more than 280 long-term ratings so far this quarter, also on pace to be the most since the crisis, the data show. Of them, over 170 have come this month alone. Roughly 75 companies have been upgraded in 2020. Moody’s has downgraded more than 180 companies, including about 20 investment-grade firms and 160 junk-rated borrowers. Fitch Ratings has cut over 100 ratings against just 14 upgrades year-to-date.” Currently, companies already rated junk are the ones predominately getting cut. That will probably change and include a large swath of investment-grade companies if a “V” shaped recovery doesn’t take hold quickly.
The following chart shows the 21% gain over the last three days is the second largest on record. During the Great Depression, there was a slew of massive gains, unfortunately, they were accompanied by a large number of sharp declines, of which both the gains and losses were all part of a bearish trend.
March 26, 2020
The Senate passed the COVID19 economic stimulus and bailout legislation unanimously. Upon passage of the bill by the house, expected Friday, both houses will adjourn until April 20th.
Despite another strong rally, the VIX volatility index gave up little ground. Essentially, there are still many investors clamoring to buy insurance via the options markets. Also helping the VIX maintain such historic levels is likely a lack of investors willing to write, or sell, put options to investors. Writing a put option has immense downside if the market continues to fall, but limited upside.
The Fed Funds futures curve is telling an interesting story. By December of 2020, Fed Funds futures contracts imply a 15% chance the Fed cuts rates by 25bps to below zero. Fast forward a year to December of 2021, and futures imply a 40% chance of a 25bp tightening from current levels. This forecast seems out of touch with the “V” shaped economic recovery that is expected to occur later this year after the virus runs its course. If the economy can recover quickly and the Fed does not remove stimulus, as the market is betting on, the consequence might be a spurt of inflation well above the 2% target.
Almost all financial derivatives are partially backed with collateral, typically consisting of U.S. Treasuries or cash. As volatility in the prices of derivatives increase, banks require more collateral. They are also likely to increase collateral requirements if they have credit concerns with a counterparty. The derivatives market in aggregate is over $600 trillion, but approximately $12 trillion when all trades are netted out. Bloomberg wrote an article entitled: We’re Looking at a System-Wide Margin Call, which helps put context to how the derivatives market is putting additional strains on the financial markets.
The impact of the virus on air travel is truly startling as revealed by Deutsche Bank’s Torsten Slok: “The TSA counts number of passengers originating trips from US airports, i.e. No. of people who show their boarding pass to a TSA agent at TSA checkpoints. On a normal March day over 2M people travel by air in US. Yesterday number was 279,018″
Edmunds expects that March automobile sales will be down 35% from March of last year.
Jobless Claims will be released at 8:30. The consensus of economists expect an increase of 1 million people, other analysts think the number could be much higher. The higher water mark in the last recession was 665k.
March 25, 2020
On Monday night, with the equity markets limit up, the volatility index (VIX) fell from 60 to 52 as would be expected. However, when the cash markets opened Tuesday, the VIX rallied throughout the day and regained the entire loss from the night before.
The dollar index fell by 1%, and there was a slew of investment-grade bond issuance. Both are positive signs.
With the price of gasoline so low, Phillips 66 announced: “WE ARE NEARING MINIMUM CRUDE RATES IN MANY OF OUR REFINERIES TODAY.” In other words, refinery profit margins are approaching zero. As a result, they will have to limit the production of gas and other distillates going forward. In regards to future gas prices, will the reduced supply be enough to offset the significant decline in demand?
Invesco’s mortgage REIT (IVR) announced that they could not meet margin calls. The REIT fell 50% and now sits below $3 a share as compared to near $20 before the crisis started. There are rumors of other mortgage REIT failures as well.
Delta was cut to junk by S&P. We expect Delta will be the first of many new entrants into the junk sector. As we have written in the past (LINK), the implications of such a large number of downgrades to junk status are troublesome given the distinct bifurcation of junk and investment-grade investors. Also, bear in mind, the Fed’s new programs only apply to investment-grade paper.
The graph puts historical context to the stunning decline in GDP expectations. The graph below and others showing unemployment rate and jobless claims expectations come courtesy of Sebastian Sienkiewicz (@Amdalleq). Article Link
March 24, 2020
Early Monday morning, the Fed announced unlimited QE. To kick it off, they plan on buying $125 billion of Treasury and mortgage-backed securities (MBS) each day this week. At that pace, they will easily eclipse prior QE operations within two weeks. They also are adding a $300bn lending program for Main Street businesses and the Term Asset-Backed Loan Facility implemented during the financial crisis. Part of the allocation to mortgage-backed securities purchases will also be spent on commercial MBS. The Fed is also creating a special purpose vehicle (SPV) that allows the Fed to buy investment-grade corporate debt from the secondary markets. The SPV was funded with a $10 billion investment from the U.S. Treasury, and it appears that it can be leveraged up ten times, meaning they can buy $100 billion of corporate debt. The facility can also purchase corporate bond ETF’s. This construct might be the “legal” structure allowing the Fed to circumvent the Federal Reserve Act and buy equities.
The market, which was limit down when the market opened Sunday night, popped higher on the news and then fell back to near the lows of the day. It did manage to rally off the lows, but political wrangling in Congress is certainly weighing on the market. Gold, on the other hand, was up $80, the largest one-day dollar gain in recent history. This morning the gains in stocks and gold continue. Stocks are currently limit up 5% and gold added another $85 to yesterday’s gains.
Last week it was rumored that the Fed, via their latest round of QE, was buying Mortgage-backed securities (MBS) with settlement dates of two days from the trade date. While two-day settle is normal in most bond markets, the MBS market works on a singular monthly settlement date in which almost all trades are settled. After hearing that rumor we assumed that a large mutual fund, REIT, or hedge fund was in trouble and the Fed was rescuing them with immediate cash settlement versus the entity having to wait until the April settlement date. Yesterday, per Yahoo Finance, we found out there is at least one big bond fund that required a bailout from the Fed. While on the topic of problems in the fixed income markets, here is a great note from WolfStreet.Com on distress in the leveraged loan market.
As we watch the market concern based on fiscal stimulus from Congress, we are reminded how this played out in the Crisis of 2008. The graph below shows the market rallied when the Senate rejected the first version of the bailout bill and conversely sold off after the passing of the bill.
RBOB Gasoline futures on the CME exchange traded to near 40 cents a gallon yesterday. Retail prices should be falling sharply in the days ahead.
March 23, 2020
It is rumored that the size of the heavily debated fiscal stimulus may be $2 trillion or higher. The debate in Congress is being waged over support for corporations versus support for individuals. Given the upward pressure this deficit would have on debt outstanding and ultimately interest rates, it is quite likely the Fed will also increase the size of QE.
Ohio reported that jobless claims jumped to 139k from 5k a week ago. To put that into perspective, jobless claims for the entire country were 281k last week and were running in the low 200s for months prior to that. Goldman posited that next week’s number could be 2.25 million. Based on Ohio, that number seems low.
Goldman Sachs revised their economic outlook as follows: “we are now forecasting a -24% quarterly annualized growth pace (from -5% previously). A decline of this magnitude would be nearly two-and-a-half times the size of the largest quarterly decline in the history of the modern GDP.” On the bright side, their forecast has a 22% recovery in the following two quarters.
Another day another new Fed program. The latest program, announced Friday morning, allows the Fed to help indirectly fund the municipal bond market:
“Through the Money Market Mutual Fund Liquidity Facility, or MMLF, the Federal Reserve Bank of Boston will now be able to make loans available to eligible financial institutions secured by certain high-quality assets purchased from single state and other tax-exempt municipal money market mutual funds.”
Funding to the municipal markets may become more direct in the days ahead. Per Bloomberg: (Bloomberg) “A Senate bill introduced Friday would allow the Federal Reserve to purchase municipal debt, in an effort to ease the economic strain of the coronavirus pandemic on state and local governments.”
We leave you with a bit of humor to lighten up your day.
March 20, 2020
Today is a quadruple witching day, meaning quarterly market index and stock futures, along with market index and stock options expire. Some investors will need to replace expiring positions or re-hedge existing positions and, in doing so, can produce more volatility than average.
Jobless Claims jumped to 281k from 211k. JPM now expects the unemployment rate to rise to 6.5%. While it’s tough to judge at this point, we fear that estimate may be undershooting the rapid deterioration in payrolls.
The Fed extended dollar swap lines to Australia, Brazil, Denmark, Korea, Mexico, Norway, New Zealand, Singapore, and Sweden. This is in addition to the swap lines just initiated with larger economies earlier in the week. This operation allows for countries to swap their domestic currency for U.S. dollars directly with the Fed. In doing so, the transaction occurs off the market and helps limit dollar appreciation.
In mid-February, the ten-year U.S. Treasury yield was 1.60%. By March 9th, as market concern grew over the economic impact of the virus the yield dropped to a low of .38%. Since then it has risen by nearly 1% in less than two weeks. The initial decline in yield was due to a flight to quality as investors sold risky assets and purchased safe Treasury bonds. Also pushing yield lower was rapidly increasing deflationary pressures as demand for goods and services cratered. At the lows in yield the Fed and the U.S. government rolled up their sleeves and got to work. The Fed dropped rates to zero and introduced a smorgasbord of liquidity programs, all of which are driven by the printing presses. The government has floated numerous proposals for bailouts and economic stimulus. From a ten-year investors horizon point of view one must consider the current deflationary impulse. They must also assess the inevitable massive supply of debt that must be issued and the eventual inflationary impulse when demand recovers. Assessing the tug of war between deflation today and inflation tomorrow will be a big task and, one that if played right, can prove very beneficial for investors of all asset classes. Stay tuned.
Day after day the Fed has introduced new liquidity plans, and day after day liquidity in the equity and credit markets has worsened. We believe the banks are deeply concerned with counterparty risk and not passing on Fed liquidity to those in need. Given the situation, the Fed must be seeking ways to get liquidity directly into the hands of those in need. The idea of the Fed buying corporate stocks and/or bonds is becoming more likely by the day. To that end, Former Fed Chairs Ben Bernanke and Janet Yellen publicly called for the Fed to ask Congress for the ability to buy corporate bonds. The corporate bond market is currently under significant stress, and while such a Fed operation would likely relieve some stress, it raises many questions about the Fed’s role in investing in corporations. The Bank of England and ECB already allow the purchase of corporate debt.
Ford suspended their dividend to bolster, or at least maintain, their cash balances. As respective dividend payment dates come near, we expect many companies that are being heavily impacted by the crisis to reduce or suspend dividend payments. Do not be fooled by high dividend yields.
REITs have gotten hit hard over the last few days. One of the reasons for the sharp sell-off is that UBS announced a mandatory redemption of two leveraged REIT ETFs. The redemption resulted in forced selling at a time when liquidity conditions in the equity markets were awful to begin with.
March 19, 2020
At 1:00 in the morning their time, the ECB announced 750 billion euro of QE. Not to be outdone, the Fed followed up at 8:30 pm with yet another new program. This one will help ensure money market funds have enough liquidity to meet client demands. The timing of both actions is odd, to say the least, and points to the severity of the freeze up in the credit markets.
Across the credit risk spectrum, from risk-free Treasury bonds to risky corporate junk bonds, bond yields rose sharply as it is becoming evident that large and likely forced liquidations are occurring in all asset markets. Yesterday we sold two of our high-quality bond funds, tilting even further towards cash. Our rationale is that the yields are small, upside price potential limited, and the downside is substantial. Further, given our much reduced equity exposure, our need to hedge equity risk is minimal.
The 30-year U.S. Treasury bond hit a yield of 1.85% yesterday after trading below .50% on March 9th. The 2yr/10yr yield curve is now at 70 basis points. Just as stunning as the yield declines were a couple of weeks ago, these recent increases are equally remarkable. Undoubtedly, severe bond volatility may also be the reason that many suspect a large hedge fund(s) has blown up and is being liquidated. Cash is king as evidenced by the 3-month U.S. Treasury bill which traded with a negative yield yesterday.
The dollar soared yesterday to 101.38. The dollar index is now up over 6% since March 9th, the day yields hit their lows. 6% may not seem like a lot, but in the world of currencies that is a massive move. We will have more on the whats driving the dollar in a short article coming later today.
Detroit’s big three automakers have agreed to shut all U.S. factories.
JPM announced their quarterly GDP forecasts for the year as follows:
Q1 -4%
Q2 -14%
Q3 +8%
Q4 +4%
Per the FT, one of the U.K.s largest private pension funds, Universities Superannuation Scheme (USS), serving university and other higher education employees, has reported itself to the regulator after plunging stock markets triggered a breach of a critical funding measure. Trustees will now consider whether contributions from employers and hundreds of thousands of members need to increase.
Expect to hear more news like this from U.S. pensions funds over the coming weeks.
March 18, 2020
The Fed continues to throw the kitchen sink at the credit markets. Yesterday morning they announced $1 trillion in additional overnight repo operations that will occur through the week and a new Commercial Paper Funding Facility (CPFF). The CPFF will allow the Fed to purchase commercial paper and asset-backed commercial paper directly from eligible companies. The Treasury is backing the Fed with $10 billion in credit protection against any losses the program encounters. Later, at 6 pm that night, the Fed introduced the Primary Dealer Credit Facility (PDCF). This facility will offer repo funding backed by a wider range of asset classes, including commercial paper, municipal bonds, and a “broad range of equity securities.” The rollout of this program hints at the likelihood that one or more massive hedge funds is failing. The goal of the program would be to fund the hedge fund so they do not have to sell liquidate onto an already weak market.
Yesterday morning we asked dealers for bids on four high-grade municipal bonds. The dealers would not provide bids on three of the four bonds. The fourth bond came back with a bid, but it was about four points below what we believe is a fair price. This is an example of the freeze occurring in the credit markets.
Italy, Spain, and France are now banning short sales on certain stocks. If the U.S. stock market keeps declining, we expect this could be the next action to help stem losses and protect companies most affected by the virus. The SEC took similar action in 2008/09 with banking and financial stocks.
The flight to quality has fully taken hold in the dollar. The rally is the result of a surge in demand for dollars, as dollars are the world’s reserve currency and much needed around the world. A strong dollar will temporarily boost deflationary pressures. The Fed is currently engaged in a massive currency swap program with other countries. This allows for large currency swaps to occur without further driving up the dollar.
Lost in the overwhelming market and virus news is deteriorating relations with China. China announced they will expel all U.S. reporters for the Wall Street Journal, New York Times, and Washington Post. They are not allowed to work in Hong Kong either.
February Retail Sales fell by 0.5% versus an expectation of a 0.2% increase. It’s hard to know whether or not consumers were starting to hunker down in February as news of the virus spreading throughout Asia and into Europe occurred. Industrial Production was positive and better than expectations. Data, in general, will largely be ignored for the time being.
The U.S. government will postpone the April 15 tax-payment deadline giving Americans an extra 90 days to pay their 2019 income-tax bills.
March 17, 2020
Not only were double-digit losses very troubling yesterday, but of more concern was that the decline started immediately following the Fed’s commitment to providing unprecedented amounts of liquidity to markets. Throughout Monday, intra-day rallies were consistently sold, telling us there is still a steady supply of shares for sale overhead. This was evident in the VIX (volatility index) which peaked in the lower 80s yesterday, slightly surpassing levels last seen in the worst days of the Financial Crisis.
Interestingly the $1.5 trillion in repo offered by the Fed is mostly going unused. Yesterday, dealers only asked for $18.45bn of a possible $500 billion available. $78 billion and $41 billion of $1 trillion total was taken on Thursday and Friday of last week. This weak demand tells us banks are uncomfortable with counterparty/collateral risk if they were to reoffer the repo. As for using it to meet their own needs, they must not have enough collateral to post to the Fed. The circumstance points to troubles in the money markets, as is evident in LIBOR and commercial paper spreads to Treasuries.
Lost in Sunday night’s fireworks was a major change in banking regulations. The Fed abolished the fractional reserve system. Per their statement: “In light of the shift to an ample reserves regime, the Board has reduced reserve requirement ratios to zero percent effective on March 26, the beginning of the next reserve maintenance period. This action eliminates reserve requirements for thousands of depository institutions and will help to support lending to households and businesses.”
Historically banks were required to hold a small percentage of every deposit to ensure they had enough cash in the event of a bank run. Banks then would loan out the remainder of the unreserved deposit and as a result the money supply increased, but it was limited as determined by the reserve requirements. This is what is called the fractional reserve system. Until last night, the supply of money that banks could create was limited by the Fed’s reserve requirement.
This was a significant change that was swept under the rug. As for immediate effects, it is meaningless as banks are already sitting on excess reserves with more coming from the Fed via QE. However, the supply of money is now unconstrained by the Fed. In the future, this can be very inflationary.
We finally got economic data reflecting the realities of the current economic situation. The March Empire Manufacturing Index, covering New York state, fell sharply to lows last seen in 2009.
Economic data will be incredibly hard to assess over the coming weeks as it will begin to incorporate the economic downturn. Surveys such as the regional Fed surveys, University of Michigan Consumer Sentiment, ISM, and PMI will be the first to show the downturn. The monthly jobs number, on the other hand, may take a month or even longer to reflect today’s events. For example, retail sales due out tomorrow are expected to rise 0.2%, and jobless claims are only supposed to increase marginally by 9k jobs. Both of these statistics will be vastly different over the coming few months.
March 16, 2020
If last weeks Fed action was a bazooka, then Sunday night’s was a nuclear bomb. The Fed cut the Fed Funds rate to zero and committed to buy $500 billion of Treasury bonds and $200 billion of mortgage backed securities. The stunning and unprecedented move was clearly planned for just prior to the open of futures market trading at 6pm est. In lieu of this action the Fed canceled this week’s FOMC meeting.
Treasury yields are 15-20 basis points lower as rates across the Treasury curve head to zero. In fact, the 1-month T-Bill actually traded with a negative yield last night. Stocks, commodities, and the dollar are falling sharply as the Fed sparked fears around the world due to the abruptness of their action. The question on every trader’s mind is who are they bailing out? Gold is also falling, likely the result of margin calls and the need for liquidity.
Given the markets poor response to the Fed, we suspect the next course of action could be a suspension of trading for a week or two.
Sunday’s surprise follows Friday in which the Fed announced they would buy $37 billion in various Treasury maturities due to “temporary disruptions in the market for Treasury securities.” Per the press release, the purchases are not additional QE, but part of the planned $60 billion per month that has been occurring since last fall. The highly unusual announcement with predetermined sizes per specific maturity, was in hindsight a tip that the Fed is very concerned with credit markets freezing up.
The University of Michigan Consumer Sentiment survey fell from 101 to 95.9. Quite frankly we expected a bigger decline, but keep in mind the survey period started February 26th so many of the early results were before the market rout and virus related shutdowns.
We update a graph we showed two weeks ago. While the recent volatility seems unprecedented, the difference between the high and the low for each trading session has been extreme, but not as extreme as the financial crisis. Also note the extended duration of volatility during the 2008-09 bear market.
March 13, 2020
Last night we published our latest thoughts on markets and our portfolio management process for the days ahead. Click to read.
The Fed shot their bazooka yesterday. They (Fed Link) are offering three sets of $500 billion repo with terms of one to three months. The first $500 billion operation occurred yesterday with the other two coming today and Monday. Further they altered their current QE program to include longer maturities, TIPs, and mortgage-backed securities. The repo operations will increase the Fed’s balance sheet by $1.5 trillion or 38%. The suddenness and sheer size of the move reek of fear over falling stock prices and possibly a problem brewing in the credit markets. To put $1.5 trillion of repo in context, QE1 totaled $1.320 trillion, QE2 $557 billion, and QE3 was $1.570 trillion.
The graph below shows how $1.5 trillion (orange bars) stacks up against prior QE.
The market spiked on the announcement and then proceeded to give back all of the gains and then some. There is clearly heavy selling pressure that is more than offsetting the liquidity injection. However, the market is up over 5% last night, which puts it near yesterday’s post-Fed announcement spike level.
The European Central Bank (ECB) committed to providing an additional 125 billion euro of QE through the remainder of the year. However, they disappointed the markets buy not reducing rates.
Not helping matters is fighting within Congress. To wit, Mitch McConnell spoke to the differences between the parties- “The Speaker and House Democrats chose to produce an ideological wish list that was not tailored closely to the circumstances. … Certainly, this is disappointing.” As we have discussed, political jockeying in front of an election is a risk few are considering. However, it is worth remembering that in 2008 Congress initially rejected TARP and the market fell 7%, then the bill quickly passed. That occurred within a month or so of a Presidential election.
PPI was down 0.6% versus expectations for producer prices to remain flat for the month. This is a result of plummeting commodity prices. As the lower price of oil filters into other areas of the economy, we should see CPI follow PPI lower.
Yesterday we discussed the coming volatility in inflation data and how hard it will be for the Fed to assess inflation. As an example, the price of jet fuel (graphed below) has been cut in half since the end of the year. At the same time, airlines are grappling with a significant drop in demand. In this case we should expect to see declines in airfare and some great deals. However, some airlines are facing massive losses and possibly bankruptcy if travel bans and weak demand continue. These airlines may cut the number of flights, increase pricing, and try to operate flights profitably, which might be inflationary. Similar examples hold in most industries.
March 12, 2020
The World Health Organization (WHO) officially declared Covid-19 a pandemic.
The Bank of England (BOE) cut rates from 0.75% to 0.25%, and the government followed with 30 billion pounds of fiscal stimulus.
JP Morgan expects the Fed to lower rates 100 basis points at next week’s FOMC meeting.
The Fed boosts the limit for overnight repo to 175bn.
The NCAA basketball tournament will be played without fans, and the NBA suspended its season.
Trump bans travel from Europe.
Headlines like those above and many others are taking their toll on global markets.
Boeing, Hilton, and other companies are aggressively drawing down lines of credit and in many cases on a precautionary basis. These lines of credit are pre-approved loans that often go untapped. Companies frequently pay for these credit lines to ensure they have access to liquidity when credit markets freeze up and/or they are struggling and cannot borrow at reasonable rates. As the lines are drawn down, banks must come up with liquidity to make the loans. Banks likely sold Treasuries to help free up cash, which may help explain why Treasuries sold off yesterday. This also helps explain why the Fed is increasing the size of repo operations and may likely reintroduce QE for bonds.
CPI inflation data came in as expected with a 0.1% monthly increase, which results in a 2.3% year over year change. Inflation data could be volatile over the coming months as inflationary supply line problems are met with deflationary weaker demand. The Fed will likely view any upticks in inflation as transitory, therefore it will not affect their policy decisions.
In Monday’s commentary, we mentioned the Fed was possibly in a bind if they try to provide stimulus via QE due to near zero interest rates. Yesterday morning, Danielle DiMartino Booth also raised the topic in a Bloomberg article entitled The Fed Can’t Let Bond Yields Fall To Zero. Needless to say, Fed stimulus via traditional QE and/or lower interest rates is not as easy as it was over the last decade.
Today’s Chart of the Day puts context towards the recent volatility in Treasury yields. Per the graph from James Bianco, the two-day price return on the 30 year Treasury bond was +8.50% for March 6th and 9th. That was the largest two-day return in the modern history of 30-year issuance. Amazingly, that was immediately followed by a record low two-day price return of -6.66%.
March 11, 2020
Yesterday’s rally started on rumors that the Bank of Japan (BOJ) is considering an expansion of their ETF purchases. The BOJ already owns over 75% of the Japanese ETF market, so their actions are not only limited but detrimental to pension funds and other investors which must hold equity investments.
U.S. markets were nearly 5% higher in part due to proposed fiscal stimulus and bailouts in numerous industries that are being signifcantly impacted by the virus. We believe the bounce was more technical in nature, but regardless, we should consider how stimulus might benefit the markets and the economy. The million dollar question is how much fiscal stimulus can Trump issue via executive order without Congressional approval? We doubt the Democrats will do Trump any favors with only months to go until the election. As such, any fiscal stimulus outside of direct Presidential actions will likely be limited to directly helping with the virus itself and not so much on economic consequences.
Lost in last weekend’s news was a downward revision to Japan’s Q4 GDP from -6.3% to -7.1%. The substantial decline is mainly due to a new sales tax put in place late last year. However, given their already fragile economy and reliance on foreign trade, the impact of the Corona Virus all but guarantees a negative first quarter GDP, which will put Japan in a recession.
The Bloomberg High Yield (Junk Bond) Energy Index rose sharply over the past two weeks to over 14%. To put that in context, it traded around 4% for much of 2017 and 2018, and between 5% and 8% for 2019. In 2008, the yield peaked at 18%. The price of crude oil is currently slightly below the lows of 2008.
As shown below, financial conditions have tightened considerably over the last two weeks, but the decline pales in comparison to 2008.
March 10, 2020
We start with a timely quote from Warren Buffet- “Only when the tide goes out do you discover who’s been swimming naked.” We suspect that over the coming weeks we will see some skinny dippers.
There is finally some good news regarding the virus. China and South Korea are both reporting that the situation appears to be improving. Hopefully, the news indicates that precautionary measures are slowing the spreading of the virus and maybe even that the virus is running its course. Some scientists believe that warmer weather will also help slow down the virus. That said, the impact is just beginning in the U.S. We expect school closing announcements and cancellations of all sorts to intensify over the coming weeks.
The Fed did not cut rates this morning as some suspected, but they did increase the size of their repo programs. The quantity offered in Overnight repos increased from $100B to $150B and term repo from $20B to $45B. As we have witnessed over the past few months these actions are being used to fill short term liquidity gaps until QE (bills) and possibly new QE can make up for the slack.
Saudi Arabia’s decision to produce more oil introduced a new and complicated geopolitical problem into the investing equation. Essentially, the Saudi’s declared economic war against Iran, Russia, and U.S. shale. This situation can resolve itself quickly if Russia comes back to the negotiating table and agrees with OPEC on production cuts. However, many experts think its possible they hold their ground. In fact, Rosneft, Russia’s largest oil producer, plans on following the Saudi lead and increasing production. Like Saudi Arabia, Russia also produces cheap oil and can withstand lower prices better than most producers. The other wild card is Iran’s reaction. Iran was already in dire economic circumstances due to the U.S. imposed sanctions before the price of oil tumbled. $30 oil or less, will inevitably make their economic woes much worse. Saudi actions also put severe pressure on highly leveraged U.S. shale producers of which many cannot profitably produce oil at current prices. As shown in Today’s Chart of the Day the banking sector, which has loaned energy companies considerable funds is also at risk.
The economic data front will be quiet this week except for inflation figures (CPI on Wednesday and PPI on Thursday). We will also pay close attention to Jobless Claims, which will be released on Thursday. The Fed is now entering its pre-FOMC meeting blackout period, meaning that Fed voting members are not allowed to speak publicly. That said, if the Fed takes action between now and then, Chairman Powell is likely to hold a press conference and/or release a statement.
The following is from Jim Bianco:
The all-time high was February 19th, 13 trading days ago.
(we are now) just a little more than 1% away from a media defined bear market (<20%)
Fastest for the S&P 500 from an all-time high to <20%
September/October 1929 = 42 days
August to October 1987 = 55 days
July to October 1990 = 87 days
March 9, 2020
On Sunday, Saudi Arabia reversed course out of frustrations with Russia to agree upon oil production cuts. They came out Sunday and announced that they would increase production and flood the markets with oil. After falling 10% on Friday, crude oil is down an additional 23% to $32/barrel. The combination of lower oil prices and quickly rising virus concerns pushed stock futures to their limits. S&P futures have been down 5% (CME limit) for most of the night. Global markets are also down in similar fashion. Bond yields fell sharply as it appears inevitable the Fed will take action to calm global markets. The 30-year bond yield fell 35 bps to 0.86% and the 10-year note now sits at 0.43%. Fed Funds are pricing in a cut to 0.25% by the end of March and to the zero bound by June. We would not be surprised to see another emergency Fed action as early as this morning.
The BLS Employment report was stronger than expected at 273k, almost 100k more than consensus. The prior month was revised up by 50k. We caution once again, this number is not factoring in the impact of the virus.
As to be expected, inflation expectations are falling rapidly with Treasury yields. As of Friday, the 10-year breakeven inflation rate sits at 1.31%, down from 1.80% at the start of the year. This level is no doubt of concern to the Fed, which has been begging for more inflation for the last nine months.
As we consider the Fed’s options and, in particular, whether or not they will initiate more QE, plummeting Treasury yields enter into that equation. If the Fed were to buy Treasury bonds, it could add to the downward pressure on yields and make matters worse. The Fed could also buy mortgages, but again, as we discussed last Friday, such an action would translate into a run on longer maturity Treasury securities. Might the Fed try to buy some other asset class, perhaps stocks? Currently, they are not allowed to, but we have little doubt that if the market problems become grave enough Congress might grant them “emergency powers” that supersede the Federal Reserve Act. The wild card is the upcoming election and the Democrat’s willingness to help the President.
Boston Fed President Eric Rosengren was on the news wires yesterday and stated the following: “(The Fed) should consider widening the type of assets the Fed can buy.”
On Thursday we ran a poll on Twitter and 76% responded yes to “Does the Fed introduce QE 5 this month? Reminder- QE4 with Bills is already occurring” We bet that number would be close to 100% today.
An important note on credit ratings:
“What (credit) ratings describe isn’t the borrower’s ability to repay principal, but its ability to make interest payments and refinanceprincipal.”– Howard Marks 7/2011
The ability to refinance principal, also known as rolling over debt, is dependent on two factors: interest rates and credit availability. When credit markets freeze up, interest rates rise, and liquidity in the credit markets declines. Under those conditions, companies have a hard time refinancing principal and while the respective companies expected financial situation might not change their credit rating might. Given that over 50% of corporate debt is perched at BBB, one downgrade from a junk bond rating, credit rating criteria are now more critical in the light of current market conditions than at any other time. For more on the situation in the corporate credit markets, we link our article The Corporate Maginot Line.
The quote above finishes as follows: “So ultimately the security of capital providers stems not from the borrower, but from the continued willingness of other capital providers to roll debts in the future.”
The TED spread (Eurodollars less Treasury yields) is a measure of perceived credit risk in the credit markets. As shown below, the spread has recently gapped higher. While still at a relatively low level, a further widening of the spread could prove ugly for corporate bond issuers and investors and problematic for the stock market.
March 6, 2020
Led by the 30 year Treasury Bond, yields plummeted last night. The 30-year yield fell over 25 basis points to a low of 1.30% before rising over the last few hours. The ten-year yield hit .70% and currently stands at .76%. It appears as if there may be a domestic credit problem brewing. The dollar is off a full point, which provides a clue that this event is not a flight to safety from foreigners. A second factor to consider is that banks, which are the largest holders of mortgages, are being forced to “buy duration” (longer-term bonds) in order to offset the declining duration of their mortgage books as mortgages refinance. The existing loans are funded, so banks must replace the mortgage assets as they prepay to prevent a mismatch between their liabilities and mortgage assets.
Jobless Claims show no impact from the virus. There were 216k new jobless claims last week, which is 3k less than the prior week. At 8:30 this morning the BLS will release the monthly employment report. Expectations are for a gain of 177k jobs and an unemployment rate of 3.6%.
There are six Fed speakers on the docket today. Last week every Fed speaker claimed the Fed would not cut rates unless the economic impact from the virus increased substantially. It turns out those claims were false. As such, be careful not to read much into their new words of wisdom.
Fed Funds are now priced for a 100% chance of 50 bps cut at the March 18th meeting. An additional 25bps is priced in for June, and by the fourth quarter the market implies the Fed will hit the zero bound. As such, we cannot rule out an expansion of QE4 and repo as soon as the March 18th meeting.
“100 is the new 10.” Before the recent spate of volatility, a ten-point up or down move in the S&P 500 seemed standard. Today, the market is moving up and down by ten points in minutes and sometimes seconds. Since February 24, the average difference between the high and the low of the day is 106 points. In January and for all of 2019, the average was about 25 points. The important takeaway, given what is transpiring, is that having a process including stop losses and trading contingencies, bullish or bearish, is vitally important. The market can move away from you quickly; a process will help take the emotions out of critical decision making. Risk happens quickly, be prepared!
The graphs below put perspective on recent stock market volatility. The first graph shows the daily percentage difference between the high and low points on each trading day. The second graph shows the 5-day running average of the same data. As highlighted by the red dotted lines, bouts of volatility, as we have seen over the last week, have only occurred five other times since the 2008 financial crisis. Click to enlarge
March 5, 2020
***We are back up and operating as normal!! Thank you for your patience.
As shown in today’s Chart of the Day, based on the rationale for prior emergency rate cuts, the Fed must be very concerned about how the virus will impact the markets and the economy.
A few weeks ago we commented on the sharp decline in January auto sales in China. The combination of the Lunar New Year Holiday and the virus caused sales to drop over 20% that month. February, turned out much worse despite what is usually a bounce back month. As shown below car sales in China fell by 80% in February.
The Global Business Travel Association said the virus could cost the industry $47 billion a month, with more than half coming from airline ticket sales. To add to the impact from the virus, Bloomberg reports “The James Bond sequel “No Time to Die,” due for release next month, will be pushed back until November as Hollywood scrambles to cope with the global coronavirus outbreak.” Needless to say the costs of the virus are ramping up and will be felt in economic data in the coming weeks.
ADP reported that employment for February increased by 183k jobs versus 209k in the prior month. If you recall, last month’s print was originally 291k but was revised lower in yesterday’s report to 209k. Seasonal quirks were the culprit. The consensus of economist expectations for Friday’s BLS Labor report are currently at 177k new jobs and a 3.6% unemployment rate.
Repo offered by the Fed was in high demand for a second straight day. Yesterday $111 billion in bids were submitted and $100 billion accepted. Keep in mind that this recent heightened demand for repo comes as the Fed is winding down its repo operations.
OPEC, backed strongly by Saudi Arabia, is working to cut oil production by up to 1 million barrels per day. Russia is fighting this action as they are looking for more time to better judge the impact of the virus.
On the heels of Joe Biden’s comeback on Super Tuesday and diminished prospects for Bernie Sanders, health care stocks soared. The broad health care sector represented by XLV was up 5.76% and more impressively the health care sub index- managed health care rose over 12%. The index is solely comprised of United Health Care, Centene, Anthem, and Humana which were all up at least 10%.
March 4, 2020
The Fed cut rates by 50 basis points immediately following a conference call, which included Jerome Powell, Treasury Secretary Mnuchin, and other central bankers. While the cut was surprising, the Fed Funds futures market was fully priced for such a move. We remind you of an article we wrote last June, Investors are Grossly Underestimating the Fed. It showed how the Fed Funds futures markets tend to underestimate future Fed moves. In the article we wrote- “If the Fed initiates rate cuts and if the data in the graphs prove prescient, then current estimates for a Fed Funds rate of 1.50% to 1.75% in the spring of 2020 may be well above what we ultimately see.” We now enter Spring in a few weeks and Fed Funds are now between 1.00%-1.25% and are forecasted to fall another 25-50 basis points. Currently, the market implies that Fed Funds will be .50% at yearend. Based on history, Fed Funds will likely be zero by then.
The Markets did not show much confidence over the Fed’s action. Almost immediately following the cut, the S&P 500 fell nearly 100 points and Gold soared by $40. 10-Year Treasury yields fell below 1% to an intraday low of 0.94%, setting another record low. The yield curve continues to steepen as the front end of the curve prices in aggressive easing by the Fed in the future. 30-year yields fell the least as investors are starting to show some inflationary concerns. The 2yr/10yr curve widened to 30 bps. Adding to inflationary concerns, OPEC is in talks to reduce supply.
In addition to the virus roiling the markets, the rising odds of a Bernie Sanders nomination was also being blamed. With Biden’s strong showing last night, the markets are breathing a sigh of relief. S&P futures are set to open up 60 points.
The Fed accepted $120 billion in repo versus demand for $178 billion. Both figures are a sharp uptick from the prior week in which the total amount bid and accepted was below $50 billion per day.
March 3, 2020
Expectations for a rate cut by the Fed are high. It is also widely expected that any Fed actions will be coordinated with the ECB, BOJ and possibly other central banks. A conference call of the G7 Central Bankers is scheduled for tomorrow. The Bank of Japan bought a record 101 billion yen of ETF’s yesterday and vowed to do all it can to help stabilize markets. The ECB stated the following: “We stand ready to take appropriate and targeted measures, as necessary and commensurate with the underlying risks.”
The hope for rate cuts from the Fed may keep the risk markets bid for the time being, but if hopes diminish, the markets may resort to selling off again, and the pressure on the Fed to react will grow. This is the tug of war as we mentioned last week.
The S&P soared yesterday by 136 points (4.6%) and is now about 50 points above its 200 day moving average. The dollar fell by half a percent yesterday and is at one month lows. After a sharp drop in yields overnight to new all time lows (1.04%), the Ten-year Treasury reversed course and closed at (1.15%).
Some important pieces of economic data will be released this week but it will be tough to evaluate, as we do not know to what degree the virus is impacting the data. Yesterday, ISM Manufacturing fell from 50.9 to 50.1. Based on the same data from China, this survey could fall sharply next month. ADP Employment will be released on Wednesday and the BLS jobs report on Friday. On Thursday the timeliest indicator of the labor market, Jobless Claims, will be reported.
There are a few Fed speakers scheduled to speak this week. We suspect they will have very similar scripts and will reveal little as to their latest thoughts on using policy to stem the impact of the virus.
March 2, 2020
The futures markets were extremely volatile last night. S&P futures opened down 75 points, rallied over 100 points, and fell back towards the lows. As of 7:15 am futures are down 30 points. Gold is currently up nearly 40 points, erasing much of Friday’s loss, and Treasury yields have again fallen sharply. The 10-year yield is approaching 1%.
The Fed Funds Futures markets are now expecting a 50bps rate cut from the Fed. Based on pricing, the cut could come as early as this morning. The market is now priced for 100 bps by year end. We suspect the stock market will be very disappointed if the Fed does not take action shortly. If they do cut, we will likely see a relief rally, but then things will get interesting.
On Friday night, after markets were closed, China released horrendous PMI data. The manufacturing index fell from 50 to 35.7, well below expectations for 45. The services index fell to 28.9 from 54.1 last month. Both are record lows (inclusive of 2008). The decline was certainly expected, but not expected was the severity of the decline. Given China’s propensity to manage economic data, the true level for these indicators is likely even lower than what was reported.
The Fed’s preferred price index (PCE) rose 0.1% to 1.7% in January and now sits only 0.3% below the Fed’s inflation target. Hampered supply lines may put upward pressure on this number in the coming months. Rising inflation pressures may help explain why the Fed has not been in a hurry to heed the market’s call to cut interest rates. As a reminder, CPI (yoy) is now at 2.5% and has been steadily climbing over the last year.
Chicago PMI was stronger than expected at 49 versus a prior reading of 42.9. Consumer Sentiment also held up. Both results beg the question of when the surveys were conducted in relation to the virus news.
On Friday, Robert Kaplan, President of the Dallas Fed, and James Bullard of the St. Louis Fed repeated what we have consistently heard from other Fed members; a near term rate cut is not likely. However, Chairman Powell followed later in the day with the statement below. Now we are left to wonder whether the market will find solace in his statement. With the markets expecting imminent actions, are words enough, or will Mr. Powell and the Fed need to reduce rates and/or do more QE?
The ChiNext Index tracks 100 of the largest and most liquid stocks on the Shenzhen Stock Exchange in China. It is sort of an S&P 500 for the Chinese stock market as the index is well-diversified among many industries. Prior to the Corona outbreak and Chinese Lunar New year the index traded at 1993. On the first day of trading after the holiday and state-imposed trading suspension the index fell sharply to 1795. It currently stands at 2071, up 15% from the post-holiday lows and up 4% from before the break. Year to the date, the index is up over 20%. This confounding performance is a testimony to the massive liquidity being supplied to the market by China’s central bank (PBoC), as well as trading restrictions and newly instituted internet firewalls that likely make trading/selling difficult. Clearly, the Chinese government is trying to send a “stay calm and carry on” type message via stocks.
February 28, 2020
The graph below shows that the S&P 500 is now sitting just below its 200 day moving average. Over the past two years, this moving average has provided a backstop for the market. At times, as circled, the moving average arrested the downward price action. In late 2018, shown by the square, it provided a range in which the market consolidated before breaking lower. Investors will be watching this level closely.
Fed Funds Futures are now pricing in a 70% chance of a rate cut at the March 18th FOMC meeting and a total of at least three, 25bps rate cuts by January. In just the last three days, the market has priced in one more 25 bps rate cut in the second half of the year.
Gold was down slightly yesterday but gold miners fell by over 5%. This is potentially a warning that margin calls are starting to force leveraged investors to liquidate holdings.
Despite declining slightly (-0.2%), Durable Goods orders were stronger than expectations (-1.2%) in February. If we strip out the volatile transportation sector, the data was more robust at +0.9%. It’s likely the impact of the virus has yet to be felt in this data set. On the other hand, weekly Jobless Claims rose by 219k from 210k last week. While still a very small number of claims, the data is much more timely and reflective of current employment trends. Due to its weekly reporting this will continue to be a key data point to follow. Similarly, The University of Michigan Consumer Sentiment survey due out at 10 am this morning is timely and may begin to reflect concern by the consumer.
Japan closed all schools, including colleges, until at least spring (March 21st). We have little doubt this all but assures Japan a negative GDP print for the second quarter and, given their sharp 6.3% decline in first-quarter growth, will put them in a technical recession.
February 27, 2020
On Wednesday morning, the S&P 500 jumped over 75 points from its lows established at 4 am; however, by noon those gains started leaking and shortly after the market close, the market had given up the 75 points and then some. The culprit again seems to be the Corona Virus. After the close Microsoft joined a long and growing list of companies that are warning earnings will be hurt this quarter due to the virus.
The market seems to be in a tug of war between the virus and the Fed. As long as the virus keeps spreading, especially if it picks up speed in the U.S., and the Fed remains firm about not lowering rates, the virus will weigh on the market. This was a similar construct witnessed in the fourth quarter of 2018. At the time, the market fell nearly 20% because of the burgeoning trade war and the Fed’s refusal to back down from planned rate hikes and QT. Once the Fed said they would stop hiking rates and stop QT, the market soared. Replace the trade war with a virus, and late 2018 might be a good analog for the current situation. It is worth adding a caveat that the growing threat of a Bernie Sanders nomination is not a positive for the market. Super Tuesday, next week, will shine more light on his probability of winning the Democratic nomination.
Today’s Chart of the Day shows that over the last week there have been massive outflows (investor redemption) from HYG, the popular junk bond ETF. Because it is an ETF, an outflow means that banks and dealers are returning HYG stock to the ETF manager in exchange for the underlying securities. This could be a sign that dealers think the sell-off in equities has run its course and are using the underlying bonds to cover their short junk positions, which they used to hedge stock market exposure. It may also be because liquidity in HYG is much better than the underlying securities, which has created an arbitrage trade for the dealers, whereas they exchange what is rich and liquid (HYG) and receive what is cheap but illiquid (specific junk bonds). We follow this ETF closely as a proxy for the junk bond sector, which can become highly illiquid during volatile periods in the stock markets. Given the popularity and extremely rich pricing in the junk sector, HYG may provide an early warning that junk bonds are in trouble.
The following quote from Warren Buffet caught our attention yesterday: “People, because they can make decisions every second in stocks, whereas they can’t with farms, they think an investment in stocks is different than an investment in a business or an investment in a farm or investment in an apartment house but it isn’t.” His quote is another way of warning that valuations matter.
February 26, 2020
The S&P fell 95 points yesterday and the three-day selloff has now erased nearly three months of gains. Yesterday’s decline was worsened by the following headlines from the Center for Disease Control (CDC):
U.S. CDC SAYS WANTS TO PREPARE AMERICAN PUBLIC FOR POSSIBILITY THAT THEIR LIVES WILL BE DISRUPTED AS CORONAVIRUS SPREADS IN U.S. – TELEBRIEFING
U.S. CDC SAYS NOW IS THE TIME FOR BUSINESSES, HOPSTIALS, COMMUNITIES AND SCHOOLS TO BEGIN PREPARING TO RESPOND TO CORONAVIRUS – TELEBRIEFING
US CDC: “VERY STRONG CHANCE OF AN EXTREMELY SERIOUS OUTBREAK OF THE CORONAVIRUS HERE IN THE UNITED STATES.”
We must also consider that a vaccine may not come quickly. Per the NIH: a virus candidate could be ready in six weeks, but the first trials will take 3-4 months and then the second round another six months. Then it will take some time to produce and distribute it.
The markets are now beginning to discount the probability of a sustained economic impact from the virus.
Yesterday’s price action was interesting in part because the dollar and gold also fell sharply, however, bonds were still well bid with yields on 10’s and 30’s once again setting new all-time lows .
Stocks are now very oversold based on short term analysis and some indexes are closing in on their 200-day moving averages. The Dow Jones Industrial Average is sitting on its 200-day ma, while the S&P still has about 3% to go. The NASDAQ is still 9% above its 200-day ma.
In a speech Monday night, Cleveland Fed President Loretta Mester said: “I don’t have fear that we’ll be behind the curve” by not cutting rates again sooner.”
Yesterday, Vice Chair Clarida stated: But it’s too soon “to even speculate” about whether that (virus) will spur a material change in the outlook.
Every Fed speaker over the last few days has iterated a confident view about stable near term rate policy, which leads us to believe the Fed is no hurry to lower rates to counter any impact from the virus.
The amount of BBB-rated corporate bonds just eclipsed the $3 billion mark, and at the same time, the aggregate yield for these bonds is at all-time lows and the spread to Treasury bonds nears record lows. Corporate bond investors are chasing an increasing amount of risk and receiving far too little in return. During the last recession, BBB-rated corporate bonds traded as high as 8% over similar maturity Treasury yields. Assuming a 5 year duration and no movement in Treasury yields, a similar spread to Treasuries would result in a 32% loss for BBB bondholders today. That is a significant amount of risk for what in many cases is a sub-3% yield.
February 25, 2020
10-year and 30-year U.S. Treasury yields hit all-time record lows on Monday as yields fell sharply across the board. The 2/10s curve was flat on the day, but the 3mos/10s curve fell 10 basis points and is now inverted by 20 basis points. Credit spreads widened as investors sought safety.
Crude oil fell 4% on the day despite a slightly weaker dollar. Oil and other industrial commodities are pricing in a sharp manufacturing contraction over the coming months. Silver, which is a hybrid between a precious metal and industrial metal, was up on the day (+.48%) but not nearly as much as gold (.85%).
The S&P 500 fell 3.32% and the NASDAQ nearly 4%. For the second day in a row, market leaders Apple and Microsoft declined more than the major indexes. The S&P 500 is now flat for the year to date. The VIX (volatility index) rose 48% to 25.
At 10 am, the Conference Board will release Consumer Confidence. After a strong reading in January it will be very interesting to see if the Corona Virus is starting to weight on the positive consumer psyche. The consensus estimate is 132.5. Fed Vice Chairman Richard Clarida will speak this afternoon. Since he spoke last Thursday when he talked down the markets in regards to the Fed cutting rates over the next few months, the stock market has fallen sharply and the virus is spreading into Europe and hitting South Korea hard. His speech will provide a good indicator on whether the Fed may walk back recent statements about being firm with rates.
With Monday’s market strains, Fed Funds futures have ratcheted up the odds of rate hikes. Yesterday, the Fed Funds futures market reduced the implied Fed Funds rate by 8-10 basis points for June and beyond. As shown below, a full 25 bps rate cut is now priced into the June 10th meeting.
The Hong Kong dollar has been pegged to the U.S. dollar since the early 1980s. If the economic impact of the protests, Corona Virus, a weakened Chinese economy, and importantly the stronger U.S. dollar continue to harm Hong Kong’s economy, the central bank may be forced to break the peg as a means of stimulating the economy with a weaker currency. If that were to happen, there would be many consequences. The largest perhaps would be a massive movement from Hong Kong dollars into U.S. dollars. Such a currency flight would certainly benefit the U.S. dollar, U.S. Treasury market, and other U.S. assets to a lesser degree. On the other hand, the resulting stronger U.S. dollar would impede global growth and put more pressure on foreign borrowers of U.S. dollars, particularly in the emerging markets. A stronger dollar is also deflationary and tends to be negative for corporate earnings in aggregate.
February 24, 2020
***Please note the Dashboard has changed slightly. We moved the gauges to the top of the page and, in their place on the right side, added the rolling Twitter feeds of Michael Lebowitz and Lance Roberts.
The market fell sharply overnight following Friday’s losses based on growing concerns of the spreading and impact of the Corona Virus. Gold, bonds, and the dollar are soaring this morning.
Not helping matters on Friday was the Markit Flash PMI (49.6), which fell below 50 and now signals economic contraction. The consensus estimate was 52.5. The Flash index is based on preliminary survey results and serves as a gauge for the final PMI reading due out in about two weeks. Interestingly, within the survey, the manufacturing sector was above 50, while services fell sharply from 53.3 to 49.4. Over the prior year, services led the way as manufacturing suffered due to the trade war with China. Total new orders fell below 50 for the first time in a decade. Markit claims that this new data is consistent with GDP growth of 0.6%. This index may be the first U.S. economic indicator feeling the impact of the Corona Virus.
China’s Passenger Car Association said automobile sales in the first 16 days of February were 4,909, which is only 8% of the auto sales that occurred in the same period last year. As the virus continues to negatively impact China’s economy, the effects will become more noticeable to U.S. companies. For example, in 2019, GM sold more cars to China than they did domestically. The graph below shows which industries are at the greatest risk if the virus continues to have a big impact on China’s manufacturing capabilities.
St. Louis Fed President James Bullard made the following comment on Friday- “Valuations look high but at this level of interest rates. I think we are OK for now.” Bond yields are low for two reasons. First economic growth has been trending lower despite massive fiscal and monetary stimulus. Second, the Fed has removed a considerable supply of Treasury and Mortgage debt from the market, thus artificially reducing rates. The justification Bullard uses and is being used by many investors to justify sky-high valuations, makes little to no fundamental sense.
On Friday, James Bullard and Atlanta Fed President Raphael Bostic reiterated a common theme among the Fed speakers this past week- The Fed does not expect to do anything with rates in the near future. This may also be responsible for Friday’s negative price action. We suspect they will act a lot quicker than they think if the stock market continues lower and the virus spreads as rapidly as it has been.
February 21, 2020
After trading slightly in the green by mid-morning, the stock market hit a tailspin around 11am with the S&P 500 falling nearly 40 points in less than a half-hour. We have yet to see a good reason for the sudden and steep decline, so we provide you with a few of our guesses:
The dollar index continued its daily assent higher and now sits at 2.5 year highs. The dollar is already up about 4% for the year. A stronger dollar tends to be a headwind for corporate earnings.
The Fed minutes on Wednesday and Vice Chair Clarida’s comments (see below) yesterday may have been a bit more hawkish than expected
The virus is beginning to spread rapidly in Japan, South Korea, and Iran, which should create further negative impacts to supply lines and global economic growth
Asset rotation: Gold and bonds continued to perform well and value/small caps outperformed while growth/large caps lagged. Apple and Microsoft, the leaders of this years advance, noticeably unperformed the market.
As has become the norm, the S&P 500 rallied back throughout the day and cut the losses in half. We take yesterday’s action as a reminder that the markets are technically very overbought and a correction can happen much quicker than expected.
The Philadelphia Fed Business Outlook Survey soared to 36.7 from 17, returning it to levels that were consistent prior to the China-U.S. trade war. The only downside in the report is a further decline in the employment index, as shown below. This report and a handful of other employment readings continue to go against the data in the unemployment and jobless claims reports.
Jobless claims edged higher to 210k and the Leading Economic Indicators (LEI) jumped 0.8% versus expectations of +0.3. The gains in LEI were driven by the decline in unemployment claims, and strength in housing permits and consumer confidence.
Fed Vice Chairman Richard Clarida, in an interview yesterday, talked down the notion that the Fed would lower rates in the near future. The Fed Funds futures markets are implying a full 25bps rate cut by late summer and a 50% chance of a cut by June.
The combination of falling Treasury yields and rising inflation has resulted in negative real yields across the entire Treasury curve (from Fed Funds to 30-year bonds). As shown below, this has only occurred one other time (2016) in at least the last 60 years. This provides yet another sign that yields are too low and the Fed is providing an excessive amount of stimulus.
CNBC had an interesting article out yesterday titled: A huge driver of stock prices got off to it’s worst start in 7 years, but that could change. The article points out that in January, corporations bought back their stock at the slowest pace since 2013. The author notes, however, February has seen an uptick. Record breaking amount of stock buybacks have been a large driver of higher stock prices over the last few years. As such, we need to follow this data closely to understand whether January was an anomaly or a sign that corporations are not able to continue at the prior pace. It is worth pointing out that debt has funded many buybacks and some companies are increasingly finding it difficult to keep borrowing without negative consequences to their credit ratings.
February 20, 2020
After two straight months where producer prices were soft, yesterday’s January PPI report showed a sharp increase in input prices for corporations. The monthly change was +0.5% versus a consensus estimate of +0.1%. The sharp jump in prices during January increases the year over year figure to 2.1%, above the Fed’s 2% inflation mandate. PPI excluding food and energy also showed sharp gains. The increases may be partially the result of the Corona Virus and the negative impact on supply chains. In a growing number of instances, manufacturers seeking parts and products from Chinese producers must source more expensive alternatives to meet production needs. As the virus festers, we expect to see smaller companies lacking the ability to source alternatives for Chinese parts to reduce or suspend production and lay off employees. The jobless claims data would likely be the first economic data signaling such activity.
Yesterday, the Fed released the minutes from January’s meeting. As expected, the minutes showed a strong consensus that rates should be kept on hold until a significant change in the outlook occurred. The minutes also said that term repo operations would be “phased out after April.” Further, they said the Fed’s balance sheet was approaching “durably ample levels,” and that “such operations could be gradually scaled back and phased out.” Before thinking the meeting had a hawkish tilt, consider that there was more chatter about a standing repo facility. The facility would provide repo on demand at all times, allowing the Fed to eliminate scheduled and limited repo operations as they do today.
The Fed minutes are essentially modified minutes that allow the Fed to incorporate their latest thoughts into the public announcement. To that end, the Fed’s thinking on valuations may have changed over the last few weeks. Following the January meeting, Powell said “We do see asset valuations as being somewhat elevated.” The minutes released yesterday stated “(the) staff saw asset valuations had increased to elevated levels.”
February 19, 2020
This week is short on economic data but will feature plenty of Fed speakers. On the economic data front, we are most interested in Jobless Claims and Leading Economic Indicators, both are released on Thursday. Leading Indicators, which has historically been a strong barometer of the economy, is expected to rise 0.3% after declining four of the last five months. Jobless Claims continue to skirt near all-time lows and is expected to do the same this week, rising marginally to 211k.
About the slew of Fed members speaking this week, we are on the lookout for indications that the Fed is starting to shift towards the market’s expectations for two rate cuts in 2020. Prior to this week, Fed members have largely been on the same page with each other and the Chairman in being content with current policy and taking a wait and see approach toward future policy. We suspect the growing impact from the Corona Virus might push some of this week’s scheduled speakers to reduce their growth outlook and possibly take on a more dovish stance. If that is to occur, we would expect Neel Kashkari and Lael Brainard to lead the charge.
Macy’s (M) was downgraded to junk status affecting almost $5 billion in debt. The ratings action follows on the heels of $30 billion of Kraft Heinz (KHC) debt that was downgraded last week. The two instances are not necessarily the start of a trend, but we are very concerned by the record amount of BBB debt and the repercussions if a portion of it were to be downgraded. We touch on this concern in today’s Real Investment Advice article Digging for Value in a Pile of Manure which includes graphs and a link to an older article, The Corporate Maginot Line, that went deeper into the topic.
While the equity markets held up reasonably well yesterday despite the downgrade of revenue and earnings guidance from Apple, gold and bonds sense trouble. Gold rallied over 1% yesterday and now sits at a 7 year high despite a strong dollar as of late. Since the start of the year, the USD index is up over 3% and gold has risen over 5%. 30 year yields have dropped from 2.40% at the start of the year to just over 2% today.
February 18, 2020
Yesterday afternoon Apple cut revenue guidance due to virus related production delays and weak demand from China. We suspect that more companies will make similar changes to their earnings and revenue guidance in the coming weeks. Apple represents 5% of the S&P 500, 7.5% of the DJIA, and 11.5% of the NASDAQ.
The U.S. China trade war and a new sales tax caused Japan’s 4th quarter GDP to fall by 6.3% annualized, much worse than the expected 3.4% decline. The sharp reduction of growth was fueled by an 11.1% decline in consumer spending and a 14.1% fall in capital spending. It is now likely that slowing global growth coupled with the impact of the Corona Virus will result in a negative Q1 2020 report and put Japan in a recession. Japan’s GDP is currently at the same level as it was in the mid-1990s.
Retail Sales came in as expected at 0.3%. The only fly in the ointment was the control group, which was flat versus an expected gain of 0.3%. The control group is the sales classifications used for computing personal consumption within the GDP report. The New York Fed’s Nowcast estimate of Q1 GDP fell from 1.67% to 1.39% last week, and sits well below the 2.4% estimate from the Atlanta Fed.
In the last commentary we showed the wide and growing divergence between new jobs (JOLTS) and retail sales. Today, we share a similar graph comparing an equally wide divergence between the S&P 500 (with a four month lead) and new jobs. Either the stock market is very confident that new jobs will spike in the next four months or the liquidity from QE and repo have negated fundamental analysis. As we keep harping, liquidity is the driver of these markets, trumping negligible corporate earnings growth, slowing global growth, the Corona Virus, and a host of other geopolitical concerns. Recognizing the disconnect is important for risk management, but we must also respect the effect that excess liquidity and perceptions have on financial markets.
February 14, 2020
Retail Sales will be released at 8:30 this morning. The current consensus of economists is for an increase of 0.3% for both the main index and the core index, which excludes gas and autos. The graph below shows the strong correlation between the annual change in Job Openings (JOLTS data) and Retail Sales. The current divergence between these two factors portends a sharp decline in retail sales or a surge in job openings over the coming months.
Chinese automobile sales slumped 22% in January, which was the biggest decline in history in the month of January. The China Passenger Car Association warned that February could be even worse. January auto sales in China tend to be weak due to the week-long Lunar New Year holiday. This year, the coincidence of the holiday with the virus made sales much worse. As we have been warning, the impact of the virus will be felt in the U.S. As an example, approximately over a third of GM sales in 2019 were to China. In addition to declining auto sales from all manufacturers to China, China also accounts for 25% of global auto production.
CPI showed inflation was tame and largely in line with expectations and prior month levels. The core reading rose .01% versus expectations of +.02% however, the year over year change was 2.5% versus expectations of 2.4% and 2.3% in the prior month.The Fed prefers inflation as measured by PCE which remains under their 2% bogey.
Jobless claims continue to hover at historic lows with an increase of only 205k in the latest week.
Yesterday afternoon the Fed announced they would further reduce the maximum size for 14-day term repo auctions from $30 to $25 billion throughout the remainder of February and then drop it another $5 billion to $20 billion for March. They also reduced the maximum size of overnight repo operations from $120 billion to $100 billion. Keep in mind the Fed is still buying $60 billion in Treasury bills a month, which should offset the decline in repo liquidity.
Stock and bond markets will be closed on Monday for the Presidents Day Holiday.
We leave you with some weekend reading. The CNBC article linked below summarizes a telling interview with Warren Buffet’s partner, Charlie Munger. Munger’s bearish outlook helps explain why their company, Berkshire Hathaway, is sitting on a growing stockpile of cash, currently valued at $128 billion.
In his second day of Congressional testimony, Chairman Powell said “low rates are not a choice anymore.” In other words, higher rates will do too much harm to the economy and therefore, the Fed must do whatever they can to ensure rates stay low. This explains the increased chatter from various Fed members about rate fixing. Rate fixing is when the Fed puts a cap on interest rates and has a permanent buy program in place to ensure rates do not exceed the cap. This was done as an emergency measure during and after WWII to control interest rates as debt soared to pay for war costs. Incidentally, the Fed just put out a research piece on these operations. The link is HERE.
Powell also provided the stock market a boost when he said the Fed would be willing to use QE “aggressively” if the economy hit a slump.
Today’s Chart of the Day is courtesy of Brett Freeze. His telling graph shows that private investment has dropped precipitously over the last few quarters and to the degree that has not been witnessed since the early 1970s. As shown, sharp declines, such as the current one, have occurred 13 times since 1951, excluding today’s instance. Of those, 10 or 76% have been a result of or attributed to a recession.
The graph below by Ernie Tedeschi shows that over the last six years the number of people entering the workforce has been trending higher while payroll growth has generally been trending lower. They have now converged, meaning that any continuation of these trends should result in higher unemployment rates. That is not necessarily a bad thing, but the Fed may interpret a higher rate as a reason to be more aggressive with monetary policy.
February 12, 2020
Regardless of strong investor sentiment and new record highs, there is mounting evidence of economic damage to the U.S. and global economy as forewarned by recent press announcements. Here are a few that caught our eye yesterday:
China will not meet their purchase obligations of agriculture under the Phase one trade agreement
Apple sales in China could decline by up to 50%
Airbus sees no clear timeline to reopen the Tianjin final assembly plant
Singapore’s Tourism board expects a 25% decline in visitors in 2020.
Under Armour missed on sales and their outlook is weak. They partially blamed the Corona Virus outbreak.
Hedge fund giant Ray Dalio seems to disagree. In Bloomberg, he stated: “the market impact of the Corona Virus outbreak has been exaggerated.” With no vaccine and the virus still spreading, coupled with U.S. stock markets at all-time highs, that is a bold statement from Mr. Dalio. We remind you that in January 2018 Dalio said: “if you are holding cash, you’re going to feel pretty stupid.” He made that statement days before the market embarked on a nearly 20% decline.
Job Openings in yesterday’s JOLTS report were much weaker than expectations at 6.423 million versus consensus of 6.775 million and a prior reading of 6.80 million. Despite other strong BLS reports, this data continues to point to a slowing of employment. As shown below, the decline over the last few months has been the sharpest since the last recession. In fact, the last time it declined this much on a year over year basis was September of 2008.
In testimony to Congress yesterday, Chairman Powell raised concerns about “disruptions in China that spill over to the rest of the global economy.” He also reiterated that the Fed intends to replace repo operations with more permanent QE of T-Bills. In general, his prepared comments were as expected, but during the questioning from representatives, he acknowledged that markets are misinterpreting the Fed’s actions and implied that asset valuations are getting ahead of themselves.
President Trump was not amused and followed with the following Tweet- “When Jerome Powell started his testimony today, the Dow was up 125, & heading higher. As he spoke it drifted steadily downward, as usual, and is now at -15. Germany & other countries get paid to borrow money. We are more prime, but Fed Rate is too high, Dollar tough on exports.“
February 11, 2020
The S&P 500 rose .75%% to close at a record high on Monday. Market are not discounting the potential for any negative effects from the Corona Virus. Either investors believe the economic impact will be small and limited in duration, or they believe the Fed and China will continue to pump the markets with liquidity. We believe it’s the latter driving the markets and, as such, this run can continue despite extremely overbought technical conditions. This condition is best exemplified with Chinese stock indexes, which have been gaining in recent days despite worsening conditions and growing economic consequences. The Shanghai Index, for instance, initially fell 12% in early February but has since risen daily and recovered about two-thirds of the losses.
Jerome Powell will testify to the House and Senate today and Wednesday in regard to the state of the economy and monetary policy. We suspect that Elizabeth Warren and possibly others will use the question and answer sessions to grill the Chairman on repo/QE with the intent of exposing the real reason(s) the Fed has redeployed crisis-era monetary policy. Powell will likely warn about slowing global growth due to the virus. Will he mention asset valuations which have become even more extreme since his last press conference?
JOLTS will be released at 10 am this morning. Given the strong jobs and claims data from the BLS we are curious to see if the pace of job openings in the report continues to increase as it has been. On Thursday the BLS will report on CPI and Jobless Claims. The most important number of the week may likely be Retail Sales on Friday. With the holiday season behind us, this data point provides our first opportunity to see if the last three months of gains were due to seasonal shopping. Given positive readings in consumer sentiment, consumer credit usage, and recent BLS employment data, we suspect Retail Sales will show continued growth in January. We do not expect to see any effect from the Corona Virus.
As if China’s economy did not have enough to contend with, inflation is becoming problematic. On Sunday, it was reported the CPI grew by 5.4%, the highest level in nearly ten years. Of greater concern for the government, the increase is being led by food prices, which grew over 20% from the prior year. Shortages of pork alone accounted for nearly 3% of the increase in inflation. The closing of large manufacturing centers and the reduced ability to provide goods and services will add to inflation in the coming months.
February 10, 2020
The BLS jobs report was strong with payrolls increasing by 225k, about 65k more than estimates. The unemployment rate rose from 3.5% to 3.6%, but that was in part due to a rise in the participation rate from 63.2 to 63.4, a 6 year high. As more workers reenter the workforce, the unemployment rate should rise, but it is generally considered a good signal that jobs are plentiful and new workers are confident in their job prospects.
The BLS revised payrolls from March 2018 to March 2019, lower by 514k. The biggest downward revisions came from the following industries: Private service producing, retail trade, professional and business services, and leisure and hospitality. Average weekly hours were revised higher by 0.1% and average hourly earnings by 5 cents.
The first economic data to show an impact from the Corona Virus was reported by Taiwan last Friday. Exports fell 7.6% versus expectations for a gain of 1%. China accounts for almost a third of all Taiwanese exports. We expect that more economic slowing will start being reported in China and other Asian countries’ economic data in the coming week or two. U.S. economic growth and corporate profits will be negatively affected; however, it is too early to assess how much. Today’s Chart of the Day shows that over 6% of S&P 500 revenue is generated from China and Hong Kong. While a relatively small number, some industries such as semiconductors, technology hardware, and consumer services have much more revenue at stake. Conversely, utilities, and telecommunication services have almost no exposure.
February 7, 2020
Jobless Claims slipped to 202k, showing no signs of labor weakness. On the other hand, the Challenger Job-Cut Report surged to 67,735, the highest since last February. While some of the increase is seasonal, This January’s reading is up 28% more than last January’s total. Once again we are left trying to decipher between government labor reports, which are generally in great shape and deteriorating reports from private entities.
In addition to the closely followed employment report due out at 8:30 this morning, the BLS will also release revisions to data from March of 2018 to March of 2019. Last August, the BLS said that they expect that today’s revisions would reduce payrolls over that one year period by 501k. While the revision is large, it is also old and therefore we suspect it will be largely ignored by the markets. The graph below, courtesy of Dr. Julia Coronado, provides context to the revisions as currently expected.
Our estimate for January jobs growth is +256k, but seasonal adjustments and recent volatility in the data could cause this number to be larger or a lot smaller than our estimate. Bottom line, large or small number, be careful reading too much into this data point.
Yesterday, the Fed’s repo facility was met with $57.25bn in bids from dealers and banks but the Fed only accepted $30bn. This was the second time this week the Fed did not meet demand. Might the Fed be trying to wean banks off of the repo facility?
February 6, 2020
The ADP payrolls report was much better than expected, almost doubling estimates of 154k. The gain of 291k jobs was the highest 1 month increase since May of 2015. With the ADP report in hand, our model is forecasting a gain of 256k in Friday’s BLS jobs report. We caution the variance between the BLS and ADP reports has been significant in recent months. To this point, BLS payrolls only need to grow by 154k to bring the 3 month average of both indexes in line with each other. The consensus estimate is currently 158k.
The ISM Services index slightly beat consensus at 55.5, up from 55.0 last month. While seemingly a good number, the year over year trend points to a gradual slowing of the index. The graph below by Brett Freeze shows the longer term trends in the index. Also of note, the employment sub-index weakened but is still expansionary
Today’s Chart of the Day, courtesy of Axios, shows that consumer confidence is greater for older people than younger people and to an extent not seen in at least 40 years. Axios attributes the anomaly to the different debt and asset profiles of the two generations. We add that the graph may also help partially explain the younger generation’s rising interest in socialism and populism. The following section is from the Axios link.
November’s consumer confidence report showed the largest gap between the confidence of consumers under 35 and those over 55 in the history of the Conference Board’s report.
The chart above shows the result of subtracting the monthly confidence score of respondents over 55 from those under 35.
Younger people have typically had higher confidence scores, but that has changed in recent years, the data show.
What’s happening: That’s largely because older Americans have benefited much more from the current low interest rate environment and gains from the stock market, Nela Richardson, investment strategist at Edward Jones, tells Axios.
“People at different ages are experiencing the economy differently,” she says.
“If you’re under 35 you’re looking more likely at student loan debt and really high home prices, even if interest rates are low. If you’re older, you’re probably not as affected by student loan debt, and you’re probably not negatively affected by high home prices, though you might have a huge gain from home equity.”
The bottom line: Richardson also points out that younger people are less willing to take on risk assets like equities and have missed out on much of the bull market, in part because of their albatross of student debt.
“Whereas every other form of debt — from credit cards to mortgages — actually have this wealth effect that makes you want to invest more and be part of the economy, student loan debt makes young people more risk averse, and it makes them more risk averse precisely at the time you should be taking on more risk assets.”
February 5, 2020
Stock markets around the world surged on Tuesday because of _________. We struggle to name a fundamental rationale to fill in the blank. However, we remind you liquidity is king and that is trumping the Corona Virus and weak earnings. Starting last Sunday night, China has injected massive amounts of liquidity into their financial markets to help stabilize them. Some of this money is certainly finding its way to markets outside of China. Further, banks’ demand for repo from the Fed increased yesterday, and the Fed is meeting those needs, hence more liquidity. On Tuesday, the Fed provided $96.5 billion in repo, which is about $30 billion more than the average over the last two weeks.
On Friday, the BLS will release its monthly update on the labor market. The current consensus estimate calls for data to be largely in line with last month, as shown below. With this morning’s release of ADP, we will run our labor model and provide a forecast on payroll growth tomorrow.
Also of interest today will be the ISM non-Manufacturing Index at 10 am. Thus far, the services sectors, along with personal consumption, have more than offset weakness in manufacturing.
The Baltic Dry Index, a measure of global shipping rates and an indicator of global trade, has fallen sharply since last September. It now sits slightly above its all-time low recorded in 2016. Yesterday, the Wall Street Journal published an article entitled Shipping Bellwether Hits All-Time Low, which discusses the index but points out that one of the sub-components of the index, the Capsize Index, is now below zero. Per the WSJ: “Capesize vessels move products such as iron ore and coal from mines in Latin America and Australia to Europe and China. The index tracking then plunged from minus 21 points to an all-time low of minus 102 on Monday, a Baltic Exchange spokesperson said.” Clearly world trade is hurting due to the Corona Virus outbreak, but it is important to understand both the gravity of the decline as well as the fact that it started well before the Virus took hold.
Stock markets will open sharply higher this morning as the World Health Organization stated that the world is not in a pandemic. With the rally, the S&P 500 is approaching the top of the range that it has traded in since the original sell-off from record highs.
January’s ISM Manufacturing Survey was much better than expected. The reading hopefully signals that the weak Chicago manufacturing survey from last week was an anomaly due to Boeing. ISM is 50.9 and back into expansionary territory. The new orders sub-component rose sharply to the highest level in 6 months (52 vs. 46.8 last month). The big concern within this survey is employment which was improved but remained under 50. David Rosenberg pointed out that only 44% of the industries surveyed reported growth. The chart below shows the current wide divergence between ISM and the performance of the S&P 500. If this relationship is to normalize, then we might expect ISM to continue to rise or the S&P 500 to correct.
Last week the CBO released its deficit forecast for the next decade. They now expect deficits to average $1.3 trillion per year. To put that into context, the largest deficit during the financial crisis was $1.4 trillion. The CBO’s forecast equates to 4.6% of GDP, meaning that if growth is slower than 4.6% the ratio of debt to GDP will continue to rise. It is crucial to understand the CBO is not forecasting a recession over the next ten years. A recession could easily result in a year or two where the deficit is at least double the current annual forecast. One of the big drivers of the higher deficit projection is due to retirement and health spending as a result of the aging baby boomers. Michael Peterson of the Peter G. Peterson foundation summed up our thoughts on the deficits nicely as follows: “It would be one thing if we were running up deficits to fund investments in the future, but that’s not what’s happening,” he said, adding that investments only accounted for “a tiny fraction” of the spending in the budget.”
February 3, 2020
The stock market sold off sharply on Friday despite strong earnings results from Amazon. The S&P 500 has reversed January’s gain and is now down slightly on the year. The 30 year Treasury bond settled slightly below 2% on Friday and is now closing in on 1.95% the record low from last August. Investors finally appear to be focused on the spreading of the Corona Virus and the growing reality that it will impede economic growth.
China’s financial markets finally opened after the Lunar New Year and the extension due to the virus. Despite a massive liquidity injection and rules prohibiting most stock sales, the CSI is down almost 8%.
The Fed Funds futures market rallied sharply on Friday and is now pricing in a 25bps rate cut by July and another 25bps by the end of the year.
The Chicago PMI Manufacturing Index fell sharply to 42.9 versus expectations of 48.9. The index has been below 50 (signaling economic contraction) for 7 straight months. Such a streak has only happened during recessions. One factor adding to the sharp decline is Boeing’s production suspension of the 737 Max. Further, Boeing’s headquarters are in Chicago. Interestingly, the much less followed Milwaukee PMI index is now above 50 and at its highest level since June. Looking ahead, surveys such as these will become tougher to assess as they could be greatly affected by the Corona Virus.
Consumer sentiment continues to rise. The University of Michigan index rose from 99.1 to 99.8. Hopefully, high sentiment continues to result in consumption and offsets manufacturing weakness.
January 31, 2020
Q4 GDP matched consensus estimates of +2.1%. There are, however, a few items that concern us. First, the price index rose by just 1.4% versus 1.8% last quarter and an estimate of +2.0%. In regards to longer-term economic growth prospects, companies are reducing investment. After a short surge following the corporate tax cuts, corporate investment (non-residential investment) has fallen for three straight quarters. The last time that occurred the economy was already in a recession. Lastly, 1.3% of the GDP increase was due to trade. In particular imports of foreign goods fell sharply by 11.6%. This was in part due to tariffs, but it also points to a slowing of domestic consumption. To wit, personal consumption expenditures only contributed 1.2% to GDP, as compared to a running rate of 1.85% for the last three years. Healthcare accounted for over a quarter of personal expenditures.
Jobless Claims came in at 216k, providing little confirmation to private labor reports showing weakening.
BMW is halting auto production in China. Airlines are reducing and/or suspending flights to and from China. Apple is trying to move production from China. These corporate actions and many others like it will impair corporate earnings and reduce economic growth for not just China but for the world.
Tesla rose over 10% on Thursday and now has a market cap equal to GM, Ford, and Chrysler Fiat combined!
One of our investment themes for 2020 is to remain cognizant that the market risks greatly outweigh the rewards. This is based in part on equity valuations that are stretched to levels previously seen before major drawdowns and the record length of the current economic expansion. Just because the risks outweigh the rewards doesn’t mean we need to hide in investment shelters and wait for the storm. However, it does mean we must pay close attention to the known risks and try to think outside of the box and understand the potential unknown risks. To that end, we share a great article from Morgan Housel: Risk Is What You Don’t See.
January 30, 2020
The Fed left rates unchanged as expected, but they did raise the IOER rate by 5 basis points. IOER is the interest rate the Fed pays banks to retain excess reserves. By hiking the rate they will marginally reduce liquidity in the overnight markets and in doing should push the Fed Funds rate higher towards the mid-range of the Fed’s target. Other than changing the date and some members’ names, only two words were changed from the prior December meeting statement. Both changes were of little consequence. The Fed also extended repo operations through April, as was expected.
Here are a few takeaways from Chairman Powell’s press conference:
Jerome Powell mentioned the Fed is monitoring the spreading of the Corona Virus and related economic implications but seemed little phased at the prospect of slower economic growth due to the virus.
In regards to QE guidance, he stated: “We need reserves at all times to be no lower than they were in early September. I would say around $1.5 trillion… That will be the bottom end of the range.” Currently, excess reserves sit just under $1.5 trillion.
Powell dodged Steve Liesman’s (CNBC) question about whether QE was driving stock market gains.
Powell was asked about inflation target averaging, whereby they would aim for a higher inflation rate after periods of lower inflation. Like the prior bullet point, he danced around the question and did not provide an answer.
The Fed believes global economic growth is rebounding as some uncertainties such as trade and BREXIT have been somewhat resolved.
He said that credit and stock asset valuations are “somewhat elevated” but not at extremes. Based on many popular valuation techniques, “somewhat” must be a code word for “extremely.”
Despite a rapid increase in Corona Virus infections, the U.S. stock market seems willing to discount the possibility of any economic slowdown. In China, they are not as sanguine. The Chinese government said “(the) impact of Corona virus on China’s economy could be significantly bigger than that of SARS outbreak.” A Chinese government economist quantified the statement by saying that Q1 growth may fall below 5%. In the latest reported quarter, GDP grew at 6%. Today’s Chart of the Day compares the S&P 500 performance during prior virus outbreaks. If this outbreak could be “significantly” bigger than SARS, the market may want to reconsider its stance. They may also want to consider that China is a much bigger economic power than when SARS hit in 2003. China’s GDP is now over 15% of the world’s economy as opposed to 4% in 2003.
January 29, 2020
Economic data on Tuesday was mixed. The headline Durable Goods number was strong but predominately due to a massive increase in defense aircraft new orders. Excluding transportation and military orders, the data was decidedly weak as shown by Core Capital Goods, which were down 0.9%. Consumer sentiment surged higher, as did the Richmond Fed Manufacturing Index. This is the first strong reading in a manufacturing index and possibly indicative of a rebound in the sector.
After yesterday’s close Apple released a strong earnings report. Both revenues and earnings easily surpassed estimates. They also upped their estimates for both sales and earnings for the next quarter. The stock is trading up 1.8% after hours, which is giving the S&P a boost as well.
The 3 month/10 year Treasury yield curve inverted for the first time since October. The Fed expressed concern over yield curve inversions last fall and helped drive their decision to do QE in addition to repo operations. The question for the Fed as they meet today is will they act upon inverting curves again. It is very unlikely they announce anything today, however, they may mention it in their statement and put the markets on warning about future policy actions.
As you may recall, we added AGNC, NLY, and REM to our portfolios in mid-2019 in anticipation of a steeper yield curve. The yield curve did steepen and we benefited with solid price gains and double-digit dividends. We recently sold half of AGNC as its price was over-extended. We do not have immediate plans to sell the remaining holdings as they have been holding up well despite the curve flattening. We are paying close attention as further yield curve inversions will harm their bottom lines.
In just the last few days copper has fallen nearly ten percent in reaction to the Corona Virus. China is world’s largest consumer of copper. The price is dropping in anticipation of reduced demand and slowing global economic growth. The CRB index (a basket of commodities) and crude oil are also down about ten percent over the same time frame due to similar concerns.
The corporate junk bond ETF HYG saw an outflow of $1.4 billion on Friday, accounting for almost eight percent of the fund. While we are not overly concerned, it’s worth following as junk debt and equities tend to be highly correlated.
January 28, 2020
China’s financial markets will extend their Lunar New Years holiday vacation by three more days to February the 3rd due to the Corona Virus. Since the outbreak, the Chinese Yuan (offshore) has depreciated from 6.85 to 6.98 versus the U.S. Dollar. The decline has now erased all of the gains that came on the heels of the Phase One trade agreement. Even if the virus is eradicated shortly, it will put a temporary clamp on its growth rate. Given that China is the driver of marginal global GDP growth, how will its slowdown affect the rest of the world’s economy?
In addition to the virus, there will be a good amount of economic data this week plus the Fed’s FOMC policy meeting on Wednesday to drive the markets. Today at 8:30, Durable goods will be released followed by Consumer Confidence at 10 am. On Thursday, the BEA will release Q4 GDP. The current estimate is for an increase of 2.1%, which would be in line with the prior quarter. The Atlanta Fed’s GDPNow currently forecasts +1.8% growth. Friday will see the releases of Chicago PMI and the University of Michigan Consumer Sentiment report. We think it is too early for the effects of the Corona Virus to alter any of the data this week or likely data released over the next few weeks. However we might see the Fed comment on it, and there is a possibility some corporations may provide warnings in their quarterly corporate earnings reports. In particular, we will pay attention to Apple’s earnings call on Wednesday, as they are doubly affected due to the manufacturing and consumption of their products in China. China accounts for nearly 20% of Apple’s revenue.
The following was from this past weekend’s Barrons: “.. the Fed’s balance sheet has stopped expanding since the beginning of the year and actually contracted by some $25B in the week ended on Wednesday. .. It’s probably coincidental that the stock market has stumbled, but it bears watching.”
We doubt its coincidental.
January 27, 2020
The S&P 500 is currently down 45 points on rising concerns over the rapidly spreading Corona Virus. This follows a 0.87% decline on Friday, the largest one-day loss in almost two months. While the virus is a growing concern and may potentially impact economic growth, we also believe an important reason for the selloff is the grossly overbought conditions and run away investor sentiment. As we have written, the market is well overdue for a correction, it was just looking for a reason.
This will be the busiest week in terms of earnings reports. Of note are the two stocks driving the market higher, Apple and Microsoft. Apple will release earnings on Wednesday afternoon and Microsoft on Thursday.
For the most part, retail stocks have reported weaker than expected earnings and many have issued poor earnings guidance. Amazon’s earnings on Friday will help us better assess if retail is slumping because more sales are going online to Amazon and others, or if the consumer is slowing down. On a quarterly basis, real, inflation-adjusted, retail sales are negative. This is only the second time this has occurred since the recession a decade ago.
If it appears that the recent rally is an anomaly, your thoughts do not deceive you. The graph below shows that recent returns divided by annualized volatility (risk) have been running higher than at any time since the financial crisis. This standard calculation of return per unit of risk is technically called the Sharpe Ratio. The ratio has been sitting around 2.0 for most of January. To put that into context, the current reading is about 4 sigmas (standard deviations) from the norm, an event that should statistically occur in one day out of every 43 years. Since January first, there have been 5 daily readings that were greater than 4 sigmas!
January 24, 2020
The Chicago Fed National Activity Index fell to -0.35 from +0.41 last month. This index is a weighted average of 85 measures of economic activity. A negative level means economic activity is below trend. A reading of +/- 1 corresponds to one standard deviation. Accordingly, we are only about a third of a standard deviation below trend, which is not concerning. This index tends to fluctuate from month to month, so we do not read too much into monthly data points. However, a reading below -1 would cause us to take notice. Since the mid-1960s all seven recessions were preceded or accompanied by a sub -1 reading. There were only three times the index went below -1, and a recession did not occur.
The Conference Board’s Leading Economic Indicators (LEI) fell by 0.3% versus last month despite the contribution of the surging stock market. On a year over year basis, it is only up 0.1%, the lowest level in over ten years.
Today’s Chart of the Day shows that maybe there are limits to the benefits of QE, at least as far in its ability to manipulate interest rates. The chart compares the yield on German 10-year Bunds, the most liquid of euro bonds, to the size of the ECB’s balance sheet. The data appears to slope upwards, denoting that larger balance sheets drive rates lower. The problem occurs when rates get near and through zero, the correlation of rates and balance sheet seems to disappear.
The graph below shows that the Fed’s balance sheet has declined slightly in January. The decline is due to repo balances (overnight and term) declining more than QE (T-Bills in red) can make up for.
January 23, 2020
Per Fox Business News, Trump said, “we are going to be doing a middle class tax cut, a very big one.” “We will be announcing that over the next 90 days.” While a tax cut would spur GDP growth as the corporate tax cut did, we must consider that he would need the support of the House, which given the upcoming election, seems unlikely to help the President in any way.
The Bank of Canada, which was the only of the major central banks with a hawkish tilt, reversed course yesterday. They expressed concern about their economy, which has slowed in recent months. While they didn’t lower rates, they did drop language about the current interest rate being appropriate. The Canadian economy is much smaller than the U.S. economy ($1.7 trillion vs. $21 trillion), but the economies are well correlated. Canada is America’s second largest trade partner right behind China and ahead of Mexico.
Bob Prince, CEO of Bridgewater, the world’s largest hedge fund, declared that the economic boom/bust cycle is over. Unfortunately, we think Mr. Prince is grossly underestimating the effects of massive and unprecedented monetary and fiscal stimulus that is being employed to keep the economy stable.
January 22, 2020
It will be a quiet week in regard to economic data and Fed speakers. Of interest will be Jobless Claims and Leading Economic Indicators (LEI) on Thursday. Voting members of the Fed will not speak publicly for the next week and a half as they just entered a blackout period preceding the January 29th FOMC meeting.
Last week we discussed the surge of Tesla’s stock price in the Daily Commentary and presented a Chart Book showing similar trading patterns that were witnessed at the tail end of the 1999 dot-com boom. Tesla is not the only stock today that seems to have caught the fever and is rising purely based on momentum and short covering. Beyond Meat (BYND) rose 18% yesterday and is now up 82% in just the first 20 days of January. While it’s tempting to “gamble” on these stocks, we must keep in mind their behavior is not indicative of a healthy market and, importantly may be sending a strong message about the future.
The CDC announced the first U.S. case of the Chinese coronavirus that has killed 6. This is certainly not something to panic over, but we do suggest paying attention to it as rapid spreading of the virus in China and/or the U.S. could certainly alter economic activity.
Commodities have performed poorly versus a traditional stock/bond portfolio since the Financial Crisis. Recently we have discussed the potential for a weaker dollar and with that the potential to increase our exposure to commodities. As the graph below shows, other asset managers are slowly following suit. Currently, as circled, the percentage of managers who are “overweight” commodities is approaching 10% and sits at an 8 year high. It’s too early to say the commodity rout is over, but it is an encouraging sign for the commodity sector.
January 21, 2020
In Friday’s JOLTS report, the BLS stated that job openings fell sharply. The chart below shows the concerning trend in the year over change in job openings.
Housing starts surged 16.9% led by multifamily (5+ units) starts, which were up nearly 75% versus last year. This huge print appears to be a seasonal quirk and we caution not to read too much into this singular data point.
President Donald Trump will nominate Judy Shelton and Christopher Waller to the Federal Reserve Board. Judy Shelton is an MMT advocate and has publicly called for interest rates to be brought down to zero. When her name first came up last summer, the Washington Post quoted her as follows: “(I) would lower rates as fast, as efficiently, and as expeditiously as possible.” For a more in-depth discussion of Shelton and the Fed, we share a link to Shelton, The Fed, & The Realization of a Liquidity Trap, an article we published in July 2019.
The graph below shows that global central bank balances are now at a new all-time high after rising steadily since September. The Fed has certainly played a large role in the increase. Since September, the Fed’s balance sheet has grown from $3.76 trillion to $4.15 trillion.
Strange fact of the day from Eddy Elfenbein (@EddyElfenbein)
“S&P 500 closed above 3,300 for the first time ever. If you’re into numerology, the index first broke 330 in 1987, meaning 33 years ago, and it first broke 33 in 1954 which was 33 years before that. I don’t know what it means, but that’s a lot of 3s.”
January 17, 2020
S&P futures are pointing to another gain this morning on the heels of yesterday’s 27 point rise. Interestingly the S&P is up over 50 points on the week, and yet the VIX (volatility index) is flat. While the index is historically low at 12, it did fall below 10 before the surge in January of 2018 and the subsequent sharp decline that followed. That period feels similar in many ways to the current market run. Recent stability despite the rising market, tells us some investors are bracing for a correction.
Economic data was relatively strong yesterday. Jobless Claims fell back to 204k from last month’s 214k. The Philadelphia Fed Business Outlook Survey soared to 17 from a prior level of 0.3 and an estimate of 3.0. Retail Sales met expectations growing .3% last month and in line with the prior month. More impressive, the core retail sales, excluding gas and automobile sales, rose .5% as compared to a decline of .2% last month.
As we have been writing about for months, private surveys of the job market continue to show a weakening in the labor market, but most of the official government data from the BLS fail to confirm these reports. Tomorrow the BLS will release JOLTS containing information on job turnover. This indicator tends to lead claims and payrolls data slightly.
Alphabet Inc (Google) saw its market cap surpass $1 trillion yesterday, joining Apple ($1.38t) and Microsoft (1.27t) as the only U.S. companies with trillion-dollar market caps.
Beneath the header it says, “Federal Reserve officials are considering a new tool to ease stresses in the repo market.” Our takeaway is that while the Fed acknowledges the risks of too much leverage, they also understand the potential market stresses if leverage to hedge funds is reduced. As such the Fed is looking into making repo trades directly with hedge funds. It seems like a Catch-22 to us.
Details of the Phase One Trade Agreement with China are not being released but we do know that existing tariffs on billions of dollars of Chinese exports are expected to remain in place until after the November election unless a Phase Two agreement is signed. The odds of a second agreement seem small as more complicated and controversial issues like IP and human rights are slated for that deal.
We have overused the words “overbought” and “overextended” over the last few weeks in efforts to try to describe current market sentiment. Today’s Chart of the Day shows that equity analysts appear to be upgrading stocks on the basis of price gains and not fundamentals.
There have been a large number of Fed members speaking over the last few weeks of which none have linked asset prices with the Fed’s balance sheet. Yesterday, Dallas Fed President Robert Kaplan bucked the trend. The following headlines provide us some hope that the Fed is aware that their balance sheet actions are causing distortions in the asset markets.
“WORRIED ABOUT IMPACT OF FED POLICY ON ASSET PRICES”
“HOPE WE CAN FIND A PLAN TO TEMPER FED B/SHEET GROWTH“
January 15, 2020
Both headline (0.2%) and core (0.1%- ex food/energy) CPI came in 0.1% below expectations. The lukewarm inflation data provides further justification for the Fed to keep rates stable.
NFIB (small business survey) continued to trend lower but it still remains near the higher end of the range for this expansion. The graph and table below show the survey’s long term history as well as a breakdown of the ten survey questions asked of small business owners. The decline in job openings and plans to increase employment are concerning as they confirm labor data from other corporate and personal surveys. Small businesses account for over 50% of employment in the U.S.
The Fed announced a slight change to its term repo schedule for February. Each auction will be for $30 billion instead of the current $35 billion. On its own, this action should reduce its balance sheet by about $20 billion.
A subscriber asked us why we keep taking profits and reducing our position in Apple (AAPL). The simple answer is that AAPL is a great company, but its share price is growing well beyond the rate at which earnings and sales are growing. As such, not only is the price technically overextended but it is fundamentally overextended. We recently wrote an analysis of Coca Cola, whose stock is in a similar situation (Gimme Shelter).
Over the last year, Apple’s earnings per share (EPS) grew by 0.33% while its stock price has risen by 86%. Further, the slight gain in EPS is not due to earnings growth but because the number of shares fell by 9%. Over the last three years, the stock is up 153% and its EPS grew by 46%, but only 21% adjusted for share buybacks. Due to the surging stock price and relative mediocre earnings growth, Apple’s price to earnings (ttm) has risen from 12 on January 1, 2018, to 26 today. Its P/E sits well above any reading since the Financial Crisis. Simply, Apple’s share price is grossly overextended. We are holding on to a reduced position in Apple solely due to its price momentum. We understand the precarious nature of the recent price action and will sell it entirely when its price falls below our risk limit.
January 14, 2020
Yesterday, it was reported that the U.S. Treasury will lift the currency manipulator tag on China before the signing the Phase One trade deal on Wednesday. As we suspected, currency manipulation on China’s part was part of trade the deal. Since the deal was announced, the Chinese yuan has strengthened versus the dollar which helps increase U.S. exports as U.S. goods become cheaper for the Chinese.
Since the U.S. assassinated Qasem Soleimani on January 4th, asset prices have been volatile. The following bullet points quantify the change in price/yield since the night he was assassinated through yesterday’s close.
S&P 500 +45
Crude Oil -2.80
Gold -8.10
10yr. Yield +2.50
Tesla continues to surge, rising nearly ten pct on Monday. Its market cap now stands at $92 billion. To put that into context, the aggregate market cap of GM, Ford, and Chrysler is $111 billion. Last month GM, Ford and Chrysler sold 640,000 vehicles, Tesla sold 19,000.
Today’s Chart of the Day shows that many S&P 500 companies are entering, or will soon begin, their earnings blackout period in which they can not buy back shares of their stock. Q4 earnings reporting kicks off this week in earnest as the big banks lead the way. Today, JPM, Citigroup, and Wells Fargo report Q4 earnings. Bank of America, Goldman Sachs, and a host of regional banks will follow them on Wednesday and through the remainder of the week. As shown on the graph, almost half of the S&P 500 companies will be unable to buy back shares from this Wednesday through month end due to self-imposed restrictions.
If you want to see when the stocks in your RIA Pro portfolio or our portfolios report earnings, click on the dividend tab to the right of the graph in the Portfolio page, select earnings, and sort as you wish.
January 13, 2020
December payrolls increased by 145k, 13k below the estimate of 158k. After last month’s surge in job growth, payrolls are back in line with the recent trend and ADP data. As such, we can confirm that last month’s gain of 256k jobs was an aberration largely due to seasonal adjustments. Weak earnings and average workweek data from Friday’s BLS report also confirm this. Average hourly earnings rose 0.1% monthly versus estimates of 0.3% and increased 2.9% year over year versus an estimate of 3.1%. The average workweek also fell short of the consensus estimate.
Next week a new round of inflation data (CPI and PPI) from the BLS will be released. Also of interest will the December Retail Sales data. Currently, expectations are for a 0.2% increase and 0.1% excluding auto sales. As we saw this past week, there will be a large number of Fed members speaking at various events. The next Fed meeting will be in two weeks on January 29th.
The graph below caught our attention. Based on CrossBorder Capital’s model, recent Fed repo and QE operations have resulted in the largest percentage change in liquidity since at least 1970. What’s mind-boggling about these actions is that the Fed has yet to rationally explain why they are supplying so much liquidity, especially since we are not in a recession.
January 10, 2020
In our quest to better appreciate the divergences in employment indicators and assess the health of the jobs market, jobless claims threw a curveball at us yesterday. On the positive front, the BLS initial jobless claims number fell to 214k from 223k which reduced the four-week moving average back into the upper bound of its recent range. Of concern, as shown below, continued claims have been on the rise and now sit at levels last seen almost two years ago. The claims data tells us that workers are not getting laid off at a high rate, but those workers laid off are having more difficulty finding new jobs.
Today’s employment report will shed more light on the jobs market. Expectations are for payrolls to increase by 158k and the unemployment rate to stay at 3.5%. Our model predicts that payrolls will grow by 123k.
Fed Vice Chair Clarida stated, “the Fed will adjust details of repo operations as appropriate, though ongoing purchases may be needed at least through April.” Since September, the Fed has added $424 billion to its balance sheet. $255 has been via repo operations and the remaining $169 is in Treasury Bills (QE). The Fed has committed to adding $60 bln per month in Bills to their balance sheet (QE) through April. Between today and late April/early May they will purchase about $240 billion in Bills which in theory will replace repo operations. This is likely the math backing Clarida’s statement. The problem with that calculation is that if repo is replaced by Bills (QE) then the Fed’s balance sheet will stay the same size for the next few months. Two questions come to mind with that prospect. First, is the funding issue that cropped up in September resolved or at least fixed enough so that the Fed does not need to increase its balance sheet? Second, will the stock market keep levitating if the Fed’s balance sheet stops growing?
A study from Deloitte (link) claims that “97% of CFOs say a downtown has either begun or will begin in 2020“. This is somewhat confirmed in the latest quarterly Conference Board CEO Confidence Survey, which reported a weak bounce from Q3 2019. While the index is higher than the last quarter, the fourth quarter of 2019 is lower than any other quarter since the recession of 2008.
January 9, 2020
Yesterday, stocks took out the record highs which occurred prior to the Iranian assassination. Investors appear content that the skirmish with Iran is now in the rearview mirror. Two factors are supporting this view. First, it is widely believed that Iran purposely missed hitting the U.S. bases on Tuesday night. Second, Trump’s speech yesterday was very conciliatory and supportive of peace. Fortunately, the situation has eased greatly, but we must be careful and not be too complacent, as it will not take much to strike up tensions again.
ADP reported that December payrolls increased by 202k, 45k more than estimates. The two month average, which evens out seasonal holiday quirks, is 134.5k, about 30k below the 2019 average. Consensus expectations for Friday’s BLS Payrolls report are for a gain of 155k jobs, which would put the BLS two month average about 25k above the 2019 average. For what its worth, an increase of 100k would bring the two month average in line with the year to date average. Our employment model based on ADP and the ASA temporary staffing index forecasts a 123k gain in payrolls for December.
Yesterday, we discussed using the rate of change over longer periods versus monthly changes to appreciate changing patterns better. Today’s Chart of the Day shows the sharp deterioration in the ADP report occurring in later 2018 and throughout 2019. It is worth adding the ADP job gains over the last 12 months are the lowest since 2010.
The repo situation is getting more interesting by the day. Yesterday, the NY Fed conducted an auction for $47 billion in overnight repo that was met with $120 billion in demand. This is a warning that the Fed is not meeting growing demand and repo rates may start rising again. Thus far rates have been stable.
The following quote from Lisa Shalett, CIO Morgan Stanley Wealth Management, caught our attention.
“This is a market looking through fundamental data, looking through corporate guidance and data points, looking through Fed guidance itself”… “It is a market that wants to go up in the short term. That is what makes it so profoundly dangerous.”
January 8, 2020
Another crazy night of trading is in the books. S&P futures fell over 40 points on Iranian missile attacks on two U.S. Army bases. After Trump tweeted “all is well” and reports that there were no casualties surfaced, the markets reversed course. Currently, futures are up 6 points. Bonds, gold and oil which were up significantly last night, gave back most of their gains.
The ISM Services Index rose to 55 from 53.9 as the service sectors continue to do well. Of concern, however, this data point is similar to Jobless Claims in that the absolute reading is relatively strong, but the rate of change is declining. The graph below, courtesy of Brett Freeze, shows that the decline on a year over year basis is approaching levels seen before the last two recessions. Using the rate of change over longer periods versus absolute comparisons over shorter periods can help spot trends that are not evident on the surface.
The last two daily Fed’s repo operations were oversubscribed with larger amounts being transacted than the prior few weeks. This bears watching to see if the Fed’s removal of the extra liquidity they provided over the turn of the year is starting to cause problems.
China appears to be dragging their feet to sign the Phase One trade agreement, which is scheduled for January 15th. It is unclear at this time if the activity in Iran/Iraq will provoke China to take a different stance.
We have been asked a few times about our thoughts on shorting Tesla (TSLA) stock. The answer is worth sharing with a broader audience.
The stock has doubled in price from 230 in early October to 470 today. This run-up is likely the result of a short squeeze driven by momentum traders. At today’s closing price, Tesla ($85bn) is worth more than Ford ($36bn), GM ($49bn), and BMW ($53bn) to name a few auto producers. In regards to shorting Tesla, our answer is a definitive NO! It certainly appears grossly overvalued but given market conditions and the rampant FOMO in certain stocks, the rally can continue. On the flip side, a large decline is also possible given its overextended technical and fundamental status. Unless you have an iron stomach, this is one to follow from the sidelines.
January 7, 2020
Yesterday, the S&P 500 was down over 20 points in the morning on Iranian concerns yet rallied to close the day up 11 points. While fiery rhetoric continues from Iran and President Trump, the market seems to be discounting the odds of any significant military action. Since the assassination on Thursday, the S&P 500 is down less than 1%. Gold and Oil provided mixed messages on Monday. Oil fell over $2 a barrel from its highs to close down slightly while gold ended up over 1% on the day.
On the economic data front employment will take center stage. On Wednesday ADP will release their employment report, Jobless Claims will follow on Thursday, and the all-important BLS Labor Report will be released Friday. Last month there was a massive divergence between the ADP and the BLS reports. ADP reported a 67k increase in payrolls while BLS was well above expectations showing a gain of 266k. Seasonal adjustments due to Thanksgiving and Christmas likely played a big role in the large difference. We suspect the divergence will be normalized over the next month or two. Also of interest this week will be today’s release of the ISM-Services Index and Factory Orders.
Last Saturday, Ben Bernanke gave a speech in which he discussed monetary policy and specifically how the tools used to fight the Financial Crisis might work in the next recession. In his opinion, the combination of QE, low rates, and forward guidance are effective to stymie a recession. He cautioned the Fed should not rule out the possibility of using negative interest rates in a recession, as is being done in Europe and Japan.
Of particular interest to us was the following: “Monetary easing does work in part by increasing the propensity of investors and lenders to take risks.”
Bernanke is essentially saying that aggressive Fed policy works because it incentivizes those with capital to take risks. While true, he fails to recognize that much of the risk is in speculative financial assets and not in the real economy. As such, the markets boom while the productivity of the real economy suffers. Essentially he is arguing for a continuous feedback loop in which we sacrifice future economic growth for higher asset prices.
January 6, 2020
The ISM Manufacturing Index was weaker than expected at 47.2 versus the consensus estimate of 49, and a reading of 48.1 last month. All of the 60 estimates by leading economists predicted a higher number than the actual print. 47.2 is the lowest reading since June of 2009. Of concern, the employment sub-index slipped further from 46.6 to 45.1. The following table from ISM provides information and the current trends for each respective sub-index.
On Friday, the Fed released the minutes from their December 11th meeting. The minutes provided more color on the ongoing repo and QE programs. For starters, they finally acknowledged that QE could expand in scope and include purchasing longer-term assets. To wit: “the Federal Reserve could consider expanding the universe of securities purchased for reserve management purposes to include coupon-bearing Treasury securities with a short time to maturity.” A few Fed followers believe this QE instance is not QE because the Fed is buying short term Bills instead of longer term notes. Will this change their minds?
The Fed also alluded to transitioning away from repo operations starting in mid-January as QE will supply “a larger base of reserves.” The Fed didn’t say it, but they will likely have to do QE beyond April or they risk reducing liquidity in the markets.
Over the last few months, many investors bought stocks because history told them that they didn’t want to miss out on “easy” gains that accompany QE. Many of these “investors” are weak hands meaning they have little conviction and likely little threshold for losses. It is worth remembering this as any further escalation of the Iranian conflict has the potential to cause these investors to sell which could become problematic if it happens in a relatively short period.
January 3, 2020
Last night and this morning stocks gave up yesterday’s gains and then some on the assassination of Qasem Soleimani, head of the Iranian military wing Islamic Revolutionary Guards- Quds Force. Crude oil is up nearly 4% or $2.20 per barrel, ten year yields down 0.06%, and gold is $20 higher. Fear of retaliation and escalation will likely weigh on the stock market and keep a bid under oil, gold and bonds for the foreseeable future.
The S&P 500 rose sharply yesterday despite any news of consequence. The internals of yesterday’s move was odd, suggesting the rally was due to portfolio repositioning for the New Year. Likely, any positions that were sold in the prior few weeks for tax purposes, risk reduction, or window dressing were bought back yesterday. Small caps, large-cap value, and defensive sectors, in general, were lower despite the broader market surging nearly 1%. Four of the eleven S&P sectors were substantially lower. Over the next few days and weeks, we should learn if the move is one time in nature related to the New Year or if investors have a renewed hunger for growth and momentum stocks.
China started off the New Year with economic stimulus via a reduction in reserve requirements for banks. The action allows banks to hold fewer reserves per loan and therefore encourages banks to lend more.
Jobless Claims fell slightly from 224k to 222k. The four week moving average, however, continues to rise and now sits at a nearly two year high.
The ISM manufacturing survey will be released at 10 am this morning. Expectations are for the index to rise to 49 from 48.1. While an improvement, a reading below 50 signals economic contraction in the manufacturing sector. The lesser followed PMI Manufacturing Index continues to signal economic expansion, coming in at 52.4, versus expectations of 52.6. PMI is an outlier as many of the regional manufacturing surveys are pointing to contraction in the sector.
The Fed’s balance sheet should shrink in the coming weeks as the one-time year-end repo operations will roll off the books. In time, the decline should be reversed as the Fed is still expected to buy $60 billion of short term assets (QE) through April.
Today’s Chart of the Day removes the stock market from the Index of Leading Economic Indicators (LEI). As shown, the index, excluding stocks, just dipped below zero on a year over year basis. The last two times it fell below zero, a recession followed. Stocks are an important component of consumer and corporate confidence. As long as the market avoids a series downturn, the likelihood of a recession is reduced. We have little doubt that the Fed clearly understands this construct.
January 2, 2020
Buckle up, the stock market may see a big move today. As shown below, since 1930, January 2nd has experienced the largest average absolute percentage price change of any day in the year.
On Tuesday, President Trump tweeted that Chairman Xi and he will sign Phase One of the China/U.S. trade agreement on January 15th. He also said that he would be traveling to China to kick off negotiations on Phase Two soon. As we have discussed, agreement on technology, IP, human rights and other important issues will be much more difficult than the relatively simple Phase One agreement which appears to be largely focused on agriculture and tariff relief. Regardless, we will monitor market reactions to any Tweets and statements from the administration and/or China as to the progress of the new discussions.
Consumer Confidence, as reported on Tuesday, dipped in November. Interestingly, the divergence between near term and future confidence continues to diverge. The present situation component rose and sits near recent highs, while the expectations index declined and is near three-year lows. With weak global growth and declining growth in the manufacturing sectors, the consumer remains the linchpin to economic growth.
In case you missed Monday’s Major Market Buy/Sell Review, we think it is worth highlighting our chart and commentary of the U.S. dollar. As we noted, the dollar appears to breaking lower from a rising two-year channel. Given the importance of the dollar on domestic and global economic activity and inflation, as well as the fact that price trends in the dollar tend to last for lengthy periods, we are assessing and preparing portfolios for the possibility of a prolonged dollar downtrend. In What We Are Not Being Told About The Trade Deal we wrote about the possibility that a weaker dollar is part of the U.S/China trade agreement. In the article, we touched on the correlation between the dollar and various asset classes.
December 31, 2019
The manufacturing industry continues to show weakness with the Chicago PMI report coming in at 48.9, which is above the consensus forecast of 48 and the previous reading was 46.3. Because it increased but stayed below 50, it entails that manufacturing is contracting but at less of a rate than the last reading.
After weeks of slowly melting up in what was expected to be a quiet week of trading, the S&P fell 18 points. Over the last two days, the VIX Volatility index has risen nearly 20%. Volume was very light so we caution not to read too much into yesterday’s decline and rise in volatility as they are likely the consequence of year-end maneuvers.
In the money markets, the night of December 31st is referred to as the “Turn.” This overnight period, starting in one year and ending in the next, is when banks square up their balance sheets to meet stringent year-end regulatory and capital requirements. The turn often sees huge swings in borrowing and lending rates. For instance, it is not uncommon to see Fed Funds and Repo rates collapse to near zero or soar well above normal levels. In fact, there have been years where both happen with the course of hours.
The graph below shows forward Fed Funds trading for this year’s turn. The Fed, through a massive supply of liquidity, seems to have managed an orderly turn. We do not anticipate problems today as the Fed is paying close attention and is willing and able to provide funds to alleviate any stress. CLICK TO ENLARGE
Just a reminder, the BLS will not release employment data on the first Friday of the month, as is customary. It is scheduled for next Friday on the 10th of January.
We wish you a happy and healthy 2020!
December 30, 2019
The low volume stock melt-up will likely continue this week. Of note, however, the VIX (volatility index) rose sharply on Friday and is up again this morning despite the market being slightly higher. It’s hard to tell if the activity is year end position squaring or investors hedging themselves early for potential downside in early 2020 when the Fed’s year-end liquidity programs are curtailed. Regardless, given the extreme overbought conditions and the seemingly steady rise throughout December, a pullback should be expected in January.
The China/U.S. trade deal boosted the price of oil as it hoped that relief of tensions helps resuscitate global trade and economic growth, both of which entail more energy usage. Crude is topping $62 a barrel this morning.
Economic data will be light this week, but of interest will be Chicago PMI on Tuesday and the ISM Manufacturing Index on Friday. Both data points will provide an update on the health of the struggling manufacturing sectors. Based on smaller regional indexes released over the last two weeks, the two indexes may remain below the crucial 50- economic contraction/expansion level.
December 27, 2019
Yesterday, the market closed sharply higher as the end of the year “melt up” continues. The main driver of that rally was the near 5% surge in Amazon (AMZN) on the back of stronger than expected online holiday sales. A couple of months ago we added AMZN to the Equity Portfolio and XLY to the ETF Portfolio in anticipation of this breakout in the stock, however, performance had been disappointing in both until yesterday.
With just three trading days left in the year, the S&P is now set to surpass the 29.6% full year return of 2013 at which point 2019 will be the best year in 22 years, since the 31% return posted in 1997. With the majority of humans out until after New Years, there is little impediment to the algos running the markets higher until the end of the decade.
While the media has continued to use the same strawman of trade optimism to justify the rally, the reality is whatever trade agreement there may actually be, it was priced in long ago. The reality is that the Fed’s $500 billion flush of liquidity into year end to meet short-term funding needs has been interpreted by the markets at “QE” and the rush to benchmark performance into year end is pushing equity allocations, and investor optimism, toward record highs. It is worth noting there could be “payback” after the beginning of the year when gains can be locked in with taxes deferred until 2021.
Speaking of optimism, and outright complacency, the difference (spread) between the high yield (junk debt) CDX index and U.S. Treasury yields has fallen back below 300 basis points. The index measures the cost of insuring high yield debt against default. This extremely low cost of insurance, especially this far into an economic expansion, reeks of complacency and a chase for extra yield as we are seeing in other asset markets.
While we are certainly enjoying the rally, just don’t forget “what goes up, eventually comes down.”
CLICK TO ENLARGE
December 26, 2019
Stocks are set to open slightly higher, based in part on reports from MasterCard of strong online retail holiday sales.
Jobless Claims, released at 8:30 are expected to normalize after a two week spike. The consensus of economists expects an increase of 223k.
Complacency as measured by volatility is not solely confined to the equity markets (as measured by VIX) but, as shown below, is rearing its head in the FX markets. Despite ongoing BREXIT discussions and the possibility of negative consequences for Europe, one year historical volatility in the Euro/USD is at the lowest levels since its formation.
December 24, 2019
Stock markets will close at 1pm and the bond markets at 2:00 today for Christmas.
Durable Goods fell 2% versus an expectation of a gain of 1.5%. Excluding transportation the index was down 0.2%. Despite home builder optimism at 20 year highs, new home sales were weaker than expected. Both data points can be volatile so we caution reading too much into the data.
On Thursday morning the BLS will report on jobless claims, a data series that we are paying close attention to.
With no market to follow this afternoon, we provide you with an interesting article from Bloomberg on the quality of jobs in the labor market. The article helps better explain why wage growth has been weak despite the unemployment rate at 50 year lows. The Jobs Market Isn’t as Healthy as It Seems.
We wish you a Merry Christmas and happy holidays. We will be back on Thursday.
December 23, 2019
China announced they would reduce tariffs on over 850 goods. Markets are up slightly on the news as it was already rumored that tariff relief on U.S. imports to China would be part of the Phase One deal.
The Fed’s balance sheet increased by $43 billion last week (Thursday to Thursday) which annualized, is growing at a pace of $2.2 trillion a year, or a 50%+ increase in the balance sheet.
Consumer spending matched expectations, growing at +0.4% monthly, while Personal Income surprised to the upside (0.5% versus 0.3% expected).
The New York Fed’s GDP Nowcast, a forecast of Q4 GDP growth, increased from +0.69% to 1.32%.
Today’s Chart of the Day shows one of the reasons for the stress in the overnight funding markets. Commercial banks have had to help fund the massive surge in Treasury debt issuance which in turn, forced them to allocate less of their funds toward other loan products such as repo. To put Treasury issuance in context, over the last 12 months the amount of publicly traded Treasury securities has grown by $1.64 trillion. That compares to an average annual issuance of $600 billion during 2018.
Barring the emergence of a large buyer of U.S. Treasuries, this crowding out effect should continue until the Fed can permanently add reserves to bank balance sheets. This is why many, ourselves included, believe that the Fed will eventually buy longer term Treasury notes and bonds to replace maturing repos and short term bill purchases (QE4).
December 20, 2019
The Philadelphia Fed Manufacturing Index was weaker than expected at +0.3% versus an estimate of +8.0 and prior reading of +10.4. Due to the timing of this survey, following the Phase One trade agreement, it is not reflective of the current mindset of those executives that were surveyed. Any benefits from the agreement should become evident in the January round of manufacturing surveys.
The Leading Economic Indicators Index was up 0.1% year over year. Since 1970, every time the indicator fell below zero, a recession followed. The index would probably have been below if not for the rising stock market, which is a key input.
Weekly Jobless Claims fell to 234k from last months elevated 252k. Due to the volatility of the weekly number, economists prefer to focus on the four week moving average. The four week moving average low for the current economic expansion was recorded in April at 201.5k. Currently the average sits at the upper end of the range of the last two years. On a historical basis, the number is very low, but it is rising.
Today’s Chart of the Day shows that prior to last three recessions, the four week moving average of Jobless Claims spiked higher a month or two prior to a significant decline in payroll growth. As shown the recent increase is barely noticeable, but given the deterioration in non-BLS employment data this bears watching closely as a leading indicator.
At 10am Personal Income and Spending data will be released. This data will provide a good reading on the health of the consumer. Expectations are for income to be flat and spending to be up 0.3%. This implies that credit is being used to fill the gap.
December 19, 2019
The market looks to open flat following the House’s impeachment vote, as it is widely believed it will fail in the Senate.
The November Cass Freight Shipments Index was down 3.3% year over year and now lower for 12 consecutive months in a row. This provides further confirmation of weak global economic activity.
Boston Fed President Eric Rosengren, during a speech on Tuesday, made a statement about asset prices that is worth sharing. He stated: “If you look at the last two recessions, they were not situations where inflation got out of control. They were situations where asset prices went way up and then came way down. So if your goal is to avoid recessions, I think we need to be pretty focused on asset prices not just inflation.“
It is widely surmised by investors that the Fed has their back. This statement provides all the more evidence supporting that feeling. We would just ask the Fed to pay more attention to periods like today when asset prices “went way up”, and well beyond normal valuations.
We have written a lot about inflation and how we believe it is underestimated. In this vein, we just stumbled across the Chapwood Index.Chapwood provides inflation data broken down by each major city and based on the top 500 items that people spend money on in those cities. Based on the index, inflation is running at approximately 10% a year. This figure is in line with ShadowStats which calculates inflation the way the BLS calculated it in 1980. Given, approximately 3% wage growth on average, this discrepancy further helps explain the need for ever increasing amounts of debt and the poor situation many retirees find themselves in today. Click on the link above to find the inflation rate in your city.
December 18, 2019
Following two bad monthly prints, Industrial Production rose by 1.1%, slightly above expectations. The GM strike played a large role in the fluctuations over the last three months so we will pay closer attention to this data over the next few months for a better indication of the health of manufacturing. We suspect the trend should be slightly higher due to the Phase One trade agreement, however with Boeing (BA) cutting production of the 737, there may be downward pressure on activity. Capital Economics forecasts that if the Boeing production cut continues through the first quarter, Q1 GDP could be reduced by 0.5%.
The JOLTS labor data showed some improvement with job openings (7.267 million vs estimate of 7.018 million) increasing 3.3% monthly, however they are still down over 4% year over year. We continue to be befuddled by jobs data. Some data has been very strong while other data has been weak. JOLTS is produced by the BLS which in general has produced the more bullish jobs data.
The yield curve continues to steepen, with the 2yr/10yr curve now at+25 basis points. With the Fed on hold, keeping short rates stable, and economic data coming in better than expected we expect the curve will continue to have a steepening bias.
Crude oil broke above the $60 barrier yesterday, however it remains well within its 2019 range ($44-$68). As shown below, from the Major Markets Review published on Monday, oil has cleared the downtrend resistance line from the $75 highs in October of 2018. The case for crude is getting more bullish, which has inflationary implications.
December 17, 2019
Economic data this coming week will be relatively light, but there are a few items worth following. At 10:00 this morning, JOLTs data will provide more detail on the health of the labor market. Job openings have been trending lower in recent months. Just prior at 9:15, Industrial Production data will be released. Of key interest today will be a 12:30 speech by NY Fed President John Williams. The NY Fed manages repo and QE operations, so any information he can provide on the overnight funding stresses and year end operations will be helpful. Jobless Claims and Leading Indicators will be announced on Thursday and Consumer Sentiment on Friday.
As shown below, the European manufacturing sector continues to fall further into recessionary territory. The Eurozone Manufacturing PMI, shown below, has been below 50 for 11 straight months. Within the data set we learned that manufacturers cut jobs to the greatest extent since 2012. Fortunately, Eurozone Services PMI was higher and above 50, helping offset manufacturing woes. Japan and Australia also reported a contraction with PMI manufacturing data readings below 50. We are waiting to see if the Phase One trade agreement will help improve executive outlooks of the manufacturing companies and thereby result in improvement in the sector over the coming months.
CLICK TO ENLARGE
Today’s Chart of the Day shows the surge in the NASDAQ index, which occurred during the last few months of 1999. Most people attribute the massive gain to the final feverish pitch of the dot com bubble. We believe the real culprit was the Fed which added substantial amounts of repo liquidity to the banking sector due to concerns over Y2K and the potential for mass computer malfunctions. These repo funds designed as a buffer for the banking system worked their way to the financial markets. For more please read the following WSJ article from 1999- Federal Reserve Clears Loan Facility Linked To Y2K Computer Problems.
The graph below shows the 10x surge in repo funding during late 1999 and its quick removal shortly after the New Year. Note the recent surge, on the right side of the graph, dwarfs the 1999 experience and that is before an expected $500 billion spike in repo financing over the next week or two. Unlike 1999, we have our doubts as to how quickly the graph normalizes, as the Fed continues to underestimate the scope of the growing overnight funding issues. CLICK TO ENLARGE
To quote Yogi Berra “deja vu all over again.”
December 16, 2019
The takeaway from the ongoing trade saga again is that Phase One appears to be finally agreed upon. As such, existing tariffs will remain in place and the new tariffs, expected to begin on December 15th, will be suspended. This seems to be predicated on China buying $40-50 billion of agriculture per year. As mentioned on Friday, the terms are not being announced, so we can only speculate as to what else might be included in the agreement. We have one opinion, that could greatly affect the asset markets, which we will share with you in a RIA Pro article coming shortly.
In case you are worried that the President will not be able to push the markets higher with daily trade related tweets now that Phase One appears to be done, he announced that negotiations on Phase Two with China will begin immediately.
Retail Sales were weaker than expectations coming in at 0.2% versus expectations for a 0.5% increase. More concerning, core retail sales (ex. autos and gas) were flat versus a +0.4% expectation.
We learned on Friday that for the first time since 2009, the number of people collecting unemployment insurance increased.
With Boris Johnson’s landslide victory in the UK elections it seems all but certain that Great Britain will leave the EU by January 31st. Terms remain to be negotiated, but based on the overwhelming support Johnson received, he has the backing of Parliament and the country to proceed.
December 13, 2019
Right after the stock market opened, President Trump tweeted the following: “Getting VERY close to a BIG DEAL with China. They want it, and so do we!” And with that tweet stocks zoomed higher. The deal was confirmed later in the day, although it is being reported that no details will be released and there will be no signing ceremony. Rumors are China will buy up to $50 billion in agricultural goods in exchange for no increase in tariffs. The chart below shows that $50 billion is significantly more than China’s purchases of US agriculture over the last decade. CLICK TO ENLARGE
Long term bond yields rose sharply as a trade deal means further Fed stimulus is less likely as economic “uncertainty” will diminish. The yield curve steepened yesterday on the trade deal announcement and is further helped by the Fed’s new stance on inflation. Because the Fed is wanting for more inflation, the market is pushing longer term yields higher, while short term yields remain tethered to the Fed’s Feds Funds Rate which is unlikely to rise or fall in the near term.
Lost in the trade news was weak economic data. Jobless Claims surged higher from 203k to 252k. It is worth reiterating that this data point is volatile and we should not make any presumptions based on one weekly reading. However, the increase is big enough to take notice, especially given signs of labor weakness in corporate and consumer surveys.
PPI, was weaker than expected, posting no change on a monthly basis and a 0.2% decline in the core (ex food and energy) reading of producer inflation. Retail Sales will be released at 8:30 this morning. The current estimate is for a gain of 0.5%, following last month’s 0.3% rise. This number is one of the key indicators used to assess the health of the consumer. As noted, personal consumption has largely offset weakness in other sectors of the economy. Consumption accounts for nearly 70% of GDP.
The Fed announced plans to provide an additional $365 billion of repo funding that will cover banks over year end. Typically year funding can be tight due to year end capital requirements. The Fed must concerned that this year end could be particularly troublesome.
December 12, 2019
Headline CPI came in one-tenth of a percent higher than expectations at +.3% monthly, and +2.1% year over year. Core CPI, excluding food and energy, was as expected at 2.1%. Given the Fed is taking a more pro-inflationary stance then what we have witnessed over the last few decades, this economic data point is less relevant than it had been. They will largely turn a blind eye to inflationary pressures that may arise, especially when inflation running below 2% as it is.
As expected the Fed left rates unchanged. They did make a few noteworthy changes that are worth mentioning. For one, the Fed removed the term “uncertainties” in regard to their outlook. Also of note 13 of the 17 Fed members predict no rate changes in 2020. Interestingly, the other four think the Fed will hike rates next year.
“We can sustain much lower levels of unemployment than had been thought and that’s a good thing because we don’t have to worry so much about inflation.“ The quote from Powell in his post meeting press conference provides further evidence that the Fed believes they can push on the economy harder without fear of employment causing inflation. Given that we are at 50 year lows in unemployment and inflation is scant tells us either unemployment isn’t as low as reported, or this time is different. We doubt this time is different.
In general, Powell reiterated the minutes from the Fed meeting in stressing that the Fed is not concerned with the economic outlook. He also mentioned, that if needed, the Fed would purchase longer term Treasury securities making the current QE operation more permanent. The media avoided asking him tougher questions on the repo funding issues or QE4 operations and the questions they asked were largely swept under the rug by Powell.
The dollar was weaker while stocks, gold, and bond prices rose, telling us that the market interprets the press conference and meeting as dovish.
December 11, 2019
Zoltan Polzar, a well followed Fed and Banking analyst at Credit Suisse, is making headlines in regards to his thoughts on the Repo funding situation. He claims that reserves and regulatory constraints are “shaping up to be a severe binding constraint.” To paraphrase- The Fed’s repo and QE4 operations, as currently being administered, are papering over a much bigger problem. He thinks the Fed will be forced to do much more extensive QE before year end.
In part due to skyrocketing pork prices, food prices in China have risen 19.1% year over year. In addition to hurting consumers, inflation makes monetary stimulus harder for the Bank of China to administer as it is inflationary. From a trade perspective, consumer inflation will likely be one factor that pushes Chinese leaders to come to some sort of Phase One agreement. Not surprising, there were numerous press releases yesterday claiming that a delay of the December 15th tariffs is a strong possibility.
The Fed will report on monetary policy at 2pm, followed by Jerome Powell’s press conference at 2:30. Given the new attention to repo funding and QE, we will be on the look out for any changes to their daily repo/QE4 liquidity operations or proposals for how they might address the issues in the near future. We suspect the media will ask a lot of questions on this topic.
CPI will be released at 8:30 and the current estimate is for a 0.2% increase both in the core (ex food/energy) and the headline number.
December 10, 2019
The Bank of International Settlements (BIS) reported that the overnight repo problems of the last few months might stem from the reluctance of the four largest U.S. banks to lend to some of the largest hedge funds. The four banks are being forced to fund a massive surge in U.S. Treasury issuance and therefore reallocated funding from the hedge funds to the U.S. Treasury. Per the Financial Times in Hedge Funds key in exacerbating repo market turmoil, says BIS: “High demand for secured (repo) funding from non-financial institutions, such as hedge funds heavily engaged in leveraging up relative value trades,” – was a key factor behind the chaos, said Claudio Borio, Head of the monetary and economic department at the BIS.
In the article, the BIS implies that the Fed is providing liquidity to banks so that banks, in turn, can provide the hedge funds funding to maintain their leverage. The Fed is worried that hedge funds will sell assets if liquidity is not available. Instead of forcing hedge funds to deal with a funding risk that they know about, they are effectively bailing them out from having to liquidate their holdings.
In addition to the Fed’s monetary policy meeting and press conference on Wednesday, UK elections on Thursday, and the 12/15 China tariff deadline, is a good amount of important economic data slated for release this week as follows:
Tuesday: NFIB Small Business Optimism Index- keep an eye on the labor component as discussed below
Wednesday: CPI
Thursday: PPI and Jobless Claims
Friday: Retail Sales
Last week we were amazed by the large gap between the ADP and BLS labor reports. After some research we discovered that weakness in small business jobs growth is the predominant cause. Because ADP services many small businesses they are quicker and more accurate in reporting changes to small business payrolls than the BLS. The divergence of data is also supported by the NFIB’s (Natl. Federation of Independent Business) employment measure which is also weakening. While the effect on the overall BLS jobs number is not big as it is for ADP, the BLS does show weakness in small businesses. From January to November, the year over year growth in hiring at small employers (1-19 employees) has shrunk from 1.2% to 0.1% while hiring growth at large employers (1000+) has grown from 1.8% to 2.1%. The concern with this finding is that smaller business are more sensitive to business cycles and quicker to react to changes than larger, more bureaucratic companies.
December 9, 2019
The BLS employment report exceeded all expectations, registering a gain of 266k new jobs. Of the 50+ economist estimates that comprise the consensus forecast, the highest one called for a gain of 210k new jobs. Also positive, the unemployment rate fell from 3.6% to 3.5%, although that is partially the result of the participation rate dropping from 63.3% to 63.2%. The GM strike resolution added the 41k jobs that were taken away in the prior month.
This will be a busy week. On Wednesday the Federal Reserve meets to discuss monetary policy. No changes to interest rates or the balance sheet are expected but their comments on growth and implications for policy should be informative. On Thursday, Great Britain will go to polls to elect a prime minister. The biggest market mover may be the December 15th deadline on tariffs. We suspect this week will be filled with many official and unofficial comments as well as plenty of rumors. While it appears that some sort of deal is likely to be agreed upon, there is also a decent likelihood that no deal is reached and the trade war escalates rapidly. Buckle up it should be a fun week.
In numerous commentaries we have discussed the role that the Fed Balance sheet (QE/repo operations) plays in pushing asset prices higher. The following graph puts the current balance sheet expansion into context with the prior episodes of QE. It is truly stunning to consider that QE4 is on the same pace as QE1. QE1 occurred during a recession and with the financial system melting down. At the time major banks and financial companies were in danger of failing. We still have yet to hear a viable rationale for why QE4 was abruptly started. We will have more on this topic in an article coming out on Wednesday. CLICK TO ENLARGE
NEW PORTFOLIO UPDATE:
Due to many requests, we have now added the ability to ADD CASH to the TRANSACTION BASED portfolio.
This is found in the PORTFOLIO TAB / MYPORTFOLIO TRADING
Click To Enlarge Image
December 6, 2019
China is supposedly waiving some tariffs on soybeans and pork. This is hopefully a step in the right direction towards a resolution before U.S. tariffs go into effect on December 15th.
Yesterday we discussed the sharp decline and weakening trend in payrolls as reported by ADP. Jobless Claims bucked the trend and fell sharply from 218k to 203k. The Claims report is making it difficult to figure out the labor market. Private labor market indications such as ADP, NFIB, and various independent surveys point to a definitive weakening trend that the BLS has not picked up on to any large degree. However, it is worth noting that BLS data tends to lag by a few months so we may have to continue to wait for another month or even more to assess which data source is correct. We also remind you that BLS data is sharply revised up and down years after it is first reported. For example, in August the BLS announced that they will revise 2018 payrolls down by 501,000 jobs.
Today BLS jobs report will be released at 8:30. The current expectation is for a gain of 180k jobs and an unemployment rate of 3.6%. That compares to last months readings of 128k and 3.6% respectively. Keep in mind payroll growth was reduced last month by over 40k jobs due the GM strike which has since been resolved. The data report should include the GM jobs which will boost the number by over 40k jobs. The two month total gain will compensate for this and should be correct. Our labor model estimates much weaker growth of 110k jobs.
German Industrial Production fell 1.7% last month and now stands at -5.3% year over year. While some global manufacturing data has turned higher this is not a good sign for global trade.
As shown in Today’s Chart of the Day, the year over year change in both exports and imports is declining. The trade deficit declined from -$51.1 billion to -$47.2 billion as a result of imports declining more than exports.
December 5, 2019
The ADP Employment report was much weaker than expectations coming in at 67,000 versus an estimate of 156,000. That compares to the consensus estimate for the Friday BLS report of 180,000. Our model based on ADP and temporary hiring, estimates the BLS will report payrolls growth of 110,000. For what its worth our model has been within 25,000 of the BLS number on average for the last six months. Even if our estimate is low by 25,000, the jobs number will still be disappointing. To reiterate a big theme of ours, economic growth has been largely supported by the consumer. Any weakness, or perceived weakness in job growth, is likely to spill over into consumption trends and could be problematic for economic growth. Today’s Chart of the Day provides perspective on the slower employment growth trend from the ADP report.
The ISM non-manufacturing survey also disappointed coming at 53.9 versus 54.7 last month and expectations of 54.5. The index is now at a ten year low after being at a 15 year high only 9 months ago. For a different perspective, the following graph, courtesy Brett Freeze, shows that the year over year change in this survey has fallen to levels seen during the prior two recessions. CLICK TO ENLARGE
Despite the weak economic data stocks had a good day, fueled by rumors from an anonymous source that trade talks were progressing. The volatility over the past few days highlight how trade talks are a double edged sword for investors. We think it is important to not overly focus on press reports, government statements, and even rumors, but at the same time be aware that many traders and algorithms are keying on these statements and they can have a big impact on the markets.
December 4, 2019
Fox reported that the administration is planning on moving ahead with tariffs on December 15th. The combination of Trump’s admission that a deal may be postponed until after the election along with the December 15th tariffs caused the S&P 500 to fall by over 40 points. By the end of the day the losses were cut in half, closing the day at 3093. To put the recent decline and current price level in context, the S&P closed at 2938 the night before Phase One of the trade deal was announced.
This morning an unnamed source said the trade talks were going well and with that, the S&P 500 is set to open 15 points higher. Rinse-wash-repeat…
Since last Friday, the VIX volatility index has increased from 11.50 to an intraday high of 17.50. It is approaching the range (18-25) where it has stalled and reversed numerous times over the past 9 months. We will watch VIX trading closely for signs that either the sell-off is abating or that it may break higher. A break above 25, especially if sustained, would be concerning.
The ADP jobs report will be released at 8:15am. The consensus is for an increase of 156k jobs which is about 25k higher than last month. Keep in mind however, last month was reduced by 42k due to the GM strike which has since been resolved. With this number in hand we will run our model and provide a prediction for Friday’s important BLS jobs report.
Following the weak ISM Manufacturing Survey on Monday, all eyes will be on the ISM Non-manufacturing Survey. Current estimates call for a small decline from 54.7 to 54.5. A sharper decline, getting the index closer to 50, would cause concern as ISM has a strong track record in signaling economic activity.
December 3, 2019
This morning the following headline hit the wire: TRUMP SAYS I HAVE NO DEADLINE ON CHINA DEAL AND IT MIGHT BE BETTER TO WAIT UNTIL AFTER NOVEMBER 2020 ELECTION. We will now wait and see what happens on December 15th, when the suspension of tariffs is scheduled to end. The S&P 500 looks to open about 10 points on weaker on the news, following a 1% decline over the prior two sessions as such a result was becoming more likely.
The U.S. ISM manufacturing survey was disappointing on Monday, coming in at 48.1 versus expectations of 49.2 and a prior reading of 48.3. This follows the encouraging PMI manufacturing survey which rose last Wednesday and better manufacturing surveys from other nations. The employment component within the ISM report dropped further signaling the potential for weakness in Friday’s employment report. The new orders component has dropped and is now at its lowest level since June 2012.
China’s Caixin manufacturing survey rose above 50 and into economic expansionary territory (50.2 from 49.3), while the non-manufacturing survey is showing robust readings at 54.4 vs 52.8 last month. Given China drives about a third of global GDP growth, this is an encouraging sign for a turnaround in weakening global growth. The only potential drawback is that the improvement of China’s economy allows the government to take a harder stance on trade which could re-introduce more tariff threats and/or actions.
Trump raised the prospect of steel tariffs on Argentina and Brazil. Last Tuesday Brazil signed an agreement with China allowing them to export soy products to China. This is the first time they have been able to sell agricultural products to China in decades. Argentina signed a similar deal in September. These tariffs are likely a warning to those countries. China has been trying to diversify other products in addition to agriculture. Our friend Mike “Mish” Shedlock recently wrote about similar actions that China is taking in regards to the production of cell phones- China No Longer Needs U.S. Parts in its Phones.
The Fed is considering allowing inflation to run above its target of 2%. In an article released yesterday by the Financial Times, (LINK) the Fed’s review of monetary policy is likely to include a rule that allows them to overshoot their inflation target after a period of undershooting. As we mentioned after the last FOMC meeting, the Fed is making it abundantly clear they want more inflation and will not raise rates if inflation picks up. Bond yields rose on the news.
December 2, 2019
The ISM PMI manufacturing survey will be released at 10am this morning. Expectations are for the survey to remain in economic contraction territory (<50) but rise from 48.3 to 49.1. The ISM non-manufacturing (services) survey will be released on Wednesday. Also of note this week will be the ADP jobs report on Wednesday and the important BLS employment report on Friday.
Currently there is a near zero percent chance of a rate cut at the December Fed meeting and only a 25% chance of a 25bp cut by April.
In September, the 2yr/10yr Treasury yield curve went from -5bps to +27bps. Since then, it has flattened back to +15bps. We believe it can flatten further, but with the Fed currently doing QE and having reduced rates by 75bps, we think the market will be quick to price in further rate cuts if economic data weakens or the China/US trade deals falls apart. As such, we continue to think any inversion will be limited and that over the longer term the curve will steepen significantly.
The Atlanta Fed GDPNow forecast for Q4 GDP has risen sharply from 0.4% in mid-November to 1.7% as of last Wednesday due to the encouraging economic data released over the past week.
November 29, 2019
Economic data on Wednesday was better than expected but with some important caveats as follows:
Durable Goods rose 0.6% which is much better than an expected decline of 0.7%. Last month was revised lower from -1.1% to -1.4%. While October’s data was better, the year over year change in durable goods, excluding aircraft and defense, is still negative. These two sectors are commonly excluded as they are very volatile month to month.
GDP was revised higher to 2.1% from 1.9%, of which .17% of the .2% increase was due to a revision of inventory data.
Jobless Claims fell to 213k versus expectations of 218k. As we have been discussing this measure of labor is showing no sign of weakening. That said, due to seasonal adjustments and the Thanksgiving holiday falling a little later than last year, we must take today’s number with a grain of salt. To this point, the non-seasonally adjusted number posted its largest year over year increase since 2010.
Chicago Purchasing Managers Index (PMI) continues to show improvement rising from 43.2 to 46.3. This is potentially a good sign that the slump in manufacturing is abating. We will look for confirmation in the more followed ISM surveys.
Personal Income was flat versus expectations of a 0.3% increase. This did not effect consumer spending which rose by 0.3%.
President Trump signed the Hong Kong Bill of Rights and Democracy Act on Wednesday night. The Chinese quickly responded with strong rhetoric denouncing the bill which call trade talks into question. Despite Trump’s actions, the S&P 500 is only slated to open down 6 points. Trump had a week to discuss the bill with China so it is possible that any harm has been largely resolved. That said, we should not rule out that the signing will be a huge impediment to trade talks. For consideration- China knows how much Trump cares about the stock market and it therefore raises the possibility that they take actions when the markets are open and liquid today or even next week.
November 27, 2019
Dallas Fed President Robert Kaplan conveyed some noteworthy concerns about debt and leverage in an interview on CNBC. Here are a few quotes from the interview:
“The thing I am worried about is if you get two or three BBB credit downgrades to BB or B, that could lead to a rapid widening in credit spreads, which could then lead to a rapid tightening in financial conditions,”
“We’re got a record level of corporate and to be specific BBB debt has tripled over the last 10 years,”
“Leveraged loans as well as BB and B debt have grown dramatically.”
“The problem with ’08-’09 was that the lenders were overleveraged. Right now, we have an issue where the borrowers are highly leveraged,” Kaplan added. “My concern is if you have a downturn where we grow more slowly it means that this amount of debt could be an amplifier.”
Kaplan’s discussion about BBB-rated bond downgrades is potentially a big problem, and one which we believe is greatly underappreciated. We raised the issue in May with our article The Corporate Maginot Line. To wit: “If 50% of BBB-rated bonds were to get downgraded, it would entail a shift of $1.30 trillion bonds to junk status. To put that into perspective, the entire junk market today is less than $1.25 trillion, and the subprime mortgage market that caused so many problems in 2008 peaked at $1.30 trillion.”
Consumer Confidence was slightly weaker than expectations at 125.5 vs 126.9. While the decline is not worrisome, of concern is that consumers continue to see worsening labor conditions. Per Econoday: “those saying jobs are “plentiful” decreased from 47.7 percent to 44.8 percent, while those claiming jobs are “hard to get” increased from 11.6 percent to 12.7 percent.” We suspect this slow, but steady deterioration in the two job survey questions will eventually result in higher jobless claims.
Due to the holiday on Thursday, Jobless Claims will be released this morning. The current expectation is for a decline from 227k to 218k. The 4-week moving average is 221k.
Durable Goods, due for release at 8:30, is expected to decline by 0.7%, following a 1.1% decline last month.
November 26, 2019
The Dallas Fed manufacturing index dropped from +4.5 to -2.4 and has turned negative for the time first time in three years. The regional index is a good barometer of the energy sector. The last time it was negative, crude oil traded below $30 a barrel. As we discuss below, CCC bond yields are rising of which a good chunk of the increase is due to the energy sector.
Over the past 6 months yields on CCC-rated bonds have been rising while those of other junk rated bonds (B and BB) have been stable. Some in the media believe this divergence to be a signal of brewing corporate credit problems that will soon show up in B and BB rated debt. Over the last 6 months the yield spread, or difference, of CCC rated debt to U.S. Treasuries has increased by 2.63%. At the same time those spreads for BB and B rated debt slightly declined. Such a divergence may seem extreme, but when historical data comparing these spreads is examined, as you can see in Today’s Chart of the Day, the differential is not statistically significant. The current intersection of CCC and B rated yields is represented by the orange dot. Based on the strong regression (R2=.85), B spreads would need to rise by 0.29% to normalize to the historical relationship. BB spreads would need to increase by 0.74%. Neither move would be overly concerning.
What is more interesting is divergence between the S&P 500 and CCC rated spreads as shown below. CLICK TO ENLARGE.
Of note on the economic calendar is Consumer Confidence at 10am, Durable Goods and Jobless Claims on Wednesday and Chicago PMI on Friday. The stock markets will be closed on Thursday and close early at 1pm on Friday.
Based on the recent speeches of Jerome Powell and other Fed members, we sensed a growing concern for increased Federal and corporate debt levels along with higher stock valuations. Prior to Friday, there were only a few of us voicing such concerns. On Friday this changed, as CNN published The $4 trillion force propelling US stocks to record highs. The fact that such a broadly followed non-financial media outlet made this insinuation, linking QE to stock market prices, will certainly catch the Fed’s attention. As we posited in our updated article, the Fed may unexpectedly alter QE4 to the chagrin of the market.
The Consumer Sentiment index improved again and is back to the same levels of mid-summer. Expectations led the improvement in the index while the current conditions component was down.
Jerome Powell will speak at 7pm tonight. We are interested on his thoughts about QE and repo as well as the Fed’s newfound concern with downside economic risks as mentioned in Thursday’s Commentary.
November 22, 2019
Weekly jobless claims registered at 227k, 10k above estimates and at the same slightly elevated level as the upwardly revised number from last month. This is a historically small number of jobless claims, but it has been rising recently. While the number of new claims is small, what concerns us is the rate of change. The chart below shows that the year over year change in continued claims (new and old claims), turned positive for the first time in this economic expansion. Positive readings have preceded all prior recessions since at least 1970, but it’s not a full-proof indicator as there have been a number of false signals. CLICK TO ENLARGE
The Philadelphia Fed survey on manufacturing conditions rose in a possible sign that manufacturing in the Mid-Atlantic region is recovering.
Leading Economic Indicators rose 0.3% year over year, which is the slowest rate of growth in a decade. The last 5 times the index went from positive to negative growth on a year over year basis resulted in four recessions (2008, 2001, 1990, and 1981) and one false signal (1996). On a monthly the basis the indicator was negative for the third month in a row. Since the data was first calculated in 1959, three consecutive monthly declines occurred 11 times and 7 of those 11, were followed by a recession within 6 months. Needless to say, this indicator is flashing a warning sign.
There are a couple of leading indicators that are not widely followed which have caught our attention recently. The daily Baltic Dry Index, which measures dry bulk shipping costs, has fallen sharply since the beginning of the fourth quarter. The index was rising throughout the first three quarters of the year. Lower shipping costs are in part the result of weakened demand for shipping as global trade is weak. The pickup in the first few quarters was likely a function of inventory stocking to front run potential tariffs or other trade restriction.
The other indicator is the Citi Economic Surprise Index. This measure quantifies whether economic data is coming in better or worse than a consensus of Wall Street economists. During the third quarter the index rose sharply, meaning economists were underestimating the pace economic activity. However, over the last month or so, it has fallen back below zero, a sign that economic data is in general coming in weaker than expectations. For the last few weeks we have heard many in the media claim the Fed has successfully avoided a recession or economic slowdown. Might they have spoken a little too soon?
Per the South China Morning Post- “China Watching Donald Trump’s Response To US Hong Kong Bill As It Threatens To Become New Barrier To Trade Deal.”
November 21, 2019
According to Reuters, Phase One of the China/US trade deal is unlikely to be signed this year. The market sold off sharply on the news but regained more than half of the losses by the close. As discussed yesterday, the passing of the Hong Kong Human Rights and Democracy Act is probably making difficult negotiations even more trying. Indications are that the President will sign the act. As we are publishing this a rumor is circulating that China invited the U.S. to Beijing for trade talks.
On Wednesday afternoon, the Fed released the minutes from the October 30th FOMC meeting. Of note, the minutes stated “many Fed officials view downside risks as elevated.” This was clearly a departure from the language used in the FOMC statement as well as the words of Jerome Powell following the October meeting. In both instances, we were lead to believe that the balance of risks was even and in fact, downside risks had been reduced over the prior month or so.
We believe that the meeting between Powell and Trump was probably a heads up to Powell to let him know the China trade deal is running into problems. The change in the Fed’s tone gives them leeway to provide even more stimulus if need be.
Target and Lowes reported strong earnings on Wednesday. Contrary to Home Depot, Lowes increased their sales forecast for the coming quarters. Unlike Kohls and Home Depot, today’s earnings news paints a healthy picture of the consumer.
November 20, 2019
Home Depot (HD) traded 5.50% lower on a weak quarterly earnings report. While earnings exceeded expectations, sales and same store growth missed expectations. Further the company revised Q4 earnings lower. Sales for HD are highly dependent on personal consumption. As such this provides a clue that all may not be well with the consumer. Contrary to this data, home builders seem to believe consumers are able and willing to buy. Housing building permits are now at 12 year highs. Kohls (KSS) also cut their outlook in another warning about the health of the consumer. KSS fell by almost 20% yesterday.
The equity markets were largely unaffected by the news from HD and KSS as QE and FOMO appear in charge for the time being.
According to the American Staffing Association, the Temporary Staffing Index has declined sharply throughout this year and now stands at its lowest level in ten years. Reductions in temp staffing tends to be a first step employers take to reduce costs when they anticipate a slowdown. This index, at times, is a leading indicator of changes in payrolls and the unemployment rate.
Yesterday, the Senate passed the Hong Kong Human Rights and Democracy Act by unanimous consent following the House which had already passed it by unanimous consent. Given the veto-proof majority, Trump will have to sign the deal, which supports the protestors. This could greatly complicate trade talks.
The Treasury announced that foreign holdings of U.S. Treasury securities declined by 1.2% in September. As we have discussed foreign accounts used to account for about a third of Treasury securities purchases, making debt sales easier. Today, they are net sellers and, at the same time, the supply of debt has risen sharply. You can read about this troubling situation in our article Who Is Funding Uncle Sam?
November 19, 2019
As the riots and protests escalate in Hong Kong, it worth reminding you Hong Kong is the world’s third largest financial center, only behind New York and London. The increasing possibility of major disruptions to the flow of funds in and out of Hong Kong will have an impact on global markets and trade. Another thing to consider with Hong Kong is that any U.S. support for Hong Kong is problematic for the Chinese. If the U.S. officially starts siding with Hong Kong and openly provides support to the protesters, we expect trade negotiations will suffer greatly with any trade talk failures likely resulting in increased tariffs. Not surprisingly, on Monday morning, after two days of a well publicized standoff at a University, it was “leaked” that Chinese government officials are pessimistic about a trade deal. Further, they are considering postponing any discussions until the U.S. election occurs.
President Trump, Treasury Secretary Mnuchin, and Fed Chair Jerome Powell unexpectedly met on Monday morning. The timing is interesting given a potential breakdown in trade talks.
The economic data front this week will be quiet. Of note is Jobless Claims, Philly Fed Outlook, and leading indicators on Thursday, followed by the PMI composite FLASH and Consumer Sentiment on Friday. There are not many speaking engagements scheduled for Fed members.
Over the past week we have warned that the major equity indexes are at grossly overbought levels. As shown in Today’s Chart of the Day, the S&P 500 has now reached MACD (moving average convergence/divergence) levels that have been hit seven times since 2018. The correction from each prior instance was at least 5%. We are now at the 8th instance and the only question in our mind is not if but when. Last Tuesday we hedged a portion of our equity exposure against such a sell off. We may add to the position on further market strength.
RIAPRO SITE UPDATE – NEW PORTFOLIO FEATURES
Do to popular request we have added a TRANSACTION BASED portfolio (MyPortfolio New) which now allows you to enter a starting cash balance and buy and sell positions for tracking purposes (same as the RIAPro Portfolios)
The previous portfolios (MyPortfolio Snapshot) remains for a simpler portfolio tracking system along with the Watchlist.
We have also added a new feature which allows you to enter MULTIPLE BUY/SELL Orders at one time when managing your portfolios.
We have lot’s of other new features coming from backtesting to Guru Portfolios so stay tuned for more updates.
November 18, 2019
Not surprisingly Hong Kong’s GDP fell by 3.2% in the third quarter and they officially entered a recession. While much of the weakness is due to the protests and the toll it takes on consumption and tourism, the China-U.S. trade war is also weighing on economic activity.
Retail Sales were slightly better than expectations (0.3% versus 0.2%) but the closely followed core data which excludes autos and gas, was only up 0.1% versus expectations for +0.3%. This number is important to follow as strength in personal consumption has thus far outweighed weakening in the manufacturing sectors and slow global growth. Signs of weakening consumer demand, especially if accompanied by a pickup in job layoffs, will increase the odds of a recession greatly.
Industrial production fell by 0.8% and the capacity utilization rate fell to 76.7% both much worse than expected and a further indication the manufacturing sector is struggling. Despite the increase in the price of oil, import and export prices declined 0.5% and 0.1% respectively. On an annual basis import prices are down 3% and export prices down 2.2%.
After Friday’s spate of weak economic data the Atlanta Fed reduced their Q4 GDP forecast from 1% to 0.3% in-line with the New York Fed at 0.4%. Despite the bad news and lower growth trajectory the markets rallied to even greater overbought levels. Clearly QE is in the drivers site while little else seems to matter.
November 15, 2019
Jobless claims jumped from 211k to 225k. One higher than expected weekly number certainly does not make a trend, but this data point is worth paying attention to in the weeks ahead. Unlike CPI, PPI was stronger than expectations but like CPI the year over year rate excluding food and energy was lower than the prior month. Core (ex food/energy) CPI and PPI is relied upon heavily by the Fed for inflation guidance.
On Thursday’s Real Investment Show podcast, Lance Roberts and Michael Lebowitz talked about inflation and the ways in which the government consistently modifies inflation calculations to help keep inflation readings lower than the real rise in prices. In particular Shadow Stats was mentioned. Shadow Stats simply recalculates CPI using the same exact price data in the BLS reports, but uses the formulas that were used in 1980. As shown in Today’s Chart of the Day, CPI using Shadow Stats logic is now running at about 10% a year versus the current CPI run rate of 1.5-2%. While inflation is impossible to calculate to a single number for a large population with diverse needs and demographics, we believe an approximation of inflation lies between the two calculations shown.
Beyond the current gap between the two lines, what we find to be very interesting is the trends of the two calculations. CPI (red) has been flat to declining, while the Shadow Stats figure (blue) has been flat to inclining. We tend to agree with Shadow Stats that prices in aggregate are rising, which helps explain why so many Americans find themselves in debt and living pay check to pay check.
Jim Bianco, of Bianco Research, recently presented the graph below. As shown, Fed Funds have been trading about 5-10bps below the mid point of the Fed Funds target range. Prior to the recent funding problems and liquidity operations by the Fed, Fed Funds traded 5-10 above the mid point. Jim’s takeaway is that maybe the Fed has supplied too many reserves to the market. If he is correct, Fed Funds should continue to trade at an increasingly greater distance below the midpoint. Might there be another purpose for QE? CLICK TO ENLARGE
November 14, 2019
CPI was higher than expected by .10% on a monthly and annual basis. The increase was largely due to rising oil prices. The annual change in CPI less food and energy fell by .10% versus last month. MBA mortgage applications were strong last week. This is not necessarily an indication of a stronger real-estate market, but most likely buyers rushing to lock in mortgage rates on fears they will increase further. Such activity is typical when rates rise after a period of low rates.
Japan’s GDP rose 0.2%, well below expectations for 0.8% growth and last quarters 1.8% growth. Germany narrowly avoided a recession as their GDP climbed 0.1% versus an expected 0.2% decline.
The key line from Chairman Powell’s Congressional testimony yesterday was the following as reported by Reuters- “Powell repeated in his testimony that the Fed was unlikely to use its remaining capacity to cut rates unless there is a “material reassessment of our outlook.”
In addition, Powell upgraded the Fed’s economic forecast, as they believe the odds of any further slowdown are diminished. The takeaway is that rates will not be reduced further, barring a sharp downturn in economic activity. Currently, a full 25 basis point rate cut is not priced in until the fourth quarter of 2020. There is less than a 50% chance the Fed cuts by April 2020. Based on his statements about inflation and Fed policy from the prior FOMC meeting, the odds of rate hike are slim.
On the topic of Federal Deficits, Powell warned that rising debt levels could impair the government’s ability to boost economic activity during a recession. He also mentioned, correctly, that high government debt levels restrain private investment which has a negative effect on productivity and by default economic growth. This is an important topic that we have written numerous articles on.
Neel Kashkari, quite possibly the most dovish Fed member on the board, was quoted as saying he is “feeling better about the economy.” This is a good indication that those members who voted for more rate cuts than the Fed delivered are starting to coalesce with the Fed view that they are done cutting rates for the time being. If this continues it will make Powell’s job of forming a consensus at the Fed much easier.
November 13, 2019
The NFIB (small business optimism index survey) rose to 102.4 from 101.8, but remains down from the 106.7 average in 2018. There was good news on the small business employment front as there was an increase in the number of those that responded that they are increasing hiring plans and compensation. Small businesses are the largest employers in the U.S.
As we have discussed in prior articles and commentaries, QE has sparked a buying frenzy. A recent Bank of America survey of fund managers “finds investors have traded fears of recession for the FOMO (fear of missing out).“- Per CNBC. The question we need to stay on top of is- will improved confidence in the stock market translate to an uptick in economic confidence and ultimately economic activity?
Keep an ear out for Jerome Powell’s testimony to Congress today and tomorrow for more clues about monetary policy and the overnight funding situation. Also on today’s agenda is CPI. Current expectations are for a +0.3% m/m change and a +1.7 y/y change.
The market got a slight boost yesterday afternoon on a new proposal by Donald Trump to cut the middle class tax rate to 15%. The odds of such a proposal passing the Democrat led House are near zero, but we suspect similar types of tax cuts will also be proposed by Democratic presidential nominees.
Interesting fact- The Dow Jones Industrial Average was unchanged yesterday. The last time the index registered a zero change was in May 2007.
November 12, 2019
Britain’s GDP grew by 0.3% for the third quarter, and at the slowest annualized pace in almost ten years. No doubt concerns over a hard BREXIT and trade weighed on economic activity for the quarter. The market expects a weak, but positive GDP reading from Japan on Wednesday and the possibility of Germany posting a second straight negative GDP, meaning they will be in a recession.
Today’s Chart of the Day compares China’s Hang Seng Stock Index to the S&P 500. The two indexes have tended to be well correlated on a daily basis, yet the S&P is in an uptrend while the Hang Seng is trending lower. Note the Hang Seng has been making lower highs and lower lows since peaking in April, while the S&P 500 has done the opposite. On Monday, the Hang Seng was down nearly 3% while the S&P was only down .25%. Will the S&P 500 follow the Hang Seng in the days to come?
Fed Member Neel Kashkari speaks tonight and again on Wednesday. He has been one of the more outspoken doves, pushing for aggressive rate cuts. Given the Fed’s new wait and see approach for further rate cuts, as relayed by Chairman Powell at the last FOMC meeting, it will be telling to see if Kashkari moderates his stance. If he does appear less dovish, it would a good sign that Powell may have corralled Fed members into a more united front.
On Monday, Bloomberg released an Odd-Lots Podcast interview with Zoltan Pozsar of Credit Suisse. The interview is worth a listen as it provides great insight into the recent surge in repo funding costs and the new QE operation.
November 11, 2019
Consumer Sentiment was on top of expectations and at a similar level as last month. Of note, those voicing concern over the pending impeachment were “virtually non-existent” while a quarter of those surveyed said tariffs were a concern.
Since early September, 10-year Treasury yields have risen by nearly 50 basis points. As a result of longer term bonds rising while shorter term bonds remain somewhat anchored to the Fed Funds rate, the yield curve has steepened. Currently the 2yr/10yr curve is +26 basis points, over 30 basis points steeper from the slight curve inversion experienced in late August.
Economic data this week will be sparse but meaningful. On Wednesday and Thursday the BLS will release CPI and PPI respectively. The current expectation for CPI is for a 0.1% increase while PPI is expected to fall by 0.3%. Following last month’s weak Retail Sales, expectations remain poor with retail sales expected to fall by 0.4%.
Chairman Powell will testify to Congress on the state of monetary policy and economy on Wednesday. We suspect he will face a lot of questions on the repo situation and the new round of QE. Elizabeth Warren has accused banks of creating liquidity problems in an effort to push for a relaxation of regulatory and capital measures. She and others are likely to revisit this charge with Mr. Powell on Wednesday.
The markets will most likely be quiet today as the bond markets are closed for Veterans Day. For all those who served, we thank you.
TRIAL USERS:
As referenced in our weekly newsletter, here is the referenced report on QE-4:
Click The Image To Read
November 8, 2019
Jobless Claims fell slightly to 211k from 219k, showing no signs of increased layoffs. We remain in limbo as to whether the survey data alerting us to labor concerns from employers and employees is a leading indicator of the jobs market or simply a false signal. It is worth noting that the jobless claims and the monthly employment data from the BLS tend to lag other indicators by 2-3 months. Thus far it appears that companies are hiring less. The decision to fire people is harder as skilled workers are hard to find in many industries.
As we have harped on, personal consumption is providing a strong ballast for economic growth. As such, we are on alert for signs that consumption is being impeded by economic concerns or a change in financial conditions. Consumer sentiment, released at 10am today, will help us further asses the mindset of the consumer.
Markets rallied on Thursday morning on talk that China and the U.S. agreed on tariff rollbacks as a precondition to signing the Phase One Trade Agreement. Later that day we learned that there is strong opposition to tariff reductions from Trump’s chief negotiators. The market gave up most of the morning gains as the trade soap opera continues!
The stock market will be open on Monday for Veterans day but the bond markets are closed.
November 7, 2019
Labor productivity fell for the first time in four years due in large part to rising labor costs. An underappreciated culprit in falling productivity levels is the massive amount of share buybacks occurring over the last five years, which has come at the expense of investment. Had corporations invested more into their future earnings power, they would currently be more efficient and better able to offset rising wages. This data is having a direct impact on corporate margins which have been weakening after hitting record levels over the prior few years.
In December 2018 we published DIY Market Forecast, in which we quantified the positive impact on stock returns from rising profits margins (shown below). If profit margins are indeed falling and revenues are relatively flat, the expansion of valuations, which are already at record highs, is the last leg holding stock prices up. CLICK TO ENLARGE
We elaborate further on labor costs and profit margins in Today’s Chart of the Day, courtesy of John Hussman. His graph shows that profits margins are very well correlated to the ratio of labor costs to prices (GDP price deflator). As labor costs rise faster than general prices, corporate profit margins tend to decline. Simply, labor costs are rising faster than corporations ability to pass on higher prices to consumers.
Ray Dalio who manages the world’s largest hedge fund just released a short, but very important, piece about the current stance of monetary and fiscal policy and its consequences. We urge you to give it a read- The World Has Gone Mad And The System Is Broken.
Confidence in Phase one of the trade deal appears to be waning. The signing ceremony for the deal is now being delayed until December as deal terms and a venue/date are being negotiated. That said it appears that Trump is willing to phase out tariffs, which is a key sticking point for the Chinese.
November 6, 2019
In yesterday’s Chart of the Day we showed that there is currently a record number of short positions in VIX futures, attesting to the zealousness in which traders are piling into the stock market. Today’s chart of the day, highlighting the put/call ratio provides more evidence. These charts, and other data we follow, provide a strong signal that a short term correction is overdue.
Yesterday, the Fed transacted $31 billion of overnight repo. The amount of daily repo being used by the banks has been declining recently. The reduced daily amounts are not necessarily a sign that the funding issues have been resolved, but likely due to the fact that new QE operations are increasingly replacing the overnight repo liquidity.
The trade deficit declined in September in part because of reduced trade with China. The U.S. exported more oil than it imported, representing the first surplus in this category since data was first collected over 40 years ago.
ISM-services beat expectations as the service sector continues to remain in economic expansion and, along with personal consumption, is more than offsetting the decline in manufacturing. The lesser followed PMI services index was also above 50, but, unlike the ISM survey, came in slightly below expectations. Within the report was an interesting comment from Chris Williamson, Markit Chief Business Economist-
“With inflows of new work drying up, firms are relying on previously-placed orders to sustain current output growth, meaning the rate of expansion could weaken further in coming months if demand doesn’t revive. Hence we’re seeing jobs being cut at an increased rate among surveyed companies, with employment falling for a second successive month and to a degree not seen since 2009. Such a weakening of the survey’s employment index will likely feed through to the official jobs numbers as we move toward the end of the year.”
JOLTs data is also pointing to a slowing in the labor markets. Per Econoday:
“Hiring has been keeping pace but job openings, in a possible warning sign of slowing for the labor market, have been on the decline. Job openings fell 3.8 percent in September to 7.024 million, which is the lowest total since March last year and is down 5.0 percent from September last year.
Hirings rose 0.8 percent in the month to 5.934 million and, compared to September last year, were up 4.7 percent. The spread between hirings and openings, at 1.090 million, is the narrowest since February last year.
In a further sign of slowing in the labor market, quits fell a sharp 2.9 percent in the month to 3.498 million which hints at less worker mobility and less pressure on wage growth.”
November 5, 2019
After the barrage of economic data last week we get a few more important figures this week. Today, ISM services sector will be released at 10:00 am. The services sector has offset manufacturing weakness thus far. Expectations are for a increase from 52.6 to 53.5. JOLTS (Job openings and labor turnover survey) will also be released at 10:00 am. We will look to see if recent weakening trends in employment surveys continue. If so, it is potentially an early signal to labor weakness not found in last Friday’s BLS report. On Thursday, jobless claims and consumer credit will be released, followed by consumer sentiment on Friday.
With the Fed meeting conducted last week, voting Fed members are now allowed to speak to the public. We look forward to hearing their views on future rate changes, QE, Repo, and the general state of the economy.
Rising equity markets are starting to have the old QE feel to them. Stocks have been rising steadily while volatility has fallen back to historically low levels. At the same time bonds and gold are losing some luster. Within the equity markets, the defensive sectors have taken a back seat to the small and mid cap indexes as well as the higher beta stocks. Today’s Chart of the Day shows that shorts on VIX (equity volatility) futures are at record levels, implying the investors are betting heavily on a rally. This and other indicators of extreme sentiment make us think a correction is due.
Payrolls rose by 128,000 in October and the unemployment rate increased from 3.5 to 3.6%. After taking into account the GM strike which reduced payrolls by 42,000, the data was in line with prior months and close to our estimate of 156,000. Hourly earnings and hours worked met expectations. The only concern within the report is that temporary help service jobs were negative for the first time in nearly three years. Frequently, business owners will stop hiring temp workers or let them go before making decisions on permanent employees. At times it can be a leading indicator.
ISM was weaker than expected at 48.3 but slightly better than last month’s reading. Interestingly, new export orders improved, however employment, new orders, and order backlogs remain at economic contraction levels. Of concern in this report is that the import index is now at its lowest level since 2008. The divergence between GDP and the important index is wide. Are imports being dragged down by the trade war and not a meaningful sign of the economy? Conversely, is the sharp decline in the import index a harbinger of weak GDP readings in the quarters ahead? The graph below shows the widening gap. CLICK TO ENLARGE
Despite the good employment data, the Atlanta Fed cut their Q4 GDP forecast to 1.1% from 1.5%. The revision is more in line with the NY Fed which currently forecasts 0.8% growth in the fourth quarter.
November 1, 2019
Chicago PMI was much weaker than expectations, coming in at 43.2 vs 47.1 last month. The range of estimates from 27 economists was 46.1-53. Today we will look for confirmation of further weakening in the manufacturing sectors when ISM is released at 10am. Expectations are 49.3, an increase from last months 47.8.
Also on the block today is the all important BLS labor report due out at 8:30am. The market is expecting a gain of 90k jobs which is 46k less than last month. The unemployment rate is also expected to uptick from 3.5% to 3.6%. The expected data is weaker than last month in part due to the GM strike which has since been resolved. According to Econoday, the strike reduced payrolls by 50k jobs.
Last week we compared Federal budget deficits to the net amount of debt held by foreigners. Our purpose in providing the data/graphs is to highlight the record funding demands currently being put upon domestic investors. We follow up today with an important point and chart that shows we underestimated the funding problem. Today’s Chart of the Day shows the stated Federal deficit versus the actual government funding needs. The black dotted line is the 3 year moving average which removes volatility to better highlight that the reported deficit has recently been undershooting the government’s true funding needs by $200-400 billion annually. As an example, the stated deficit for 2018 was $980 billion, however the increase in debt, or true funding need for the year was $1.2 trillion.
On the China/U.S. trade front we are getting mixed messages. On Wednesday night China said that they doubt a long term trade deal is possible while Trump is in office. The next morning, Lawrence Kudlow declared that trade talks are “going smoothly.” With the election coming up in a year, we continue to believe that phase one of the deal is likely all that will be agreed upon. The risk to markets and the economy remains a flare up of tensions resulting in increased or expanded tariffs.
October 31, 2019
ADP came in at the consensus estimate of +125,000. Concernedly, job growth for small firms (1-19 employees) is only growing at .08%, far off the 1-2% growth rate of the last 8 years. Our forecast for the payrolls number on Friday is +156,000. It is worth noting however, that the GM strike will reduce an estimated 40-50k jobs, which when factored in moves our forecast closer to near 100,000 which is close to the consensus forecast of +90,000. Over the last 6 months, our model has missed estimates by 26k on an absolute basis and only 4k on an average basis.
GDP was slightly better than expected at +1.9% fully supported by the contribution of personal consumption expenditures of 1.93%. Simply, the consumer is keeping GDP afloat and that is why our focus is on personal consumption trends and data. Not surprising, business investment (non-residential) was down 3%, in part due to trade war anxieties as well as a focus on stock buybacks and dividends over investment.
As expected the Fed cut rates by 25 basis points to 1.50-1.75%. There were two Fed members that dissented on voting for the rate cut. As shown in the red lined version below, the only change of note is the removal of the phrase “act as appropriate” and new language describing what is motivating policy decisions. It appears they will be more dependent on incoming economic data over the coming months.
CLICK TO ENLARGE.
Chairman Powell, during his press conference, confirmed the view that the Fed is pausing and may be done with rate cuts unless economic data weaken. In particular, jobless claims, payrolls, inflation expectations, and retail sales are key data points. This new stance likely means that any economic data surprises will create market volatility.
The most important line of the press conference came when he addressed the possibility of raising rates. To wit: “I think we would need to see a really significant move up in inflation that’s persistent before we even consider raising rates to address inflation concerns.“
Simply the Fed is not raising rates anytime soon.
Happy Halloween!!!
October 30, 2019
Today will be a busy day with the potential for economic data and/or the Fed to move markets. ADP releases their employment report at 8:15 followed 15 minutes later by the BEA release of Q3 GDP. Expectations for GDP are for a 1.7% increase. Our focus will be on consumer spending with consensus expectations of +2.6% growth. While still a nice growth rate, the expectation is well below last quarters strong pace of +4.6%.
Later in the day at 2pm, the Fed will announce their policy stance followed by Jerome Powell’s press conference at 2:30. The market assigns a nearly 100% chance of a 25 basis point rate cut, and we agree that is the likely result. The bigger question relates to the Fed’s next move. For this, we should get guidance from the FOMC statement and the press conference. Given the Fed has lowered rates twice already, maybe three times after the meeting, and is now pumping the market with liquidity, we suspect they will ease off on projections for future rate cuts. Many Fed speakers, including Powell, have characterized the rate cuts as “mid cycle” and “insurance”, therefore if they continue to forecast more rate cuts it raises into question whether they are much more concerned about the economy than they should be if the economy were just hitting a mid-cycle speed bump. We suspect the media will think the meeting is more hawkish than expected.
As if that wasn’t enough, Apple will report earnings after the close.
Currently, the market is pricing in a 60% chance of another rate cut by the end of March 2020. We can follow changes in the March 2020 Fed Funds contract (current price – 98.54) to see how the market consensus changes following the meeting. Every .01 increase in the price represents a 4% increase in the odds of a cut. The opposite holds true for each .01 decline.
The Case-Shiller 20 city home price index fell last month for only the second time since 2012.
October 29, 2019
The market opened higher and rallied throughout the day. The S&P 500 closed at 3039, a record high. We are watching closely to see if this is a false breakout or if there is more upside to go. Based on prior QE one can easily argue there is another 5% or more upside, however economic and earnings fundamentals along with technical divergences leave us concerned. Regardless of fundamentals we remind you that liquidity is a powerful tool.
According to a survey conducted by the National Association of Business Managers (NABE) jobs gains fell to their lowest level since 2012. This is another survey pointing to weaker employment data. Keep in mind, other than slightly weaker growth in payrolls, we are not seeing weakness in jobless claims or the unemployment rate. Friday’s employment report will be another chance to see if that remains true.
We are about halfway through earnings season and both operating and “as reported” earnings per share are down 3% as shown below. Comparison to the prior few quarters of double digit growth is difficult as earnings growth over the last year was boosted by reduced tax rates due to the changes to corporate tax laws. CLICK TO ENLARGE
The Chicago Fed National Activity Index was reported at -.45. The index has a strong correlation with GDP, which is not surprising as it is calculated with 85 measures of economic activity. Based on yesterday’s level, GDP should be at 2%. A reading of approximately -1.50 would correlate with zero GDP growth. The BEA will release Q3 GDP on Wednesday and the current expectation is for +1.7% growth.
There will be a heavy dose of economic data releases this week. Of the most importance will be the following:
Wednesday- ADP labor report and GDP
Thursday- Jobless claims, Personal Income and Outlays, and Chicago PMI
Friday- BLS jobs report, PMI and ISM manufacturing
October 28, 2019
The S&P 500 is trading higher by about 10 points which puts it in position to set an record high today.
Today’s Chart of the Day graphs the money supply, in particular the M1 -Money Stock. During episodes of QE the Fed did not print money to buy securities, instead they swapped bank reserves for the assets. This is why they pound the table and insist that they did not print money. However, what is left out of the story is that the newly created reserves are then used by the banks to create loans. Keep in mind that all debt is money as anyone who is owed money via a loan has a claim on dollars. The important takeaway, as we begin a new round of QE, is that QE does not create money but it does create the fodder to allow banks to print money. If you notice in the graph the slope of the line has just begun to increase from the prior pace.
As we have discussed personal consumption accounts for almost 70% of GDP. Therefore the odds of a recession in the coming months depends heavily on the state of consumption. We have stated concerns about various surveys and recession headlines but other than recent retail sales data, we have seen little hard evidence the consumer is slowing meaningfully. One area however that is catching our attention are rising credit problems, especially in the credit card and auto sectors. To wit, on Friday Moody’s said that sub-prime auto loans “are souring at the fastest rate since 2008, with more consumers than usual defaulting within the first few months of borrowing.” While subprime auto loans are a relatively small component of consumer lending it does tend to be a leading indicator of credit issues. Stay tuned.
The weekly GDP Nowcast, the New York Fed’s public GDP forecast now stands at +1.9% for the third quarter, reported on Wednesday, and +0.9% for the fourth quarter.
October 25, 2019
Phase one of the China/US trade deal largely rested on tariff relief and an increase of agricultural/hog purchases by China. Yesterday, China committed to purchasing $20 billion of agricultural products from the US. The good news is that the amount is almost double that which China has bought since the trade war started. The bad news is that it is actually slightly below the annual average which they bought from the US between 2014-2017. Needless to say, Phase one of the deal does little to advance trade between the countries.
Durable Goods Orders were weaker than expected, coming in at -1.1% versus consensus of -.7%. The ex-transportation and core numbers were also weaker than expectations. Jobless Claims continue to hum along showing no signs of labor weakness. The four week moving average dropped slightly to 215k.
Median Home Sale prices, shown below, have been declining despite lower interest rates. The Shiller 20 city home price index, while still rising, had dropped to its lowest growth rate in the last 5+ years. While lower mortgage rates have certainly boosted demand, these graphs show the marginal benefit of lower rates is much less than in years past. CLICK TO ENLARGE
October 24, 2019
Today’s Chart of the Day is probably one of the most important macro charts to understand, yet is so underappreciated. The chart highlights that net purchases of U.S. Treasury debt by foreign investors (central banks, governments, corporations, and citizens) have been negative over the last two years. This is occurring as deficits topple the $1 trillion mark. In other words, not only are trillion dollar deficits being entirely funded with domestic funds, but domestic funds must also absorb the foreign net selling. To better understand the implications of this new dynamic, we suggest reading an article we wrote in June titled Who is Funding Uncle Sam?
We believe the funding situation is one causes of the overnight funding issues and the sudden introduction of QE.
Speaking of which, the Fed announced that they will double the size of their overnight repo facility to $120 billion and two week term repos will increase from $30 to $45 billion.
There is a good amount of economic data coming out this morning. Of note is Durable Goods (expectation -.7%), Jobless Claims (+214k), and PMI (composite 50.9, manufacturing 50.5, and services 51.0).
WeWork, which was only a few days away from doing an IPO at a valuation of $47 billion a month ago, now says it would have run out cash next week had SoftBank not purchased it for only $8 billion. WeWork is a reminder that valuations in both the public and private markets are excessive, and in many case unjustifiable.
Later this morning we will release To Buy QE, or Not To Buy QE. The article provides a construct to help you think about the effect that QE 4 may have on asset prices. It uses quantitative measures to project returns based on prior QE, as well as qualitative commentary that points out the differences between today’s environment and those in the past.
October 23, 2019
The Fed conducted their third QE4 purchase yesterday and, like the two prior ones, it was met with huge demand from the major banks. The Fed bid for $7.5 billion of Treasury Bills and received offers to sell over $40bn, resulting in a nearly 6x over-subscription rate. The prior two operations were also over-subscribed by at least 5x, meaning that the banks are still hungry for reserves. Overnight repo continues to trade 10-20 basis points above where it should, which is also a warning that liquidity is lacking and/or a credit issue is looming.
Senator and Presidential Candidate Elizabeth Warren is asking Treasury Secretary Steven Mnuchin for more information on the recent overnight repo funding issues. Her concern appears to be that the banks created or magnified the problems in part to have regulations and capital limits lessened. Per Warren and CNBC- “These rules were designed to ensure that banks have enough cash on hand to meet their obligations in the event of another market crash,” Warren wrote in a letter dated Friday and released Tuesday. “Banks are reporting profits at record, levels, and it would be painfully ironic if unexplained chaos in a small corner of the banking market became an excuse to further loosen rules that protect the economy from these types of risks.”
This election could get interesting from a market perspective if other candidates start questioning what the Fed has done and what they are currently doing.
Poor earnings and earnings outlooks are pushing stocks lower this morning, in particular Texas Instruments (TXN), Caterpillar (CAT), and Chipotle (CMG). Boeing (BA) will report earnings this morning.
October 22, 2019
The administration continues to support the stock market with positive statements regarding trade talks with China. Yesterday morning Lawrence Kudlow told the media that there is a chance that the planned tariff hikes in December will get called off. The S&P 500 closed up 20 points to 3006, which is only 19 points below its all-time high set in July.
With BREXIT still up in the air, Today’s Chart of the Day provides a nice schematic with expected odds for all of the possibilities. Based on the illustration, the odds are clearly in favor of an orderly BREXIT.
CNBC ran an interesting article yesterday based on a letter that Goldman Sachs sent to clients. The article starts: “Corporate buybacks are “plummeting” as companies tighten their purse strings, and it could have a big impact on the market, Goldman Sachs warned.” There is no doubt that corporate buybacks have driven stock prices well beyond valuation norms. We have warned that at some point debt levels will preclude companies from continuing to buy back shares. Combine Goldman’s sentiment with a recent WSJ article accusing bond rating agencies for being lenient on heavily indebted corporate issuers and the tide on buybacks may be turning. The WSJ article is linked HERE.
Third quarter earnings will be a key driver of stocks over the next few weeks. To see what the calendar holds in store, click on the Research tab and then Dividends and Earnings. Then click on a date and below the calendar you will find a listing of companies reporting that day.
October 21, 2019
The BREXIT saga will most likely be extended until February 2020 as Parliament forced Boris Johnson to ask the EU for another deadline extension and the EU delivered. If Parliament cannot pass the deal Johnson struck with the EU over the coming days, a general election will be held.
Japanese and Korean import/export numbers were weak last night attesting to the poor shape of global trade.
Today’s Chart of the Day shows an interesting graph from Crescat Capital. The difference between inflation (CPI) and inflation expectations has expanded to levels that have only been seen before or during recessions. If we are heading into a recession, we should expect CPI will fall and likely more than inflation expectations, as had happened the past three times the difference between the two was positive. It is important to caution however, inflation is the most underappreciated risk to the stock and bond markets. In an inflationary environment the Fed will need to raise rates and possibly reduce their balance sheet to stem inflation. Such monetary action would not bode well for risk assets that have risen appreciably on the back of ultra-easy Fed policy.
The following appeared in a WSJ article on Friday- “In an Oval Office meeting, there was consensus “the economy was really strong…and that what’s going to get him re-elected…,” said economist Stephen Moore.” The point is, and always has been, that a sitting President has much better reelection odds during a strong economy. We expect, Trump, like many prior Presidents, to do whatever is in his power to boost economic activity and push stocks higher. Whether he can do this or not is the million dollar question.
October 18, 2019
The weekly Jobless Claims data continue to show no signs of trouble in the labor market. The four week moving average increased slightly with new claims rising from 210k to 214k. We will not be concerned until the four week moving average markedly trends higher and new claims broach 250k. It is important to note that BLS employment data tends to be a lagging indicator.
There are five Fed members speaking tomorrow. Most important will be Vice Chair Richard Clarida at 11:30 am. Interestingly, he is speaking at a CFA conference entitled : Fixed Income Management 2019 Late Cycle Investing. Remember the Fed has characterized the recent rate cuts as “Mid-Cycle” adjustments/insurance. In all 5 speeches close attention will be paid for clues as to the rate decision at the coming October 30th meeting and any more discussion of the overnight funding problems. This will be the last speech before the Fed’s self-imposed media blackout starts on Saturday and continues through the next Fed meeting.
The Wall Street Journal published an article this morning which basically makes the case for the Fed to cut rates by 25 basis points at the coming meeting and then put further rate cuts on hold. The Fed often uses the WSJ and in particular the author of the article, Nick Timiraos, to alert the market to what they are currently planning in regards to policy. The link to the article is HERE.
All eyes will be on the UK this weekend to see whether or not Parliament will accept the BREXIT terms that Johnson and the EU have agreed to.
China’s third quarter GDP fell to 6%, .2% below last quarter and .1% below expectations. The rate of growth is the lowest in over 20 years.
October 17, 2019
Based on news reports this morning it looks like the EU and UK have reached a BREXIT deal. It also appears that Boris Johnson, UK’s Prime Minister, may have enough support to get a BREXIT compromise through Parliament by Saturday. Saturday is a self-imposed deadline for the UK to reach internal agreement. Failing to reach agreement would likely lead to a vote of no confidence and make a BREXIT deal with the EU more difficult to reach before the October 31 deadline. Over the last five days the pound has risen sharply from 1.22 to 1.29 per USD in anticipation of a deal being reached.
The overnight repo markets are again showing some worrying signs. Yesterday, overnight borrowing rates traded 10-15bps higher than where they have been over the prior two weeks. Further, the Fed’s overnight repo operation was oversubscribed to ($80.35bn in bids versus an offering of only $75bn). Given the amount of temporary and permanent liquidity (QE) the Fed is supplying the system, the current increase may be tipping us off to a credit issue and not necessarily a liquidity issue as the Fed leads us to believe.
Retail Sales, a good barometer on personal consumption which accounts for nearly 70% of GDP, was well below consensus forecasts falling 0.3% versus an expected increase of 0.3%. The reading was below all of the 69 economist estimates. Core retail sales, less auto and gas, were flat versus expectations of +0.3% and a prior month gain of 0.4%. The market is clearly keying on incoming data such as Retail Sales for guidance on what the Fed may do. Prior to the data, Fed Funds futures were priced for about a 50/50 chance of a rate cut at the October 30 meeting. The odds rose to 80% after the Retail Sales data.
The Fed’s Beige Book which describes economic conditions across the Federal Reserve districts pointed to continued expansion in most areas. While it mentioned some layoffs in the manufacturing sector its overall assessment of the labor markets was strong.
October 16, 2019
The market surged yesterday on __________ (fill in the blank). It is pointless to search for catalysts or market moving headlines to fill in the blank. Equities opened with a panic bid on the basis of nothing and rallied throughout the day.
The price surge coincides with the first day of QE and that is as good a guess as any to explain yesterday’s rise. It was interesting that the defensive equity sectors, gold, and bonds that were market leaders, lagged yesterday. The price surge and sector rotation trade may be marking the beginning of a new risk-on trade higher as we saw during QE 1, 2, and 3. We will pay close attention to technical resistance levels to help confirm if this is the case so we can act appropriately.
If you are not satisfied with QE as the driver, here the biggest headlines, most of which are not market friendly:
JPM released earnings yesterday and the market focused on the solid overall income numbers yet glanced over disturbing credit news. To wit, Lisa Abromowicz of Bloomberg tweeted the following:
“At JPMorgan, charge-offs surged 33% to $1.37 billion from $1.03 billion last year. I’m curious to hear how much this stemmed from either riskier loans or weakening consumer & corporate credit.”
In yesterday’s Chart of the Day we showed the growing divergence in yields within the junk bond sector. In particular, the lowest rated bonds, CCC, have increased in yield, while BB and B bonds have been relatively flat. In response to a subscriber asking us for more data on the topic, we expanded the graph and show it in today’s Chart of the Day. The graph includes the last two recessions as well as investment grade BBB bonds. A few points worth discussing:
Prior to the recession of 2001, CCC spreads started widening well in advance of the recession.
About a year before the great financial crisis, spreads of all corporate bonds widened in unison.
CCC rated bonds are much more volatile than BB and BBB-rated bonds and therefore frequently sends false signals.
There has been no uptick in yields in BB and BBB over the past year despite CCC bonds widening.
It is too early to tell if the rising CCC yields is a harbinger of things to come or a technical gyration due to specific bonds such as WeWork and/or those of energy companies which make up a decent amount of the CCC sector.
October 15, 2019
There were no economic data releases or Fed speakers yesterday due to Columbus Day. Of importance this week will be the release of Retail Sales data on Wednesday and Jobless Claims on Thursday. In both reports we are looking to see if worrying signs in various labor and sentiment surveys is showing up in hard data. There are also a number of Fed speakers throughout the week so we will be on guard for more clues about the new round of QE and what it might mean for interest rate policy at the coming October 30th meeting.
Having a few days to digest the trade news we have a few thoughts worth sharing. The supposed Phase 1 deal is a good sign as it means the two sides are amicable and willing to talk. It signals a de-escalation of trade tensions which should relieve some anxiety of corporations and consumers. On the margin it should help economic activity as the threat of more tariffs is reduced, at least temporarily.
The problem however, is that the agreement is very limited in scope and fails to touch on the bigger picture items like IP and geopolitics. These items will be much more difficult to negotiate and may cause a re-escalation in tensions between the two countries when they are addressed. Given the difficult nature of reaching future agreements and the election coming up in a year, we would not be surprised to see trade negotiations tabled and slowly faded out of the news, leaving the status as it is today.
Trade activity between the U.S. and China is certainly being depressed in part because of the trade war. China reported that exports to the U.S. fell 10.7% and imports of U.S. goods dropped 26.4%. The results, reported by Reuters, cover January through September.
The third quarter earnings calendar is starting to heat up. On Wednesday 39 companies will release earnings including Netflix, Johnson & Johnson, and IBM. For the complete list of companies reporting, mouse over the Research Tab and click on Dividends and Earnings. A calendar will pop up. When you click on a specific date, the listing of either earnings or dividends for that day will display below the calendar. The dates can also be found in the Portfolio section for stocks in your customized portfolios and in the RIA Pro portfolios. Click on Dividend to the right of the portfolio graph and then select Earnings. The companies are sorted by date.
October 14, 2019
Trump announced phase one of a trade deal with China on Friday afternoon. This morning we are waking up to news that China wants more discussions before signing phase 1. The market sold off Friday after the deal was announced and a little lower this morning as well. While progress is being made, investors are signaling that the deal is not that different from prior statements in which China said they would buy agriculture in exchange for tariff relief.
The Fed surprised the market on Friday and announced that they will start buying $60 billion of Treasury Bills monthly starting next Tuesday. The purchases will continue into the second quarter, meaning the Fed plans on purchasing at least $320 billion of assets. The Fed will also continue with temporary repo operations. The suddenness of the announcement leaves us wondering. Why the urgency to announce the action on Friday, when there is a Fed meeting in less than three weeks in which such an announcement would have been more appropriate? When answering the question, keep in mind that the temporary repo facilities are working well to alleviate the funding problems. Might there be another reason for this sudden change? We believe there is a credit issue with a bank or numerous banks, most likely European.
As Powell alluded to earlier in the week, this operation is not QE. As we discussed in QE By Any Other Name, if it walks like a duck and quacks like a duck it is a….. The stock market soared on the news, albeit it was already doing well based on the probability of a trade agreement with China. The yield curve steepened as shorter maturity Treasuries were flat to lower while longer securities rose in yield. The 3m/10yr curve was 8bps stepper on Friday.
On a year over year basis import and export prices both fell by 1.6%, despite the rise in oil prices in early September. Along with CPI and PPI, Friday’s Import and Export Prices report paints the same picture of deflationary impulses at work.
October 11, 2019
Stocks are trading sharply higher this morning as a trade deal seems likely to emerge from this week’s trade meetings. At 3:30 today, Donald Trump will meet with a leading trade negotiator from China and it appears a deal could be announced following the meeting. While the market is giddy about the prospects of putting the uncertainty of trade talks behind it, we believe the terms of the deal and importantly how it will treat past and future tariffs are important to assess before betting on the market beyond the next few days. Daniel Lacalle, a frequent guest on the Lance Roberts podcast, has an interesting take in CNBC on what to expect from a trade deal. The link is here – A US-China Trade Deal May Not Be The Catalyst The Market Is Expecting.
Further helping sentiment this morning is renewed hopes of a BREXIT agreement before the coming October 31st deadline.
CPI was slightly weaker than expected showing no change month over month and 1.7% inflation year over year. Jobless claims were strong at 210k and not revealing the labor weakness we have seen in other reports and surveys.
The following quote, as reported by Market News International, caught our attention yesterday: “although we can reduce interest rates further, the side effects of monetary policy are becoming more and more evident and more and more tangible” – European Central Bank (ECB) Vice President de Guindos
This quote follows similar comments by officials from the Bank of Japan (BOJ). Essentially they are finally figuring out that excessive monetary policy, including negative rates and QE, has its limits and more importantly, consequences. As far as consequences, little to no economic growth for almost a decade, along with the slow death of European and Japanese banking systems is finally catching their attention. We hope the Fed is paying attention.
The University of Michigan Consumer Sentiment report will released at 10am. Current expectations are for a slight decline from 93.2 to 92.
October 10, 2019
Following unexpectedly lower inflation in Tuesday’s PPI report, we get CPI today, the more important gauge of prices. Current expectations are .1% and .2% increases month over month and year over year respectively.
In yesterday’s JOLTs report, job openings fell from 7.217 million to 7.051 million. The number is still historically high but has been fading for a year as shown below. Hires and quits also fell, tipping off further signs of labor weakness. While the overall data in the report is healthy, the report lines up with the latest BLS employment report and numerous employment sentiment surveys that give us concern. We will watch today’s weekly jobless claims data for further confirmation. Jobless claims are expected to come in at 219k, about 7k greater than the running four week average. CLICK TO ENLARGE
Trade talks with China start today so expect heightened volatility based on a deal/no deal or even just rumors and Tweets. Last night was extremely volatility as rumors were flying around that the Chinese delegation would leave talks a day early. The story was refuted by the administration. We still believe there is a better than 50/50 chance a trade-lite deal being announced. If so, we will focus on whether or not there any changes to tariffs. The potential market’s reaction is hard to gauge. A deal with reduced tariffs may pacify the market and ease concerns about slowing growth. However, a partial deal, may leave investors with concerns that little was accomplished and the possibility for more tariffs and other actions in the future.
The Fed released the minutes from their September 18th meeting. In general there was a lot of different views on the future path of monetary policy. Some members want to end rate reductions while others think more cuts are needed. The topic of using the balance sheet to help the overnight funding issues arose but, based on the minutes, was not discussed at length. Overall, the minutes did not shine much new light on monetary policy.
October 9, 2019
Yesterday afternoon Chairman Powell said the Fed will increase its purchases of short term Treasury bonds. Within this speech he went out of his way to claim that such actions do not constitute QE. In particular, he stated the following: “I want to emphasize that growth of our balance sheet for reserve management purposes should in no way be confused with the large-scale asset purchase programs that we deployed after the financial crisis.” He then stated: “In no sense is this QE.” The Fed is trying to alleviate the overnight funding shortage via QE, but they want to do so without calling it QE. For more on this “sleight of hand” read our article published last week titled QE By Any Other Name.
Fed member, Neel Kashkari followed later in the day by saying “Fed policy makers now view Quantitative Easing (QE) as a tool in its tool kit.”
Shortly after Powell laid the ground work for a new round of “QE” the market started rallying. The gains were quickly given up as President Trump imposed visa bans on Chinese citizens involved in humans rights abuses. The market recovered some losses overnight on rumors that China would buy more soybeans from the U.S. The bottom line is try to ignore the trade headlines. We suspect the market will continue to get whipsawed on headlines and tweets going into this week’s trade negotiations.
BREXIT negotiations are heating up with both sides publicly blaming each other for non-compromise on key issues. It is increasingly looking like the exit will be disorderly when the October 31st deal deadline comes. A no-deal exit will result in economic consternation in Europe and the UK. This comes at a time when Germany is likely already in a recession and other European nations are not far off. The economic effects will not be limited to the Euro region.
Producer Prices (PPI) surprised to the downside falling .3% versus expectations for a .1% increase. The year over year change also dropped to 2% from 2.3%. The market will pay closer attention to CPI tomorrow for confirmation. A lower CPI would provide the Fed with a better rationale to cut rates later this month.
October 8, 2019
As we noted in yesterday’s commentary and witnessed since then, the markets will be volatile as trade comments from the U.S. and China will be overly scrutinized for clues about the progress of this week’s talks. We urge you to resist trading on these comments as they are largely a public display meant to sway negotiations. It is worth noting China appears adamant that IP and government subsidies are not on the table. These are the key items that Trump and Navarro have argued must be changed.
Trump understands that a trade “victory,” even if not a full deal, helps his reelection odds. We continue to believe there is a wide chasm between the two parties but we expect a deal, likely lacking in specifics and meaningful reform. If we are correct, will a “trade-lite” deal be enough for the markets and will it ease the worries of corporations that have been reducing output and investments?
There is not much economic data being released this week to take the markets mind off of trade. That said, the BLS will release PPI at 8:30 and CPI on Thursday. If the recent upticks in both data points continue, the Fed will find it more difficult to cut rates at the upcoming Fed meeting. The market is priced for a near 100% chance of a 25bps cut at the October 30th meeting.
The price of gold slipped 35 points over the last week. While gold was overbought and certainly technically due for a pullback, Zero Hedge leads us to believe that a lack of Chinese participation due to China’s week long Golden Week holiday also played a role. The following graph shows the performance of gold during Golden Week and in the week or two afterwards for the last 6 years. CLICK TO ENLARGE
October 7, 2019
Trade deal jitters are weighing on the market this morning. Last night China said they were reluctant to make a broader level deal. In particular they said they would not negotiate government subsidies and other bigger ticket items the U.S. wants included in a deal. Keep in mind, last week Trump and trade negotiator Peter Navarro made comments that they will only settle for a full deal, including the items China said are not negotiable at this time. This may seem grim but we caution, this may easily be negotiation tactics by both sides and not necessarily a breakdown of talks. The market will be volatile heading into the talks later this week.
The employment report was a mixed bag. Payrolls were slightly weaker than expectations, increasing by 136,000 in September versus a consensus estimate of 145,000 and a revised prior month of 168,000. On the positive side, the unemployment rate fell to 3.5% from 3.7%. Most concerning is that average hourly earnings were flat versus a gain of .4% last month and estimates of +.3%. The year over year change in hourly earnings fell to 2.9% from 3.3%. The BLS employment report tends to lag other labor data but the earnings data is another sign of cooling in the labor market.
The market popped higher on the employment data as it supports the notion of a weakening labor market which in turn provides the Fed more leeway to cut rates on October 30th. Further supporting the market on Friday were numerous headlines from Lawrence Kudlow and President Trump in relation to the possibility of a trade deal when China and the US meet Thursday and Friday.
The New York Fed announced they will continue “emergency” repo operations to November 4th including term repo options and overnight funding. As judged by the fact that the Fed’s balance sheet continue to rise, short term bank funding needs have not alleviated. Friday’s announcement makes it possible the Fed will announce some sort of permanent funding (QE) at the October 30th FOMC meeting. The date, November 4th, allows the short term, temporary measures to help banks get past month end balance sheet constraints and would give the Fed a few days to begin more permanent actions if they are announced on October 30th.
Jerome Powell will speak on Monday, Tuesday and Wednesday. The minutes from the prior Fed meeting will come out on Wednesday. In a speech on Friday, did not discuss the short term funding problems. He also didn’t provide much guidance as to his views on a rate cut. He did say the economy is “chugging along despite the headwinds it faces.”
October trading has been volatile thus far, with three of the four trading days having moves of greater than 1%.
October 4, 2019
The ISM- Service Sector Survey was weaker than expected at 52.6 versus 56.4. This is the lowest rate in three years and further confirms the weakness we are witnessing in the manufacturing surveys.
On Wednesday, the Conference Board CEO Confidence Survey reported that expectations of corporate executives for the next 6 months has fallen to levels last witnessed at the trough of the prior three recessions. On a year over year basis the confidence reading is the lowest since the late 1970’s. These two graphs can be found in today’s Chart of the Day.
Chairman Powell will speak at 2pm this afternoon. With Fed Funds futures back to pricing in a nearly 100% of a cut at the October 30th meeting it will be interesting to see if he goes along with the market or gives the market reason a for pause.
Jobless claims rose slightly to 219k, but have yet to reflect the employment concerns we have seen in consumer and corporate surveys. Today’s jobs report will shine more light on the employment picture. The table below, courtesy of Econoday, contains expectations for the 8:30 monthly employment report. CLICK TO ENLARGE.
October 3, 2019
Late yesterday afternoon, the U.S. announced they will put tariffs on European aircraft, agriculture, and other products. The tariffs are effective on October 18th.
The ADP report showed a gain of 135k jobs in September which beat the consensus forecast of 125k. Last month’s report was revised lower by 48k from 195k to 147k. The average ADP jobs growth for the last 12 months is 177k, despite markedly slower growth recently. Today’s Chart of the Day shows that the six month average is hitting the lowest levels since the recovery from the Financial Crisis.
With ADP data in hand, our model estimates a gain of 162k jobs in Friday’s BLS employment report. Based on other employment data released over the last two weeks we believe there is a decent likelihood the number falls far short of our estimate and the streets estimate of 145k.
The S&P fell 1.74% yesterday which marked the first time the index had back to back declines of more than 1% this year.
While Europe has started back up QE and rumors abound about the Fed introducing a new round of QE, Japan is taking QE in a different direction. The BOJ announced they would trim their domestic bond purchases but boost buying of foreign bonds. This is partially due to the fact they own over 50% of Japan’s outstanding government bonds.
The BOJ has been much more aggressive with QE than Europe or the U.S. Currently the BOJ’s balance sheet stands at 102% of Japan’s annual GDP. That dwarfs the Fed’s balance sheet at 18% of GDP and the ECB’s at 39% of GDP. Buying foreign bonds will provide a steady bid to U.S. Treasury bonds as they are the most abundant and liquid of sovereign bonds. Doing so would also be appreciated by President Trump and might curry them favor in any trade disputes. It should also help Japan’s exports as it will put pressure on the Yen.
Australia, feeling the effects of the slowdown in China and the trade war, cut their overnight interest rates to 0.75%, the lowest on record. Further, they said more rate cuts may be needed as well as other measures, which we assume means QE.
October 2, 2019
ISM Manufacturing fell to 47.8 and further into economic contraction. Today’s reading compares to 49.1 last month and expectations of 50. As we have been recently harping on, employment is showing signs of weakness across a few different indicators including ISM. The ISM Employment sub-component came in at 46.3 versus 47.4 last month. Also of concern, as shown below, new export orders continue to decline and are now below any level since the 2008/09 recession. On the brighter side, the lesser followed PMI Manufacturing rose to 51.1 from 50.3, however, some of the commentary included weaker labor market signals.
The weak report immediately pushed the market lower and it slid throughout the day, with the S&P closing down 38 points to 2938. This weekend’s newsletter, “Trade Deal” Is Coming stated: “(S&P 500) support at the 50-dma, which coincides with the January 2018 top, but a break of that level will put the 200-dma into focus.” The 50-dma is currently 2947, a level which has proven to be support and resistance since 2018. The 200-dma is over 100 points lower at 2835.
Today’s Chart of the Day by Teddy Vallee shows a huge divergence between the reliable relationship between ISM and annual changes in the S&P 500. if the relationship holds up and the stock market is right, ISM should rise to the upper 50s. If, however, the market is wrong the current 20% gains could quickly turn into double digit annual losses.
ISM in the Eurozone fell from 47 to 45.7 led by Germany 43.5 to 41.7. Italy, France and Spain were also lower with Italy and Spain in contraction, while France (50.1) barely clings to expansion.
October 1, 2019
We should gain more clarity on Fed policy this week as a host of Fed members speak. Most importantly, Vice Chair Richard Clarida will speak this morning and Chairman Powell on Friday afternoon. We expect the speakers to shine more light on the overnight funding market troubles and how the Fed may provide liquidity/stability to these markets in the future. As we noted last Friday, the street is increasingly thinking that a moderate amount of QE will be executed to provide a more permanent solution to the problem.
ISM and PMI manufacturing data will be released this morning followed by their respective service sector surveys on Thursday. ISM manufacturing fell into contraction last month with a reading of 49.1. The estimate for today’s number is 50.0. PMI was slightly above contraction levels at 50.3 last month and some improvement to 51.0 is expected today.
On Monday, the Chicago Fed Manufacturing Report came in at 47.4 versus expectations for 50.4. The internals of the report are troubling for future activity. Per Econoday- “New orders fell sharply in the September report, falling 7.6 points to 48.5 which points to generally weak activity for this report this time next month. Employment is deeply below breakeven 50 at 45.6 and near another 10-year low.” This report provides another sign the employment picture may be worsening in the months ahead.
ADP will be released on Wednesday followed by the BLS September Jobs report on Friday. The current estimate is for a 145,000 increase in payrolls, which would be a 15k improvement from last month, however 36k below the average gains from the prior 12 months. We will provide our estimate once the ADP data is released.
Crude oil traded close to $54 yesterday, which is below the level it was trading at just prior to the attack on Saudi oil facilities. As such, traders are essentially pricing in near a zero chance that any retaliatory actions will be taken against Iran.
September 30, 2019
Early morning gains on Friday were erased when Trump threatened China with limits on U.S. investments into China. Per CNBC- “Trump administration officials are discussing ways to curb U.S. financial exposure in China, including a block of all American investment in the country, a person familiar with the talks told CNBC. Though the person cautioned that the discussion was still in early stages, such an action could send shockwaves throughout financial markets and involve the billions of dollars in investments tied to major indexes.”
Lost in the commotion of the US/China trade war is a brewing trade war between Japan and South Korea. Both countries are technology giants, supplying a significant number of parts and final products to the world. The conflict not only disrupts global supply chains, but any resulting tariffs will likely result in higher prices of technology products. For more on this please read the following article from Bloomberg: Japan-Korea Trade War IS Bigger Problem Than You May Think: S&P.
Last Friday we discussed Peloton and its poor IPO. The following comment from Peter Bookvar (@pboockvar) boils down the situation with Peloton, WeWork and other unicorn companies from a macro perspective: “Valuation revaluations continue w/Peloton & Endeavor following WeWork, Uber, Lyft, etc. This is not an issue w/IPO market, this is a rethink on excessive multiples relative to earnings, or lack thereof. It’s a sea change at this stage of cycle.”
Today is quarter end which means that funding pressures could be more volatile as banks are typically handcuffed from actively lending due to balance sheet constraints.
With the quarter ending today and GDP estimates for the third quarter firming up, the latest forecast of the Atlanta Fed is 2.10%, as shown below, and the New York Fed at 2.06%. CLICK TO ENLARGE
September 27, 2019
Two former Fed officials wrote a blog post recommending the Fed should increase its balance sheet by $250 billion over the next 6 months. That was followed later in the day by a CNBC article which quoted Morgan Stanley as saying they think the Fed will increase their balance sheet by $315 billion over the same period. In their respective opinions, the permanent balance sheet increases would alleviate the daily funding issues the Fed is grappling with now. Permanent actions, as they prescribe, regardless of the spin that may be employed, is QE. Chairman Powell stated at the last Fed meeting that he would not employ monetary policy (QE/lower rates) to solve the funding shortage. We are guessing the odds are better than 50/50 that he will.
Peloton (PTON) was IPO’d and opened trading at $29 and then fell sharply throughout the day to close nearly 10% lower at 26.20 In the wake of evolving problems at WeWork, investors may be getting a little skeptical of “unicorn” companies with no profits.
The Euro continues to slide against the dollar. As shown below the euro is approaching a key long term line of resistance (green line). If it breaks through this line, the next stop could be the bottom of the channel as denoted in red. CLICK TO ENLARGE
Oil and gold are trading lower this morning as tensions in the middle east may be easing due to a partial cease fire agreement between Yemen and Saudi Arabia. Iran is thought to be behind many of the attacks on Saudi Arabia coming from Yemen.
September 26, 2019
A headline regarding trade perked the market up yesterday and seemed to put at ease the impeachment hearings that worried the market on Tuesday. – U.S PRESIDENT TRUMP SAYS A TRADE DEAL WITH CHINA COULD HAPPEN SOONER THAN YOU THINK.
Despite the Presidents trade optimism, the Chinese Yuan has been quietly depreciating against the dollar. With trade talks coming in mid-October, we want to see if the devaluation continues. If it does, it is not a good sign that a potential deal is in the making. China is using a weaker currency to offset tariffs to some degree. The graph below highlights the steady depreciation of the Yuan versus the dollar over the last two years. Note- a higher Yuan means more Yuan are need to buy a dollar, ergo a higher number represents a decreasing value. CLICK TO ENLARGE
The Fed increased the sizing of their daily overnight Repo operations to $100bn and 14 day term repos to $60bn. The liquidity crunch is worsening not improving.
The dollar index soared yesterday and with it bonds, commodities, and gold sold off.
Weekly Jobless Claims will be released at 8:30. As we noted yesterday, the recent Consumer Confidence survey showed worrying signs about employment prospects. Going forward, Jobless Claims will be on our radar as we should expect to see increasing claims if an uptick in the unemployment rate is coming.
September 25, 2019
After a strong overnight session on Monday night in which the S&P reclaimed 3,000, the S&P fell 40 points from the high and closed down 25. The action was similar to trading Sunday night into Monday. Every time the index gets above 3,000 sellers enter. The excuse for the sharp selling on Tuesday was the opening of House impeachment hearings on Donald Trump. We believe the real reason is the Consumer Confidence report.
Consumer Confidence fell sharply by 10 points. Certain details, however, are even worse. The consumer is now worrying about employment as detailed by a surge in the percentage of those surveyed saying “jobs are not plentiful.” The increase was the largest in nearly 20 years. Worse, expectations for income fell by the greatest amount since 1991! As we have discussed, we are looking for signals that the consumer is reducing spending in light of the seemingly daily headlines focused on the potential for a recession. This is a first clue that consumer behaviors are changing. We want to see more survey data and hard economic data to further confirm.
The Richmond Fed index fell back into contraction at -9 versus a prior level of 1. Shipments and new orders, which had improved in the prior month, led the decline.
Despite the recently introduced liquidity accommodations provided by the Fed, there are emerging signs that the issues in the repo funding market is not over. Yesterday, the Fed conducted their first term repo auction and it was 2x oversubscribed. The first of three term repo auctions for $30 billion with a 14 day term drew the interest of $62 billion in bids. The Fed also auctioned off $75 billion of overnight repo. Despite over $100 billion of repo between the two auctions, repo rates traded at 2.10% in the morning, which is about 15-20 basis points above where it should be.
For a full write up of our take on the recent problems in the funding markets and what it means from a broader financial markets/banking perspective please read our latest on Real Investment Advice – Who Could Have Known : What the Repo Fiasco Entails.
September 24, 2019
On the heels of poor PMI data yesterday, ECB President Mario Draghi stated “Euro area growth momentum has slowed markedly, more than we had previously anticipated.” As you may recall, the ECB cut rates and re-introduced QE two weeks ago. This public acknowledgement of continued economic contraction in much of the euro region, is likely a precursor to more monetary accommodation in the months ahead. Given the Fed’s recent comments about monetary policy, the growing divergence in policy between the E.U. and the U.S. will likely add downside pressure to the euro versus the dollar. Since hitting 1.60 eur/usd in 2008, the euro has been sliding lower, albeit with ebbs and flows. It currently sits at 1.10 which is about 5 cents off 15 year lows. A break below 1.05 would likely send it to the all-time lows set in 2001 (.84).
Currently the Fed Funds futures market is fully priced for a 25bps cut at the October 30th meeting and a second 25bps cut over the following 6 months.
U.S. PMI data was mixed yesterday. On the positive side, the manufacturing index rose to 51 and into expansionary territory. The composite index and the services index were below expectations, but above 50. Prior to this release, the service sectors were supporting flagging manufacturing growth. Of concern within this data set is the employment sub-index. For the first time in a decade it fell below 50. Today’s Chart of Day shows this indicator compared to payrolls.
On the economic data front we will get Consumer Confidence and the Richmond Fed Manufacturing Index on Tuesday, New Home Sales on Wednesday and Durable Goods and Consumer Sentiment on Friday. There are a variety of Fed speakers throughout the week.
September 23, 2019
Starting next week the New York Fed will do $75 billion a day in overnight repo until October 10th, and will also conduct 3, 14 day, $30 billion term repos. The actions should help the Fed Funds and repo markets trade close to the Fed’s target rate. To clarify, the daily repos mature each day so the $75 billion does not culminate over time. However, once the three term repos are done, the Fed’s balance sheet will be $165 billion larger than before the repo problems first existed. Some are calling this QE (more permanent), but currently the liquidity injections are temporary.
U.S. PMI for manufacturing and services will released this morning. Expectations are for increases in both, with the manufacturing index rising back into expansionary territory (>50). German manufacturing continues to suffer as their PMI -manufacturing index hit a 7 year low of 41.4, which is 3.0 below the consensus estimate. German services are still in expansion.
On Friday afternoon the following headlines hit the market and sent stocks lower: MONTANA FARM BUREAU: CHINA DELEGATION CANCELS US FARM VISIT TO MONTANA – AGRICULTURE OFFICIALS TO RETURN TO CHINA SOONER THAN EXPECTED – NEBRASKA DEPARTMENT OF AGRICULTURE SAYS CHINA AGRICULTURE DELEGATION CANCELS U.S. FARM VISIT TO NEBRASKA
With the scheduled meeting between Xi and Trump in mid-October, this is a potential warning that the odds of a deal are fading. Further hurting the chances of a deal, Trump has been saying he wants a “full deal” and not an “interim deal.” A partial deal, including some agriculture and reduction of tariffs is very possible, but we find it hard to believe that the two parties can resolve the complicated technological and spying issues. As shown in Today’s Chart of the Day, Goldman Sachs assigns a 40% chance of a deal being completed.
Boston Fed President Eric Rosengren made a very interesting comment as follows: “WeWorks business model could send shockwaves across US commercial real estate, as the company is already the single biggest tenant in New York City, as well as Chicago, Denver and central London.”
September 20, 2019
The Fed supplied $84 billion in repo funding yesterday. The increasing daily amount is a signal that the cash crunch is worsening. While we believe this current situation will alleviate itself over time, it will keep recurring as the Treasury will be issuing $150-200bn of new debt each month which will further drain cash and bank reserves. The Treasury issuance amounts are large but a key factor is the lack of foreign participation in the debt auctions. In years past, a third to half of the issuance would be bought by foreign buyers. Today, foreign buyers are actually net sellers of US Treasuries. For more on this relatively new development, please read an article we wrote in June entitled Who is Funding Uncle Sam.
Data was generally strong yesterday with unemployment claims and the Philadelphia Fed Business Outlook coming in stronger than expected. Leading economic indicators, however, was flat versus +0.4% last month. The weak manufacturing data was behind the weakness. Bottom line from data and the Fed this week: A healthy consumer is offsetting weak business spending and slow global growth.
Three Fed members will speak today. While we expect them to tote the same message Powell delivered on Wednesday, we are on the lookout for any discussion of permanent policy actions to alleviate overnight funding pressures. This would involve QE or a change to capital requirements. QE would be a positive for the equity market.
September 19, 2019
The Fed cut rates by 25 basis points to bring the Fed Funds target range to 1.75-2.00%. Further they reduced the IOER rate by 30 basis to help alleviate pressure in the overnight markets. The vote to cut Fed Funds was 7-3. Two members voted for no rate cuts and one voted for a 50 basis point cut. We cannot recall a time, even in the midst of the financial crisis, when there was such a divergence of opinions of Fed members.
The Fed “dot plot” predicts no more rate cuts this year or next year with only a slight increase in rates in 2021. Through 2022, the lowest Fed fund rate estimate by all Fed members is 1.625% which equates to one 25 basis point rate cut. In other words, not one member expects a recession which would inevitably drive the rate down to zero. On the economic front they made little change to the July 31 statement. They re-stated that consumer spending was strong and the business investment and exports remains weak. Clearly, the trade situation is taking a toll on corporate spending.
In his press conference, Powell noted economic uncertainly due to trade policy which is weighing on growth but said the headwinds are offset with healthy household spending that is supportive of 2% economic growth. He is confident that inflation will rise to their 2% target and employment will remain strong.
In regards to the recent pressure on the repo markets, he believes there are “no implications for the economy or stance of monetary policy.” He puts blame for the volatility on tax date withdraws and the Treasury bond settlement. As we mentioned, these were both known well in advance and should not have been a big issue. He stated “funding pressures have no implications for monetary policy.” We believe that statement could come back to haunt the Chairman.
We apologize for belaboring the overnight funding situation, but this obscure and not well followed market is one of the largest in the world and is very important to the functioning of all financial markets. Fed funds traded above the Fed’s target on Wednesday morning despite an $83 billion liquidity injection by the Fed. This is an extremely rare event outside of quarter and year ends. What we are learning is that, in aggregate, banks do not have excess reserves. This is not necessarily a concern as it was standing operating procedure prior to 2008. However, it does change the landscape that we have been used to since the financial crisis. We will have more on this in an upcoming article.
September 18, 2019
A subscriber emailed us, asking why she should be concerned about the surge in overnight repo rates. To help answer her question and better explain the importance of the overnight funding markets, please see the following RIA Pro article posted yesterday: Surging Repo Rates- Why Should I Care?
The overnight funding markets were again extremely volatile on Tuesday. Fed Funds traded well above target at 3%, while the overnight repo markets surged to nearly 10% on the open. Further fueling problems in the repo market, the Fed canceled a planned repo operation (designed to provide liquidity to the repo markets) due to technical difficulties. Later in the morning, the Fed fixed the problem and flooded the market with $53 billion in repo funding. The Fed will also offer $75 billion in repo funding this morning. Yesterday’s repo operation was the first the Fed has conducted since the Financial Crisis. It was effective, bringing repo rates back to normal levels.
The graph shows the recent surge in the overnight repo rate. The only other recent extreme movement, outside of those this week, was at the end of the year in 2018. Such movement is somewhat typical at year ends as banks clamp down on their balance sheets. CLICK TO ENLARGE
At 2pm the FOMC meeting will conclude their meeting with a summary of the meeting, including any changes to the Fed Funds rate. Since Monday morning, the market has reduced the odds of a rate cut to about 50% from what appeared a near certainty last week. It will be interesting to see if they mention the overnight markets and if so, do they characterize the problem as technical or as a bigger concern. We assume that even if there is a problem they will claim it to be a technical issue so they don’t alarm investors. We will be very interested to see whether the Fed retains their easing bias or shifts to a neutral stance.
September 17, 2019
Yesterday afternoon, overnight borrowing costs for banks surged to 7%, well above the 2.25% Fed Funds rate. Typically the rate stays within 5-10 basis points of the Fed Funds rate. Larger variations are usually reserved for quarter and year ends when banks face balance sheet constraints. It is believed the settlement of new issue Treasury securities and the corporate tax date caused a funding shortage for banks. If that is the case, the situation should clear up in a day or two. Regardless of the cause, the condition points to a lack of liquidity in the banking sector. We will follow the situation closely as it may impact markets if it continues.
In addition to events surrounding Saudi Arabia and Iran, investors will heavily focus on the Fed. The Fed is scheduled to announce their rate decision at 2pm on Wednesday followed by a Jerome Powell press conference at 2:30. Prior to the Saudi news, the market was in consensus that the Fed would cut rates by 25bps. The recent CPI print and now spiking oil prices might allow the Fed to waver. Not only will the market paying attention to the rate decision but we think more attention will be on the direction of monetary policy going forward. Will they remove the easing bias and provide more two way guidance? As inferred by Fed Funds futures, investors still expect the Fed to cut rates by 50 bps after the expected 25 bps cut on Wednesday. As such, any change in bias would be surprising to the fixed income and equity markets.
The economic calendar is light this week. Thursday, however, should be interesting with the release of the Philadelphia Fed Business Outlook and Economic Leading Indicators. On Friday, Fed members will end their blackout with possible discussion of the Wednesday meeting and its announcements. Clearly, events in Saudi Arabia and Iran have the potential to trump all economic and Fed related market moves.
Our friend Danielle DiMartino Booth tweeted the following yesterday which helps explain why the S&P 500 sits near all-time highs and yet small and mid-cap indexes are well off recent highs.
“As per Howard Silverblatt “Buybacks remain concentrated among the top 20 companies, accounting for 50.4% of total. Buybacks for the 12-month period ending in June 2019 were $797.0 billion – down from $823.2 billion in Q1 2019, but up 23.4% from the same period last year”
September 16, 2019
The drone/missile attacks on Saudi Arabian oil facilities shook up the markets as they resumed trading last night. Currently crude oil is up a little over $5 but has given up $2 from its overnight highs. Bonds and gold are bid, while equities are off about a half a percent. The market has two big considerations that it now must consider. First, will the attack lead to war with Iran and if so what are the implications for oil prices and the trade war with China, an ally of Iran. Beyond their relationship and oil trade, China’s new Silk Road goes through Iran, so they have a vested interest in Iran. Second, with higher oil prices, will inflation concerns stop the Fed from cutting rates at Wednesday’s meeting and/or remove their easing bias going forward?
Oil futures for delivery in 2020 are up over $4 a barrel. While not as much as spot and October delivery, the market is voicing concern that the issues are not going away soon.
The good news on Friday was that retail sales for August rose 0.4% versus expectations of +.2%. However, a surge in auto sales accounted for the entire gain. We will keep an eye on auto sales to see if this is a trend or a short term rebound in what has been a longer term downward trend. In what could be a sign that consumers are tightening their purses, retail sales for restaurants and bars continues to slip, with year over year growth at the lowest levels in a decade. This series is well correlated to consumer sentiment and a decent leading indicator. Such consumer spending is relatively easy to cut back on and as such we would expect this industry to be a leading indicator of slowing consumption. Today’s Chart of the Day highlights the steep decline of restaurant and bar sales.
The University of Michigan Consumer Sentiment rose slightly to 92.0 from a 3 year low of 89.8. Given personal consumption is 70% of GDP, we will pay close attention to see if the trade war, “recession” talk in the media, and now potential war and higher oil prices are weighing on consumers. Thus far the surveys are not too concerning.
Longer term bond yields have risen sharply in September. Since the beginning of the month, 10yr US Treasuries yields are 41 basis points higher and 2yr yields are 30 basis points higher. Interestingly, short maturities like the three month T-bill have not budged. This is likely the technical correction we have been expecting and not based on a change in Fed posture. As witnessed by our purchase of IEF last week, we believe this is a buying opportunity.
September 13, 2019
In somewhat of a surprise move, the European Central Bank (ECB) cut rates by .10% to -.50% and re-introduced open-ended QE to the tune of 20bln Euros a month. The ECB had stopped QE for nine months prior to today. We say “surprise move” because many expected this move but few saw it coming as soon as it did.
The trade war soap opera failed to disappoint yesterday. A short while after the market opened the following headline came across the screens and the S&P rose nearly 20pts- *TRUMP ADVISERS CONSIDERING INTERIM CHINA DEAL TO DELAY TARIFFS. That was followed an hour later by Senior administration official tells CNBC that the White House is “absolutely not” considering an interim deal. The market gave up all of its gains on the retraction but rallied back to the prior highs, before fading towards the close.
CPI, like PPI the day prior, met expectations but when excluding food and energy was .10% higher than expectations. Retail Sales, due out at 8:30, is expected to come in at +.02% and +0.3% excluding autos and gas. The University of Michigan Consumer Sentiment Index is expected at 91.0, up slightly from the 3 year low of 89.8 registered last month.
Last night China said the pork and soybeans will be exempt from trade war tariffs. This is certainly a gesture to encourage further talks, but to be fair, China is concerned about internal strife due to higher food prices. Per the latest data from July, Chinese food prices rose 9.1% from a year ago, led by a surge in pork and fruit prices. Pork, a large component of the Chinese diet, has risen due to the outbreak of swine fever.
September 12, 2019
PPI met Wall Street’s expectations, however Core PPI (excluding food and energy) was a tenth of a percent higher than expectations. CPI will be released today. The Fed has called the recent dip in inflation transitory. PPI and CPI will show us if they are correct. If so, the Fed will have less of a reason to continue to lower rates.
Stocks rallied yesterday as it was disclosed that China reduced tariffs on a number of goods. This gesture was followed up last night when Trump pushed back the schedule on new tariffs from October 1st to the 15th. The market surged higher on Trumps tariff delay but has since given back most of the gains.
Wednesday morning started with a bang from the President as he tweeted the following: “The Federal Reserve should get our interest rates down to ZERO, or less, and we should then start to refinance our debt. INTEREST COST COULD BE BROUGHT WAY DOWN, while at the same time substantially lengthening the term. We have the great currency, power, and balance sheet…..”
Essentially the President is advocating for the Fed to print money to lower government financing costs and enable larger debts. Based on what we have seen thus far in Europe and Japan, this may seem like a viable way to manage debt, but history warns us that such strategies always end poorly. It is also worth noting that European and Japanese banks are struggling mightily while U.S. banks are doing well. Debt formation has been a major cog of U.S. economic growth over the last two decades. Stripping the banks of profit motivations, as zero rates do, will cause major harm to the banks and further decrease the natural growth rate of the economy. Such actions would further promote speculation and harm savers. As we have written, savings drive innovation and productivity growth, the lifeline for sustainable economic growth.
September 11, 2019
Please take a moment today in remembrance of September 11, 2001.
***Due to technical difficulties we will not be able to publish The Sector Buy-Sell Review today. We hope to have it out tomorrow.
Small cap and value stocks are showing some signs of life versus larger cap and momentum stocks. IWN, the Russell 2k Value ETF is up 4% since Friday’s close, while the broader large-cap indexes like the S&P and NASDAQ are flat on the week. Momentum stocks, as shown in two charts in Today’s Chart of the Day, had their worst loss in at least a decade occur on Monday. Our RIA Pro series Value your Wealth documents the gross under performance of value over the last decade. It is way too early to declare that value is back in vogue but the last few days certainly hint that something is afoot.
Yesterday, markets opened sharply lower but rallied toward the close and ended the day flat. Trade rumors along with the firing of National Security Advisor John Bolton drove price action. As we have said over the last few weeks, volatility based on news events and Tweets is difficult, if not impossible to trade. It is best to position your portfolio in a manner that allows you a level of comfort whether the market is rising or declining. This too shall pass, but in the meantime trade appropriately.
JOLTS reported that the number of workers voluntarily leaving their jobs (quit rate) rose to an 18 year high. This is a good sign that workers are confident in their ability to find work. However, job openings fell to a five month low as it appears some firms are scaling back on their spending and investment plans. This mixed report signals overall health but points to growing weakness in recent months.
September 10, 2019
While there is not a lot of economic data this week, the data coming out is important for those trying to figure out the Fed’s next move(s). On Wednesday and Thursday, the BLS will release producer prices (PPI) and consumer prices (CPI) respectively. On Friday, we should gain a better feel for the state of the consumer. At 8:30am Retail Sales will be released and Consumer Sentiment will follow at 10am. You may want to read The Dreaded “R” Word. This RIA Pro article, from last Friday, discusses how the media playing up recession concerns can lead to a slowdown in economic activity. Sentiment and Retail Sales will provide us with information to better assess if the public is starting to tighten their purse strings.
The Fed will be quiet this week as they enter the communications blackout period prior to next Wednesday’s FOMC meeting. Expectations in the Fed Funds futures market is for a 25 bps rate cut.
Moody’s downgraded Ford (F) to junk status (Ba1) after the close yesterday. Ford has approximately $85 billion in debt outstanding that will be affected. Ford stock is only down 3.5% from yesterday’s close as the news was not a surprise.
Consumer borrowing rose last month at the fastest rate in two years. This should provide a boost to the retail sales data released on Friday.
September 9, 2019
The growth in payrolls fell short of market expectations and well as our model’s estimate. New jobs grew by only 130,00, but is actually weaker considering the census was responsible for adding 25,000 of the jobs. The rest of the employment report was more encouraging. The participation rate rose to 63.2% from 63% and hourly earnings beat expectations by .1%. Today’s Chart of the Day shows that year over year employment growth fell to 1.39%, the lowest growth rate since 2011.
Fed Chairman Powell’s speech on Friday seemed to mirror the Wall Street Journal article we discussed on Friday. The gist is that the consumer is in good shape and the Fed is not forecasting a recession. He did warn that trade uncertainty is weighing on business decisions and thus providing a headwind to economic activity. Finally, to make sure the markets know the Fed has its back, he stated “the Fed will act as appropriate to sustain the expansion.”
On Thursday night the People Bank of China (PBOC) reduced the required reserve ratio (RRR) in order to provide more liquidity to the banking system which in turn should benefit the economy. Essentially, they increased the amount of loans that can be made per the amount of reserves. The action is not significant but it will, on the margin, stimulate growth. The problem China faces is that providing liquidity will weaken the yuan, draw the ire of President Trump, and further complicate trade talks. Given this dynamic, we do not think they will flood the system with liquidity unless trade talks fail.
September 6, 2019
Yesterday’s ADP labor report was stronger than expected, coming in at +195,000. Based on this data, our model expects today’s payrolls data to increase by 210,000, well above estimates of 160,000 as shown below, courtesy Econoday. CLICK TO ENLARGE.
Yesterday’s ISM non-manufacturing painted a healthy picture of the service sector. The index was 56.4 versus expectations of 54.0. The only concern within the report was that job creation fell three points. Interestingly, the lesser followed PMI non-manufacturing report fell to 50.7, standing just above contraction levels and at it lowest level in over three years.
The Fed has traditionally used reporters to help telegraph their thoughts and as a way to trial balloon future monetary policy actions. Yesterday, a well known Fed “mouth piece” at the Wall Street Journal, Nick Timiraos, provided us with what may likely be the Fed’s action plan for the coming FOMC meeting on September 18th.
As the title suggests, Fed Lines Up Another Quarter-Point Rate Hike, the Fed is heavily leaning towards cutting rates by 25 basis points in two weeks. Based on the article they are concerned about slowing manufacturing growth, recent downward revisions to employment data, and the inverted yield curve. While some expect the Fed to cut 50 basis points, the article states: “The idea of an aggressive half-point cut to battle the slowdown hasn’t gained much support inside the central bank, according to interviews with officials and their public speeches.”
But….. with ISM Non-manufacturing stronger than expected, nice gains in ADP payrolls, and what appears to be an easing of trade war related tensions, the Fed’s reasons to cut are fading.
Just a reminder that Fed Chairman Powell will speak today at 12:30.
September 5, 2019
The ADP labor report, which tends to be well correlated with the BLS employment report, will be released at 8:15. The current estimate is for 150,000 new jobs and the estimate for Friday’s BLS report is for 160,000 new jobs. Our focus this morning will be on the ISM non-manufacturing report at 10am. As we mentioned yesterday, the service sector has held up well despite global economic slowing and a slump in domestic manufacturing. Signs that the service sector are weakening would be another reason to worry about a recession. The current estimate is 54.0, which is .3 better than last month’s level.
Since the beginning of August the S&P 500 has been range bound as shown below. The market closed yesterday right up against the resistance line (2940) which has contained 3 rallies. Last night, after it was reported that trade talks with China are scheduled for October, the market convincingly broke the resistance line. If last night’s surge can hold the odds favor a run back to late July highs. CLICK TO ENLARGE
Despite the equity market strength over the last week, utilities, gold and bonds have stayed close to recent highs. Typically we expect to see a divergence between equities and these more defensive/hedging sectors. Markets are trying to tell us something, but the question is which market is it?
The following from Zero Hedge does a nice job of summarizing the plethora of Fed speakers and the Fed’s Beige book from yesterday:
Williams (Dovish): “Ready to act as appropriate”, July cut was right move, economy mixed (admitted consumer spending not a leading indicator), international news matters, low inflation biggest problem.
Kaplan (Dovish): “Monetary policy a potent force”, worried about yield curve inversion, economy mixed (factories weak due to trade, consumer strong), watching for “psychological effects” on consumers, “if you wait for consumer weakness, it might be too late.”
Kashkari (Dovish): Tariffs, “trade war are really concerning business”, job market not overheating, slower global growth will impact US, most concerned about inverted yield curve. Fed’s policy is “moderately contractionary.”
Bullard/Bowman (Looked Dovish): Took part in “Fed Listens” conference but made no comment on policy but then again when has Jim Bullard ever not been dovish.
Beige Book (Mixed): Moderate expansion but trade fears are mounting, but optimism remains, despite what Kashkari says: “although concerns regarding tariffs and trade policy uncertainty continued, the majority of businesses remained optimistic about the near-term outlook”
Evans (Dovish): Trade policy increases uncertainty and immigration restrictions lower trend growth to 1.5%, Auto industry especially challenged
September 4, 2019
Market News (MNI) reported yesterday that the ECB may buy €20-30 billion bonds per month in a new round of QE. This rumor has grown over the last few weeks and has weighed on the Euro versus the dollar. On Tuesday the euro/USD broke through what was considered strong support at 1.10, a level last seen in August of 2017. Likewise the U.S. dollar index stands at over 2+ year highs. It is highly likely Donald Trump and Steven Mnuchin will be more vocal about dollar strength and possibly hint at taking action if the trend continues.
The ISM Manufacturing index fell to 49.1 putting it into economic contraction territory. The New orders sub-component fell below 50 to 47.2, new export orders dropped to 43.3, and employment was also below 50 at 47.4. We will look for confirmation of a weakening employment situation in Friday’s employment report. With the larger than expected drop in ISM, the Atlanta Fed’s GDPNow forecast fell from 2.3% to 1.7% for the third quarter.
Despite the shorter week there is a good amount of data on tap this week. On Thursday the markets will receive the ADP Employment report, Jobless Claims, and the ISM Non-Manufacturing Index. We are interested to see if the non-manufacturing sectors of the economy are continuing to hold up despite the pronounced drop in manufacturing. On Friday, the BLS employment report will be released.
Six Fed members will speak today, followed by Jerome Powell on Friday at 12:30.
September 3, 2019
On Sunday September 1, the latest round of tariffs went into effect and China responded shortly thereafter by adding tariffs on $75 billion of US goods. While trade rhetoric has improved over the last week, actions tell us the two parties are not as close to a deal as the markets would like to believe. Further evidence came on Labor day when it was revealed that China and the U.S. were having trouble setting a date to meet in September.
Sunday’s New York Times has a very interesting editorial that presents a case for tightening rates- LINK. William Cohan, the author, reviews many of the same troubling debt themes that we have harped on in numerous articles. Given these dynamics and the possibility of a debt crisis, he implores the Fed to “pop the debt bubble” via higher rates and QT. Cohan also urges Powell to stand up to Trump and not acquiesce to rate cuts. Unlike the Dudley editorial, discussed last week, which was largely politically motivated, this article articulates a solid rational for Powell to “stand up to Trump.” We will have more on the Dudley article tomorrow.
August 30, 2019
The market opened higher yesterday on reports that China wants a “calm trade resolution.” Adding to the euphoria are new rumors that Trump might delay the September 1st tariffs on China. These rumors and news stories might be true and the market may have more upside. We caution however, there have been periods where optimism and “done deals” propelled the market higher, only to see gains erased when things did not work out as expected. It is worth noting that CNN is reporting that two presidential aides conceded that Trump’s ” high level phone calls” with China over the past weekend did not occur.
We do not know how this drama will end, nor does anyone else. As such, focus on technical and fundamental indicators and try to ignore the day to day news and rumor mill.
ECB board member Klass Knot told the media yesterday that there is no need for the ECB to do more QE at the time. The markets had assumed more QE was coming in the next few months.
Treasury Secretary Steven Mnuchin said that the Treasury is considering issuing Ultra long bonds with maturities of 50 to 100 years. This should not be a surprise that the government wants to lock in historically low rates for such a long period. The only question is how would the addition of these bonds affect yields across the curve?
2nd quarter GDP was revised from 2.1% to 2.0% despite consumer spending being revised higher (4.7% from 4.3%). Surprisingly, Pending home sales fell 2.5% despite declining mortgage rates.
We wish you a great Labor Day weekend. See you on Tuesday.
August 29, 2019
For the first time in a while the Fed and/or China did not dictate the market’s direction yesterday. Given the volatility of the past few weeks and random nature of positive or negative news events, we welcome the break. As noted in yesterday’s portfolio commentary we took a little risk off the table yesterday by reducing our exposure to the financial sector. We are concerned that the fundamentals and technical situation are pointing to lower levels.
As shown below, the Chinese Yuan has risen (depreciated) from 6.87 per dollar to 7.16 per dollar over the past month. As the Yuan depreciates Chinese goods are cheaper to import into the U.S. and U.S. exports become more expensive in China. China has more control than most countries over their currency and as this chart makes clear, they are allowing the Yuan to cheapen against the dollar to limit the effect of tariffs. Last month alone Yuan depreciation effectively offset almost 5% of tariffs on every item traded with the U.S., not just those selected for tariffs.
“This morning the yield of 30-year Italian bonds fell below the fed funds rate. This means the Fed is now in charge of the single highest interest rate in the developed world.” -Jim Bianco
August 28, 2019
The 2s/10s yield curve continues to invert, now standing at -5bps. We expect this trend to likely continue as the bond market forces the Fed towards a more dovish stance.
Tuesday’s Consumer Confidence report was a mixed bag. On a positive note, the present situation index rose to its highest level in nearly 20 years. While consumers are generally positive, they are less confident about the future. The expectations index fell to 107 from 112.4. What we do not know is whether or not the surveys were conducted before or after the latest round of tariffs. If they occurred before, did the trade actions impact consumer sentiment.
Bill Dudley, NY Fed President from 2009-2018, wrote a stunning editorial in Bloomberg yesterday. In the article he makes some controversial points. First, that by lowering interest rates the “Fed’s accommodation encourages the President to escalate trade war further, increasing the risk of a recession.” He further states “Officials could state explicitly that the central bank won’t bail out an administration that keeps making bad choices on trade policy, making it abundantly clear that Trump will own the consequences of his actions.”
He ends with the following statement which will certainly draw the ire of the President; There’s even an argument that the election itself falls within the Fed’s purview. After all, Trump’s reelection arguably presents a threat to the U.S. and global economy, to the Fed’s independence and its ability to achieve its employment and inflation objectives. If the goal of monetary policy is to achieve the best long-term economic outcome, then Fed officials should consider how their decisions will affect the political outcome in 2020.”
Bill Dudley appears concerned about the Fed’s independence and the viability of the institution but also with Trump winning re-election. Ironically, his article may push Trump to take actions against the Fed. Anything done to remove or displace Powell will be disruptive to markets.
August 27, 2019
What a difference a day makes! Markets glided higher late Sunday night and by yesterday’s close recovered almost half of Friday’s loses. What seemed like a trade-war disaster on Friday and over the weekend, now appears to be old news with investors. It may appear calm for the time being, but the risks are still both large and two way. We generally think the markets are susceptible to further downside due to trade and technical factors, but we can’t rule out a surge higher due to some sort of agreement with China.
Despite stocks rising by over 1%, the VIX volatility index was up most of the day, a sign that investors were adding to their hedges.
The headline Durable Goods number was stronger than expected at 2.1% versus last months +1.9% increase and expectations for a 1.2% gain. The data is less favorable when aircraft and aircraft parts are removed. Excluding these volatile large volume orders, durable goods fell by .4% in July.
The economic calendar is light this week. Of note is consumer confidence today at 10am and on Friday, Chicago PMI and the University of Michigan Consumer Sentiment Survey. The only Fed speaker scheduled to speak is Mary Daly of the San Francisco Fed on Wednesday.
August 26, 2019
Stocks are opening higher after falling sharply last night on the futures open. It appears the culprit for the sharp rebound is communication between China and the US. Trump stated the following last night- “We’re going to start very shortly and negotiate and see what happens but I think we’re going to make a deal.”
Chairman Powell spoke at the Fed’s annual Jackson Hole symposium on Friday and said the economy was solid with a strong labor market and inflation moving towards its 2% target. He mentioned elevated risks to the Fed forecast and did not use “mid-cycle” terminology to as they did in the press conference following the July 31st FOMC meeting. In our opinion there was not much new in the speech, however there was an interesting change of language. Instead of describing the lower bound of interest rates (0%) as the “zero lower bound” they used “effective lower bound”. While it may not seem important, they essentially opened the door to negative rates if needed in the future.
A few other Fed speakers followed Powell on Friday afternoon and echoed the idea that Fed Funds are more or less at a good rate and not many more rate cuts are needed. Obviously this is a big point of contention with the President.
Between Powell’s speech and China’s retaliatory tariffs, Trump was irate on Friday. The following from CNBC sums up the dynamic well:
Trump tweeted on Friday: “Our great American companies are hereby ordered to immediately start looking for an alternative to China, including bringing..your companies HOME and making your products in the USA.
“The threats always been out there but there’s been no need to provoke that,” said Art Hogan, chief market strategist at National Securities. “It’s almost like the administration was expecting the Fed to announce a rate cut at the Jackson hole meeting. And since Powell did not deliver, he went to defcon 5.”
Fun fact: According to Steve Liesman of CNBC, Trump has tweeted about the Fed on 20 of the 23 days in August.
On Friday after the market closed Trump upped tariffs on China- Per his tweet- ‘Starting on October 1st, the $250B of goods and products from China, currently being taxed at 25%, will be taxed at 30% Additionally, the remaining $300B of goods and products from China, that was being taxed from September 1st at 10%, will now be taxed at 15%.’
The U.S. dollar sold off on Friday as there is a growing concern the Trump will push the Treasury Department to weaken the dollar, which would effectively stimulate exports and boost prices if successful. As we discussed a few weeks ago, he is limited in his ability to stimulate the economy, so weakening the dollar may provide some economic relief. – The Prospects of a Weaker Dollar Policy
August 23, 2019
UPDATE: Rumor becomes reality- The following headlines just hit the wires:
CHINA TO LEVY RETALIATORY TARIFFS ON ANOTHER $75B OF US GOODS
CHINA TO RESUME TARIFFS ON U.S. AUTOS
Chairman Powell will speak at the Fed’s Jackson Hole symposium at 10am this morning. We expect that he will continue to describe policy as mid-cycle, meaning that the current series of rate cuts is limited. If we are correct, and Powell does not appear willing to cut rates significantly, the yield curve will likely continue to invert and with that recession warnings in the mainstream media will become more widespread. As we wrote in The Dog Whistle Heard Around the World, a change in the economic narrative can be a catalyst for economic decline. The odds of a rate cut in September are 95%.
Rumors are heating up that China will unveil countermeasures to U.S. tariffs in the coming days. It’s hard to trade on this rumor but we offer caution as tariffs and retaliatory measures have not been good for the stock market.
Declines in the servicing and manufacturing sub components pushed the U.S. PMI below prior month readings and expectations. The manufacturing sector fell below 50 for the first time since September 2009. Until recently the service sector has held up despite weakness in manufacturing. This report and a few other recent data points show the sector’s resiliency may be waning. The table of PMI data, courtesy Econoday, is shown below.
Lower interest rates are providing a little boost to the real estate market. On Wednesday, the Architecture Billings Index (ABI) increased to 50.1 from 49.1 from the prior month. There has also been a surge in refinancing with the MBA refinancing index jumping by 37% and 12% over the prior two weeks; however this week it was relatively flat at +0.4%. Interestingly, the MBA’s purchase index has not risen as impressively. The Freddie Mac primary mortgage market survey says the current rate on a 30-year conventional mortgage is 3.55%, down from nearly 5% late last year. While mortgage rates are declining, they are reaching a point where the yield will not fall as much as U.S. Treasury bonds due to the prepayment risk the lender assumes.
August 22, 2019
Australian PMI fell below 50 (49.5 versus 52.1 last month), likely a result of China slowing markedly. On the bright side, the Eurozone Composite PMI was 51.8 versus 51.5 last month. The manufacturing component remains well below 50 at 47. The service component of the index is still in expansionary mode. While the manufacturing data is below 50 it does appear to be stabilizing.
The estimate for the US PMI composite is 51.9, the manufacturing and service sub components are 50.2 and 52.3 respectively.
The BLS released preliminary employment revisions for 2018 and Q1 2019. As shown in Today’s Chart of the Day, 501,000 previously reported gains to payroll were lost to revisions. Three sectors, retail (-146k), professional/business services (-163k) and leisure/hospitality (-175k), accounted for most of the losses. The final results will not be released until February 2020.
The Fed’s July 31st FOMC meeting minutes were released yesterday. While a broad number of topics were covered, we believe the important consideration in the release was that the Fed is not sold on further rate cuts. They reiterated the term “mid-cycle” adjustment, meaning one or two cuts but not prolonged action. In particular, the following quote caught our attention: “Participants generally judged that downside risks to the outlook for economic activity had diminished somewhat since their June meeting.” They also noted that lower inflationary readings earlier this year were “largely transitory.” Powell will speak on Friday and we suspect he will confirm the view from the minutes.
August 21, 2019
Today’s Chart of the Day shows the trade-weighted dollar index. While not as popular as the DXY Index, this index more accurately measures the true economic effect of the dollar’s strength and weakness versus other currencies. As shown, the index hit a new high yesterday, clearing 130. Dollar strength against the currencies of our trade partners weighs on corporate profitability, predominately exporters, and acts to lower inflation domestically.
Starting tonight in Asia and continuing through Europe and eventually the United States, PMI (Purchasing Manager Index) data will be released. As shown in the table below, PMI numbers for every major economy are worse today than in the months leading up to the global recession and financial crisis of 2008. CLICK TO ENLARGE
On Monday Trump floated the idea of a payroll tax cut. Yesterday he said that the administration is looking at a variety of tax cut possibilities. He also mentioned using an executive order to cut capital gains tax rates. It appears, based on his constant badgering of the Fed to cut rates and now the idea of tax cuts, Trump is trying to protect the economy and his reelection chances against the increasing odds of a recession. The problem he will face on the tax front is a democratically controlled House which is unlikely to pass legislation that increases the President’s odds of winning the election.
August 20, 2019
Germany has somewhat caved into calls to boost fiscal spending in order to reverse sluggish economic activity. While not yet committed, they announced plans for “measures as contingency for crisis” with the trigger and target focus of the stimulus being the job market. The German unemployment rate currently is 4.96% which is the lowest level since the early 1980’s. Germany’s GDP is only about a fifth the size of the US economy, so even if they do provide stimulus, the effect on the global economy will be much less than if China or the US were to boost fiscal stimulus.
Donald Trump has now gone beyond asking the Fed for rate cuts. In a Tweet yesterday he introduced QE:“…..The Fed Rate, over a fairly short period of time, should be reduced by at least 100 basis points, with perhaps some quantitative easing as well. If that happened, our Economy would be even better, and the World Economy would be greatly and quickly enhanced-good for everyone!”
Economic data will be light this week. On Thursday PMI for the US and other major nations will be released. Global PMI slipped into contraction last month so markets will be focused on whether the trend worsened or not.
The two big ticket items for the week are the release of the July 31 FOMC meeting minutes on Wednesday, and the Fed’s Jackson Hole Symposium on Thursday and Friday. Jerome Powell and other Fed members are scheduled to speak and update us on the state of monetary policy.
August 19, 2019
Stocks are opening strong while bonds and gold are declining. These share moves are a reaction to what appears to be positive comments on trade over the weekend.
Over the past few days we have wondered why Fed members have been so quiet. On Friday we got our answer; Chairman Powell has ordered a media blackout for all voting members. Two of the more vocal, non-voting members Bullard and Kashkari are free to speak their mind and have done so on Thursday and Friday. The blackout story is HERE.
Consumer Sentiment came in at 7 months lows of 92.1 versus expectations 97.0 and a prior month reading of 98.4. Likely, the Fed’s rate cut and additional tariffs weakened confidence over the last two weeks. We need to see if weaker confidence translates into a reduction in economic activity.
On Friday, Sweden’s 20 year bond fell below zero and in doing so, joined Germany and Switzerland in having their entire spectrum of sovereign debt trade at negative yields. The total amount of negative yielding debt world-wide is now over $17 trillion. A year ago the total amount stood around $7 trillion.
The flattening and recently inverting yield curve has been a hot topic recently. There are many considerations for why the yield on longer term bonds is falling more than those of shorter term bonds. One not getting enough press is the US deficit funding situation. With the extension of the debt limit in late July, the US Treasury is now set to borrow over $800 billion by year end. A large portion of this issuance will come from shorter maturities including 2yr notes and the 1, 3, and 6 month Bill sectors. This daunting supply is playing a role in keeping shorter term bond yields higher and allowing for more flattening/inversion.
August 16, 2019
We fixed a technical problem with our new functionality that emails trade alerts in real time. Going forward, if you are signed up for email alerts, you should receive these alerts. To make sure you are signed up go to Settings (top right)- Profile- Daily Emails.
Yesterday’s economic data sure puts the Fed in quite a pickle. The inverting yield curve, declining equity markets and slowing growth abroad begs for them to cut rates. At the same CPI on Tuesday was higher than expected. On Thursday, the Philly Fed Business Outlook and Empire State Manufacturing Survey beat expectations handily. More importantly, Retail Sales came in at a strong +0.7% monthly growth, up from 0.4% last month. Excluding autos, the data was even stronger. Yields fell despite the better than expected data. This is a sign that bond investors are more focused on the future than the present.
With data like we have seen this week, the market will question the Fed’s ability to lower rates. As a result the yield curve will likely further invert which may weigh on equity prices.
Harry Markopolos, the accountant that brought down Bernie Madoff, released a 170 page report on GE. In the report he claims GE’s accounting problems are much worse than previously disclosed. He believes they could amount to $38 billion in unreported losses. Currently GE bonds are rated BBB+. If the report is taken seriously by investors and the SEC, might GE become junk rated or even worse? GEs stock closed down 11% on the day.
August 15, 2019
The narrative driving yesterday’s 2.93% selloff in the S&P 500 is the first inversion of the 2s/10s yield curve since the financial crisis. The fact of the matter is that from an economic perspective, whether the curve is positively or negatively sloped by 5 or 10 basis points makes no difference. The economic damage done by a flat curve was done months ago as we have discussed in various articles. However, as we frequently see in human behavior, there is an imaginary line in the sand that when crossed, becomes headline material and a cause for action. Simply, humans crave answers and with the market down so much the collective media and social media sphere determined the yield curve is the problem.
We suspect that the stock market will continue to weaken and the yield curve will further invert until some Fed members become vocal about how they might re-steepen the yield curve.
To that end we saw an interesting statistic from Zero Hedge as follows: “Of the ten yield curve inversions back to 1956, the S&P 500 topped out within approximately three months of the inversion more than half the time, or on six occasions – 1956, 1959, 1965, 1973, 1980, and 2000.” The last instance in 2006 provided equity investors ample time to exit stocks. The curve first inverted in February of 2006 and the S&P 500 didn’t peak until October of 2007. In February we wrote the following article that may be worth re-reading- Yesterday’s Perfect Recession Warning May Be Failing You.
A lot of economic data will be released this morning. Jobless Claims, Philly Fed Outlook, Empire State Survey, and Retail Sales are due out at 8:30. Industrial Production figures will follow at 9:15. Investors will likely key on Retail Sales as the consumer makes up nearly 70% of economic activity. The Philly Fed and Empire reports will shine more light on how the trade war is affecting the behavior of business executives.
August 14, 2019
The China-Trade soap opera, that seemingly governs asset prices, surprised the markets once again. Trump delayed the start of the new 10% tariff. The stock market soared 1.5% as investors interpreted this as a sign that tempers are cooling. Bonds and gold, both of which had a strong bids over the prior days were weaker.
About 2/3rds of the stock gains were erased last night and bond yields are headed lower once again. The 2s/10s is now slightly inverted. We believe that an inverted yield curve scares the Fed and expect to hear Fed members becoming more accommodating to future rate cuts.
German GDP fell .1% for the second quarter. Given the third quarter data we have seen it appears increasingly likely that Germany will be in a recession shortly. Two consecutive negative quarters is the technical definition of recession.
Following PPI’s lower than expected print last week, CPI and CPI ex food and energy came in 0.1% higher than expectations. Import and Export prices will be released at 8:30 this morning.
There are no Fed members scheduled to speak this week but that does not preclude someone from doing a impromptu interview.
August 13, 2019
Last night the German ZEW economic expectations index fell sharply to -44.1, well below expectations of -28.0. The index now sits at the lowest level since 2011. This reading points to further deterioration in the German economy and sharply raises the odds that they are already or will be in a recession shortly. Reflecting the worsening economic situation, German sovereign yields continue to fall deeper into negative territory. The 2yr note stands at -0.87% and the 10yr Bund at -.61%.
U.S. bond yields fell sharply once again yesterday as investors seek the safety and relatively high yields of U.S. Treasury bonds. We use the description of “high yields” in comparison to Europe and Japan whose yields continue to fall further into negative territory. The 10yr Treasury note now yields 1.64% down almost a full percent from the beginning of the year. The 2s/10s curve flattened further yesterday and is down to 6 basis points. We suspect the curve will continue to flatten until the Fed takes on a more aggressive stance. It is possible an inverted curve could prompt the Fed to do just that.
Since the 10% tariff was enacted and the ensuing market decline, the odds of future rate cuts increased. So far the market expects that rate cuts will happen at regularly scheduled Fed meetings. In 2008 and other recessionary periods it was common for the Fed to intervene between scheduled meetings. While not likely, we are following the August Fed Funds futures contract for any sign that the market expects an intra-meeting rate cut. The next FOMC meeting is on September 18th, meaning there are no meetings in August. Accordingly, the August contract should trade on top of the Fed Funds effective rate which is about 2.15%, which it currently is. We will alert you if the situation changes. If you want to follow for yourself (LINK), track the August 2019 contract and look for any price above 97.90 (100-97.90 = 2.10%) as an indication that the odds of an August rate cut are appreciable.
August 12, 2019
On Friday, PPI came in as expected on a monthly and annual basis, however PPI excluding food and energy was .3% less than expectations on a monthly and annual basis. It was the first monthly decline in core PPI in nearly 3 years. CPI will be released on Tuesday.
We have seen some comments in the media warning that China may likely further devalue their currency to offset tariffs. China can certainly choose that path but it is important to recognize that as the Yuan weakens capital leaves the country. China’s banking and corporate sectors are highly leveraged. As such, a big enough outflow of capital could potentially create a liquidity crisis that would dwarf the tariff problem they are wrestling with.
China is walking a tightrope and is fully aware of the pros and cons of a weaker/stronger yuan. It is also important to understand that China does not have complete control over the Yuan’s value versus the dollar, therefore any depreciation or appreciation of the Yuan may not be their doing.
The economic data calendar starts the week light but picks up on Thursday. On the inflation indicator front, CPI will be released Tuesday and Import/Export Prices on Wednesday. Retail Sales will be released Thursday, along with Jobless Claims, Industrial Production and the Empire State Manufacturing Index (New York). Friday will see the release of Housing Starts and Consumer Sentiment.
August 9, 2019
We will get our first look at inflation data for July this morning. Producer prices (PPI) are expected to rise .2% and 1.7% monthly and annually respectively. CPI will be released on Tuesday.
In the latest trade barb, the U.S. is holding off on granting Huawei licenses due to China’s halt of agriculture purchases. The equity markets have traded lower on the news.
The UK posted a negative GDP number for the second quarter (-0.2%). The weakness is in part due to concerns over BREXIT as well as slowing growth in the Euro-zone, their largest trade partner in aggregate.
Risk markets exploded higher yesterday in what we believe is a technical bounce from short term oversold levels. As judged by declining Treasury yields and rising gold prices yesterday despite the sharp equity rally, there are still a lot of investors seeking safety. In this weekend’s newsletter we will discuss whether yesterday’s surge is sustainable.
On Wednesday, China said that they expect the 10% tariff to ultimately get raised to 25%. Today’s Chart of the Day shows how financial assets have performed since the 10% tariff and gives us a hint as to how a hike to 25% might further affect assets.
August 8, 2019
Many Fed members have spoken about avoiding a flat or inverted yield curve. Once again, St. Louis Fed President Bullard highlighted that the curve is one of the prime factors driving rate policy. To wit in reference to the yield curve: “I don’t think this has gotten any worse here.”
The reason the trepidation around a flat or inverted yield curve is that every inversion of the 2s/10s curve has led to a recession. In late May, the yield curve started getting more media attention as it flattened to 14 basis points. Fears where quickly calmed when the curve re-steepened shortly thereafter, rising to 28 basis points by mid-July. Since the Fed meeting, the curve has flattened once more, hitting 8 basis points yesterday morning. While Bullard may claim it hasn’t gotten worse, it has. At this point it may only take another trade war comment/action from Trump or China to invert the curve.
Donald Trump was vocal about the Fed once again. Yesterday, via Twitter he stated: “Incompetence is a terrible thing to watch, especially when things could be taken care of sooo easily. We will WIN anyway,” “It would be much easier if the Fed understood, which they don’t, that we are competing against other countries, all of whom want to do well at our expense!” The word “incompetence” caught our attention. This is the first time he has used that word to describe the Fed and it may just be his legal justification to demote or fire Chairman Powell that he is test driving in public.
In another sign of slowing global growth, crude oil is back to the lows of the fourth quarter 2018.
August 7, 2019
St. Louis Fed President Bullard, one of the more dovish Fed members, did not press as strongly as expected for more rate cuts in a speech yesterday. Like Powell’s press conference, he seems to prefer a wait and see approach. Here are a few quotes from his speech- “You’re not in recession mode here, you’re in mid-cycle.” “I don’t think this has gotten any worse here” [referring to yield curve]. “There are a lot of good things going on in the economy.” Over the coming week or two we will hear more Fed speakers and hopefully get a better feel for their current thoughts on further rate cuts. Chicago Fed President Charles Evans speaks today.
Following the new 10% tariff on $300 billion of Chinese goods, we have seen a few estimates that put the average tariff on all Chinese imports at 4-6%. Please see Today’s Chart of the Day for one estimate of total tariffs.
Escalation of the US-China trade war is causing some countries that are greatly affected to cut interest rates. Last night, for instance, Thailand, India and New Zealand cut rates. The Thai cut was unexpected while India’s and New Zealand’s cuts were larger than expected.
August 6, 2019
Yesterday morning, following China’s retaliatory actions, Donald Trump increased pressure on the Federal Reserve to cut rates more aggressively with an aim to weaken the dollar versus the Yuan. He Tweeted the following: China dropped the price of their currency to an almost a historic low. It’s called “currency manipulation.” Are you listening Federal Reserve? This is a major violation which will greatly weaken China over time!
He followed up the Tweet late yesterday by having the Treasury Department label China a currency manipulator. Stocks were down about 3% yesterday on China’s retaliation and fell another 2% after the close on the new announcement from China. Last night, China lowered their official currency fixing price back to 6.97 from 7.14. It is not clear whether China did this as a friendly gesture to deescalate the brewing currency war, or to address the increasing outflow of capital which could cripple their already over leveraged banking system. The S&P is now trading up half a percent.
Per the Treasruy- “As a result of this determination (currency manipulator), Secretary Mnuchin will engage with the International Monetary Fund to eliminate the unfair competitive advantage created by China’s latest actions.” Said differently, the U.S. and other nations can now manipulate their currency versus the Chinese Yuan.
With the recent decline, the DJIA is now below the level it was in January 2018, when Donald Trump declared the first set of tariffs on China.
ISM non-manufacturing index showed some weakness coming in at 53.7 versus expectations of 55.5. To the contrary, the PMI non-manufacturing survey beat expectations. The service sector has thus far held up much better than manufacturing and has offset weakness in the broader and global economy. If the service sector is indeed weakening the odds a recession increase markedly.
James Bullard- St. Louis Fed President, speaks this morning. He is one of the more dovish Fed members. We suspect he will argue for a 50bps rate cut in September. We are particularly interested to see if he mentions the prospect of an intra-meeting rate cut.
Our Dashboard format has changed. Scroll down to see Portfolio Alerts, RIA Pro Articles and Videos, and the Chart of the Day. The screen will now refresh every five minutes. Older commentaries and articles can be loaded by scrolling down to the bottom of each boxed section.
August 5, 2019
China is retaliating against the new tariffs that Trump enacted on Thursday. Last night, China told its states to halt imports of U.S. agriculture. More troubling, and likely to irk Trump and his team, China let the Yuan depreciate by about 1.5% and importantly through 7 yuan per dollar. Both the market traded yuan and the official yuan (government fixed rate) rose from 6.97 to 7.10 per dollar. The 7 level was defended strongly by China’s government in the past.
Financial markets were shaken by the news. Equities are currently lower by 1.25-1.50%. Gold is up $11 and many commodities are trading sharply lower. The ten year U.S. Treasury note dropped 9bps in yield to 1.77%. Interestingly the U.S. dollar index is lower despite the yuan devaluation.
In Friday’s BLS employment report, payrolls grew 164,000 as expected, however last month’s print of 224k was revised lower to 193k. In total 41k job gains from prior months were lost due to data revisions. The unemployment rate is unchanged at 3.7%. Of note, average hourly earnings (monthly and annually) rose .01% versus last month’s figures as well against expectations.
On Friday, German 30 year Bunds fell to a negative yield and with that, Germany joined Switzerland with negative yields across the entire spectrum of their respective government debt.
The odds of a 25 bps September rate cut, which fell sharply after the FOMC meeting, have risen back to 100%. Further the market has priced in another full 25bps by the end of the year. If problems with China continue to ramp up we suspect that the market will not only increase the implied amount of future rate cuts, but price in the possibility of a cut before the next meeting in mid-September.
August 2, 2019
Yesterday, a 1% gain in the S&P turned into a nearly 1% loss within minutes on word from the President that more tariffs are being placed on China. On September 1st, a 10% tariff will be placed on the remaining $300 billion of goods and services that the US imports from China. The new tariffs are in addition to the 25% tariff on $250 billion of trade. We would not be surprised to see China depreciate their currency, the Yuan, against the dollar as a means of retaliation. Measures towards Hong Kong or Taiwan are also possible. Other notable market moves from yesterday include: Oil -7%, Gold +1.4%, and the ten year UST yield -12bps.
The BLS employment report will be released at 8:30 this morning. The table below, courtesy Econoday, has the consensus estimates. CLICK TO ENLARGE
U.S. PMI came in slightly better than expectations at 50.4 and while it avoided falling into economic contraction territory it was the lowest reading since September of 2009. Employment fell for the first time since 2013, confirming labor weakness reported in the Chicago PMI from Wednesday.
US Manufacturing ISM was weak at 51.2 versus expectations for 51.9. Within the survey employment fell to a 3 year low. Given the recent set of surveys we suspect that jobless claims will begin to uptick in the weeks ahead. It may take a month or two before these effects show up in the monthly BLS employment report.
August 1, 2019
As expected the Fed cut rates by 25 bps and ended QT, two months prior to what they had said a few months ago. Two Fed members, George and Rosengren, voted against cutting rates. The Fed’s rationale for taking action are “implications of global developments” and “muted inflation pressures.” They left the door open to future cuts but Powell called this is a “mid cycle action”, implying today’s action is not one of many more to come. More directly he said- “Let me be clear, what I said was, it’s not the beginning of a long series of rate cuts.” The most important takeaway is that the press conference was not confidence inspiring. Valuations across many asset classes are extreme and in large part due to investors confidence in the Fed’s ability to support markets.
Stocks and gold were weaker while the dollar soared, breaking out to two year highs. A stronger dollar is deflationary and will further aggravate the trade deficit and complicate trade talks.
President Trump was not happy with the Fed. To wit- “As usual, Powell let us down.” We advise scrolling down and re-reading our July 2nd commentary for thoughts on Trump’s possible reaction to yesterday’s Fed meeting.
Currently, Fed Funds futures are only priced in for a 63% chance of a cut at the next meeting, where as it stood at 100% prior to yesterday.
Lost in the hoopla of the Fed meeting yesterday was the ADP employment report and the Chicago PMI.
ADP reported that the number of new jobs added in July was 156,000, in line with estimates. Based on ADP, our model is forecasting a gain of 175k new jobs in Friday’s BLS report. This compares to the current consensus estimate of +151k jobs. Last month our model performed poorly, underestimating the number by 93k jobs, however over the prior three months its average miss was only 12k jobs.
Chicago PMI fell into economic contraction territory at 44.4 (50.5 expectation), its lowest reading in almost five years and second lowest since the Financial Crisis. The employment and new orders sub-components both fell below 50, also signaling contraction. Eyes will be on today’s release of the National PMI at 9:45 to see if it follows in Chicago’s footsteps.
July 31, 2019
Happy Fed Day!! The Fed will release their FOMC monetary policy statement at 2pm and Jerome Powell’s prepared remarks and press conference will start around 2:30pm. We agree with the market consensus that the Fed will cut rates by 25bps. It is likely there will be one or two dissenters that will argue that rate cuts are not needed at this time. Investors will be focusing on any changes to the statement about future rate cuts. We presume Powell will also answer media questions that will further clarify the Fed stance over the next six months. Currently, the Fed Funds Futures market is priced for 35bps by year end and about 50bps by March of 2020.
Last week we questioned recent headlines by Chicago Fed President Charles Evans. In Federal Reserve Headlines: Fact or Fiction we reviewed his rationale for cutting rates and presented data to help our readers decide if a cut, based on his justification, was indeed warranted. As you consider the media spin on today’s meeting, this article may prove helpful.
We bring up the two articles and our most recent article because it is important to remember that the financial markets are now, more so than ever, being supported directly and indirectly by the Federal Reserve. Current instances of extreme valuations are based on TRUST in the Fed and a belief that Fed will do the right things. Any breach of trust could have a large effect on asset prices.
July 30, 2019
A few subscribers commented on yesterday’s commentary in which we brought up the sharply negative revision to corporate profits. To help them and all subscribers grasp the magnitude of the revision, we present the graph below which provides a before revision and after revision look at corporate profits. Corporate profits now stand below levels of March 2014. The data includes all private and public domestic companies. CLICK TO ENLARGE
Yesterday, the yield on Switzerland’s 50 year bond went negative. As such their entire yield curve now has negative yields.
The British pound has been declining since March when it appeared likely that Boris Johnson would become the new Prime Minister. Now that he is the Prime Minister and the October 31st deadline for a BREXIT deal with Europe is rapidly approaching, traders are increasingly betting that BREXIT will be hard, meaning no deal. Given Johnson’s tone and willingness to push for BREXIT, deal or no deal, we suspect the pound will continue to sell off. It currently stands at 1.2165 to the US dollar, down from 1.3150 in March.
Apple will release quarterly earnings after the close. The current consensus is for quarterly EPS of $2.10 as compared to $2.34 in the same quarter last year. More importantly, traders will be looking for guidance on China’s slowing economy and how trade talks are currently affecting the company’s profits.
July 29, 2019
Second quarter GDP was slightly stronger than expected at 2.1% growth versus expectations of 1.9%. The growth was driven by a 4.3% surge in consumer spending and the largest growth in government spending since the Financial Crisis. Working against consumer and government spending was an unexpected increase in the price index (GDP deflator) to 2.4% versus expectations of 2.0% and a decline in business investment by -0.6%. It was the first quarterly decline in business investment since Q1 of 2016. Also corporate profits were revised lower and importantly now point to zero profit growth over the last five years.
The combination of better than expected growth and what appears to be an uptick in inflation puts the justification for a rate cut at Wednesday’s Fed meeting into question. The Fed has largely leaned on lower inflation as a reason to cut rates. GDP prices along with the most recent CPI/PPI reports and inflation expectations are on the rise.
In addition to the Fed meeting and Jerome Powell press conference on Wednesday, there will be important economic data to follow. Of note the Chicago PMI and ADP labor report will be released on Wednesday, PMI Manufacturing Index on Thursday, and the jobs report on Friday. There will also be a large number of companies reporting earnings throughout the week.
July 26, 2019
The ECB did not cut rates at yesterday’s meeting but discussed the need to use greater amounts of monetary policy to prevent lower inflation. Many ECB watchers now believe the restarting of QE is a question of when not if. The ECB also introduced the potential for new asset types to be purchased. European bond yields fell on the dovish statement.
Strong earnings after yesterday’s close from GOOGL and INTC are pushing those shares and the market higher this morning. AMZN earnings fell short of expectations however guidance for next quarter was a little better than expected. In the premarket GOOGL is up over 8%, INTC 4% and AMZN is down a little more than 1%.
Second quarter GDP will be released at 8:30 this morning. Wall Street consensus is for 1.9% growth with a range of 1.6-2.2%. The Atlanta Fed GDPNow forecast is for +1.3%.
Another side effect of the Trade War with China along with slowing economic growth in China, is less Chinese direct investment into the US. Per Business Insider “Chinese FDI (foreign direct investment) peaked in 2016 at $46.5 billion — this has now fallen to $5.4 billion after Trump took office.” Today’s chart of the day shows how cash buyers of real estate are declining. This is no doubt a direct result of fewer Chinese buyers/investors.
July 25, 2019
The ECB meets this morning with the market assigning a near 50% probability of a 10bps rate cut to their deposit rate which currently stands at -.40%. The Flash PMI readings out of Europe, and in particular Germany, are likely the latest bit of data pushing the ECB to take action.
The amount of negative yielding global debt reached a new high yesterday at $13.41 trillion as economic weakness in Europe and the possibility of even further negative rates at today’s ECB meeting is driving yields lower. To wit, German 20 year Bunds breached 0% matching a low from early July and French 10 year Oats fell below zero for the first time. We have also seen articles talking about bank customers that are now being offered negative rate loans. Not sure using the word “loan” is appropriate for a negative yield bond, but we will go with it for now.
Yesterday, U.S. Flash PMI composite registered at 51.6, an improvement over last month’s 50.6, however the manufacturing component fell from 50.1 to 50 and now sits on the cusp of contraction. This is the worst reading for manufacturing in ten years. Durable goods- new orders- released at 8:30 is expected to rebound +0.5% versus a prior decline of 1.3%. On the flip side core capital goods is expected to decline to +.02% from +.04%. GDP will be released tomorrow morning.
July 24, 2019
The stock market broke out of its summer doldrums yesterday with the S&P 500 rising 20 points on news that a US trade delegation is headed to China for talks.
Economic data out of Europe last night points to further economic contraction. The forward looking Flash PMI for the entire Eurozone fell to 46.4 versus last month’s 47.6. Germany appears the be the economic laggard in Europe with their PMI number contracting to 43.1 vs 45.0 and expectations of a slight increase to 45.3. This data makes policy action by the ECB at tomorrow’s meeting more likely.
Since Friday, when the New York Fed uncharacteristically walked backed the aggressively dovish comments of President John Williams from the day prior, the rate markets have reduced the odds of a 50bps rate cut to under 25%. Given the Fed is in blackout until the meeting and some future concerns have been lessened (Debt Cap/BREXIT) we believe the market will go into the meeting expecting 25bps. Consider that the markets are guided by expectations and if the Fed were to do nothing or cut 50 bps while the market is priced for 25bps of a cut, a spike in volatility (up or down) is probable.
The US dollar (US dollar index) has strengthened over the last month and now stands at one month highs and less than .75 cents from reaching 2 year highs. Continued strengthening will pose problems for the global economy as it essentially reduces liquidity for the worlds reserve currency. Typically emerging markets, which have significant amounts of dollar based debts, are most affected as their interest expenses and ultimate repayment of principal increase with the dollar. A strong dollar puts pressure on China which could help with trade negotiations but it also makes U.S. goods in foreign markets more expensive, thus hurting U.S. exports. While there are pros and cons from a political perspective, it is likely that Trump and Treasury Secretary Mnuchin will talk down the dollar if the recent trend continues.
July 23, 2019
Congress and the administration have reached a deal to extend the debt cap limit for two more years, pushing it past the coming election. This news eliminates one of the Fed’s worries that justified cutting rates. The deal allows over $1.3 trillion in deficit spending over each of the next two years, which is a slight pickup in spending versus the current level. 100% of the nation’s debt is now being funded domestically, a stark difference from the past. As such we think you should read or re-read an article we wrote a month ago called Who Is Funding Uncle Sam?
In the article we wrote: “It is probable that, barring deflation or a notable stock market decline, higher interest rates will be required to attract marginal domestic investors to purchase U.S. Treasuries. It is also fair to say that the onus of buying more U.S. Treasuries that is falling on domestic investors will likely result in a higher savings rate which negatively effects consumption.” In hindsight, given the Fed’s recent behavior, we would add an expectation that the Federal Reserve will be forced to fund some of the deficit with QE.
This Thursday the ECB meets with rising expectations that they may cut rates or at a minimum raise the possibility at coming meetings. Such an action would clearly be a response to the Fed’s likely cut on the 31st and an attempt to push the euro lower against the dollar.
July 22, 2019
Economic data will be sparse this week except for Friday when the BEA is scheduled to release quarterly GDP data for the second quarter.
Corporate earnings will take center stage this week as approximately 30% of the S&P 500 and Dow 30 are scheduled to report. While earnings and revenues matter, we think forward looking guidance from management will carry more weight than normal. For a daily list of coming earnings and expectations we recommend following the NASDAQ earnings calendar.
On Friday the New York Times released the following statement from NY Fed President Williams: (the Fed wants to) “vaccinate the economy and protect it from the more insidious disease of too low inflation.” This message and the comments we discussed in Friday’s commentary, come as the Fed enters their self-imposed media blackout period. The Fed appears panicked that the market did not expect the Fed to reduce rates by 50 basis points. The Fed’s urgency to cut rates and telegraph their intentions leave us concerned. As we have posited in the past- what do they know that we do not?
We end with a statistic from @oddstats:
The S&P 500 has now gone 34 straight sessions without a single -1% day, while returning +8.16%.
The last time the index went at least 34 days without a -1% day and was up at least that much?
January 29, 2018.
July 19, 2019
The Philadelphia Fed Business Outlook Survey) came in strong at 21.8 versus expectations of 4.5 and a prior month reading of 0.3. This index, which surveys manufacturing conditions in the Philadelphia Fed region provides a welcoming sign that economic growth may be on the upswing. Further, the four key components also showed sharp increases (employment, new orders, capital expenditures, and prices paid). We do caution, however, this index is very volatile and the strong reading may just be a rebound reflecting short term relief that the tariffs on Mexico, that Trump threatened June, never came to fruition.
Fed Vice Chair Clarida had some very dovish words in an impromptu FOX BusinessNews interview. In particular the following statement caught the market’s eye: “Research shows you can act preemptively when you can.” New York Fed President Williams echoed his comments earlier in the day: “It’s better to take preventative measures than to wait for disaster to unfold.”
The takeaway is that the Fed will lower rates regardless of economic data if it thinks there may be problems in the future. This one statement appears to give the Fed carte blanche to act based on premonition instead of facts as has always been the case. It appears that a 50 basis point cut on July 31st is back on the table as the odds, based on Fed Funds futures, increased from 34% to over 70% yesterday.
July 18, 2019
Overnight Netflix (NFLX) is down over 11% on their second quarter earnings report. Earnings and revenues were largely in line with expectations but what is upsetting to investors is that the net number of subscribers only grew by 2.07 mm versus expectations of 5.06 mm. Management expects a pick up in the third quarter. Given the valuation of the stock and high growth rate the valuation implies, the market was likely to sell anything short of a great report. This holds true for other “high fliers” that are priced for near perfection.
A Bank of America survey of portfolio managers said that 1% of those surveyed expect inflation to be higher over the next 12 months. While debt, demographics, and productivity trends argue that inflation will be lower in the future, there is a potential for a short term, temporary spurt in inflation. Such a scenario would be problematic for the Fed and markets and therefore bears watching closely. If inflation upticks, the Fed will find it harder to lower rates or do QE. In fact, they may have to raise rates if inflation were to rise too much. At the same time interest rates would likely increase on longer term bonds which would put pressure on the economy, quite possibly forcing it into a recession.
Our forecast remains for lower inflation but we pay close attention when everyone is on one side of a trade.
Another interesting survey we recently saw said that 2% of professional investors expect value to outperform growth. Many investors are focused on the trend of the last five years and not the reality of the last 100 years. For more on Value versus Growth please read our four part series of RIA Pro articles called Value your Growth. Today’s Chart of the Day shows how value has consistently outperformed growth over ten year periods, except over the last five years.
Both surveys show investors are caught up in what is defined as Recency Bias. For more on Recency Bias please read Don’t be a Victim of Recency Bias.
Retail Sales handily beat expectations yesterday, rising 0.4% versus expectations of +.01%. With 2 consecutive monthly gains of 0.4% and inflation data/expectations creeping higher, the case for Fed rate cuts continue to diminish. Per JP Morgan: “Since the June FOMC, the three most important monthly data reports—employment, CPI, and retail sales—have all come in quite strong…”
We still think the Fed will cut 25 bps as they do not want to upset the markets or President Trump, but they will likely tone down expectations for additional cuts later this year and early next year. Currently the Fed Funds Futures market is still pricing in a 25% of a 50bps rate cut on July 31st. We suspect that will fall to near zero over the coming days.
Powell spoke in Paris yesterday and provided us with a clue on why the Fed is likely to cut rates despite a solid domestic case to do so. Per the WSJ: “Federal Reserve Chairman Jerome Powell highlighted the growing importance of global developments in monetary policy—a reflection of how slowing growth abroad could prompt the U.S. central bank to provide new stimulus despite steady labor markets and consumer spending.” As we suspected it is likely that European central bankers are leaning on the Fed to cut rates and halt dollar appreciation. It is also probable they are also persuading the Fed to help Deutsche Bank which is showing many signs of a potential failure.
July 16, 2019
Earning season is underway. On Monday, Citigroup (C) was the first large company to announce earnings for the second quarter. Earnings and revenues slightly beat expectations. Citi’s competitors (JPM, GS, and WFC ) will announce earnings today, along with pharmaceutical JNJ.
For the next few weeks a slew of earnings announcements and forward looking guidance will set the trading tone. It is likely that reduced earnings and revenue guidance/expectations, which happened over the prior months, will allow many companies to meet or exceed guidance. While this may appear to be good news, we are on guard against negative forward looking guidance and cautionary statements from corporate CEO’s and CFO’s.
Yesterday’s Chart of the Day showed that CEO confidence for the remainder of the year is at or near recessionary levels. If a lack of confidence translates into a reduction in earnings guidance from companies, good earnings news may be offset with a deteriorating outlook.
Yesterday Blackrock said they expect S&P earnings growth to be negative for the first time since 2016.
Political posturing has begun as Congress addresses the Treasury departments need to extend the debt cap. On the current spending path, the Treasury will be unable to fund itself at some point in September. Nancy Pelosi has come out swinging, saying the Democrats will not approve any additional spending or a cap extension without a budget in place. Mnuchin, Secretary of Treasury, has responded calling for an extension first and then negotiation of a budget deal. As we have witnessed many times over the last decade, political games will be played as this is much more about posturing for voters than actual budget issues. As we get closer to September without a resolution it is more likely the markets, especially short term T-bill yields, will get more volatile.
July 15, 2019
Like CPI on Thursday, Friday’s PPI report came in higher than expectations. PPI was 0.1% higher than expectations while core (ex food and energy) was 0.2% higher on a year over year basis. Over the last month inflation expectations have begun to rise slightly. Currently the Fed’s 5yr- 5yr forward inflation expectations rate stands at 1.91% up from 1.77% in mid-June. Their 10-yr breakeven inflation rate has also risen by a similar amount. Over the past few months, many Fed members have mentioned lower inflation expectations as a key justification to lower rates. If inflation expectations keep rising, it could put a wrinkle in the Fed’s plans to cut rates. While we still think 25 basis points is a lock, they may pull back on plans to do more later in the year if inflationary pressures continue to rise.
China’s 2nd quarter GDP met expectations (as it always does) with a reading of +6.2%, as compared to 6.4% in the prior quarter. Still a high rate of annual economic growth but it has slowed to levels not seen in almost 30 years.
The economic calendar is relatively light this week, however one of the more important data points, Retail Sales, will be released on Tuesday. Later in the week earnings season will be begin in earnest. We will have more on specifics in upcoming commentaries.
July 12, 2019
CPI was slightly hotter than expected for June. Importantly, core CPI (excluding food and energy) rose 0.3% versus expectations of +0.2%. The higher reading pushed the year over year core CPI growth to 2.1%, which is above the Fed’s 2.0% inflation target. Also of note, jobless claims fell from 222,000 to 209,000. Producer prices (PPI) will be released today and expectations are for an increase of 0.1% and 0.2% excluding food and energy. The year over year number ex. food and energy is expected to be 2.2%.
Between CPI, jobless claims and last week’s employment data, it is becoming even more confounding why the Fed is so intent on lowering rates in later July. Remember, the Fed has two mandates: stable inflation which they deem as 2% and a strong labor market. Given they are meeting their mandates, it is looking more likely that Powell and the Fed are bowing to political pressure both domestically from Trump, but also likely from other nations that are feeling the financial pain of a stronger dollar.
While Powell largely repeated himself yesterday in front of the Senate he did answer a question about corporate debt and the potential risks. Per Powell- “DON’T SEE CORP. LEVERAGE RISING TO SYSTEMIC RISK LEVEL.” Like his unusual comments about employment yesterday, we find this also curious at best and disingenuous at worst. Gross and net corporate leverage are at all times highs as is the ratio of corporate debt to GDP.
July 11, 2019
The following quote from Powell’s prepared remarks to Congress yesterday tells the whole story- “it appears that uncertainties around trade tensions and concerns about the strength of the global economy continues to weigh on the U.S. economic outlook.” Powell left little doubt that the Fed will cut rates on July 31st as he gave what appears to be the most dovish speech of the year (see Today’s Chart of the Day). It now seems like the Fed is hyper-focused on what could hurt the economy and willing to take action to insure against it.
At this point the only question is whether the Fed will cut 25 or 50 basis points on July 31st. Instead of focusing on the Fed’s baseline outlook – “economic growth to remain solid”, he instead seemed to be selling reasons to justify lower rates. In particular he mentioned:
Business investment growth “slowed notably”
Trade developments
BREXIT
Federal Debt Ceiling
Also of note, Powell said: “We’ve got no evidence to call this a hot labor market.” Quite an odd statement considering the unemployment rate and jobless claims are at 50+ year lows.
This morning CPI comes out and expectations are for 0.0% monthly and a 1.6% increase on an annual basis. Excluding food and energy, the expectation is for a 0.2% increase monthly. Given Powell’s remarks about inflation, and knowing he had the CPI report prior to his testimony, we think it is possible that this report could be weaker than expectations.
August Fed Funds futures rose 7 basis points yesterday, implying that the market is once again putting odds on a 50bps rate cut at the July 31st Fed meeting. Those odds stand at 33%.
Powell will speak to the Senate today, so stay tuned for more information about monetary policy.
July 10, 2019
Chairman Powell will testify to the House on the current state of monetary policy at 10 am this morning. We will be on guard for any indication that the Fed is backing off on cutting rates at the coming July 31st meeting. The bonds markets are teetering between expectations for a 25 and 50 basis point cut. There is likely to be volatility in the markets during the Chairman’s initial speech and during the question and answer session. If Powell gives any inclination that the Fed may not cut at all, risk markets are surely to get hit. Given typical DC politics, we suspect some Democrats will try to stir the pot and ask Powell questions about Trump and Fed independence. Tomorrow Powell testifies to the Senate.
After writing yesterday’s commentary about negative yielding sovereign bonds in Europe, we stumbled upon this interesting and quite honestly shocking Bloomberg article: Sub-Zero Yields Start Taking Hold in Europe’s Junk-Bond Market.Per the article there are now 14 junk rated corporations in Europe whose bonds trade with a negative yield. Essentially, investors are paying (not being paid) to take on the high credit risk these companies offer. Quite frankly we struggle to wrap our head around this situation as it implies that deflation will run rampant in Europe and/or that these 14 companies are risk free.
July 9, 2019
Over the weekend German investment bank Deutsche Bank (DB) announced plans to cut jobs and business lines in order to help the ailing bank avoid potential bankruptcy. Despite massive bailouts over the last decade the bank remains in dire circumstances. While DB’s market cap is relatively small at $16 billion, they are sitting on nearly $50 trillion of derivatives which is similar to much larger banks like JP Morgan and Citigroup. It is for this reason that a DB failure could have wide ranging effects on banks around the world. DB’s share price peaked in May of 2007 at $150. This morning it is trading at 7.34. Negative interest rates and flat yield curves have wreaked havoc on European banks leaving DB and many others in perilous state, despite the near decade long recovery and massive monetary stimulus.
Today’s Chart of the Day shows an index (average) of selected global sovereign bond yields. The index currently sits at the low yield levels of 2015/2016 and well below all other data going back to at least 1900. A primary driver of yields is expected inflation which in part is related to expected economic growth. While equity markets continue marching higher and imply solid economic growth, bonds markets are sternly warning the opposite. The chart below further highlights how low global yields are for a number of leading economies. Note that Japanese yields and some European yields are negative across their respective curves. It is also worth mentioning that there are now over $13 trillion of negative yielding bonds, surpassing the amount in 2016 and nearly double the amount that existed nine months ago.
Click to Enlarge.
July 8, 2019
The headline payrolls number (+224k) from Friday’s report was much stronger than our model expected (+128k) as well as Wall Street’s consensus (+165k). That said, other data within the report was not as favorable. For instance the unemployment rate ticked up from 3.6 to 3.7%, and hourly earnings and hours worked both came in 0.10% short of prior month readings and expectations.
Bonds, and in particular Fed Funds futures, sold off on the employment report as investors reduced the likelihood of a 50 basis point rate cut on July 31st. Currently the odds stand at 50/50 for a 50bps cut.
Economic data for the week is light with CPI on Thursday and PPI on Friday being the only important economic data of note.
Jerome Powell will speak on Tuesday at the Boston Fed and then testify on Wednesday and Thursday in front of the House and Senate respectively. The market will be listening closely for any indications of policy changes at the July 31st meeting, as well his opinions on Fed independence.
Second quarter earnings releases will start this week, however the following week will see a significant ramp in earnings releases led by the financials on July 16th and 17th.
July 5, 2019
In case you missed our update from Wednesday: “ADP was weaker than expected, coming in at 104,000 new jobs added in June. With this data, our model now expects payrolls to increase by 128,000 jobs as compared to the consensus at 160,000 jobs.”
This morning the BLS will release the June employment report at 8:30. After an initial flurry of trading we expect the markets will be very quiet as many traders are on a prolonged July 4th vacation. The consensus number of new jobs has increased slightly to 165,000 since we wrote our commentary on Wednesday. Expectations for other significant jobs data is below. Click to Enlarge.
July 3, 2019
UPDATE: ADP was weaker than expected, coming in at 104,000 new jobs added in June. With this data, our model now expects payrolls to increase by 128,000 jobs as compared to the consensus at 160,000 jobs.
This morning ADP will release their monthly employment gauge. Expectations are for a rebound with the addition of 140,000 jobs. As a reminder ADP was very weak in May reporting only 27,400 new jobs. Based on the most recent ADP consensus forecast, our model forecasting for this coming Friday’s BLS labor report expects payrolls to rise by 160,000 jobs, well above last months 75,000 gain but 10,000 below the consensus forecast. We will update this commentary with a revised forecast after ADP releases their data at 8:15am.
Yesterday, Cleveland Fed President Loretta Mester stated that she does not see the need to lower rates unless more bad economic data emerges. Given she is one of the more dovish members of the Fed, her statement and others she made, should concern traders that an expected 50 basis point rate cut is not a done deal. While 25 basis points is very likely, better economic data may put that call into question.
Trump nominated Judy Shelton and Christopher Waller to the Federal Reserve Board. Shelton is far from a traditional Fed economist. She has admitted that the Fed does not have the ability, nor any central bank, to correctly manage the money supply. She is a hard money advocate as well, meaning money supply should be backed to or linked to gold or some other index or asset that essentially governs the supply of money. Also of note, she believes Fed Funds should be brought down to zero over the next year or two and the free market should set borrowing rates across the curve.
July 2, 2019
On Sunday and Monday, PMI was released for the US as well as most major economies. US PMI was 50.6, still in economic expansion mode and a fraction above last month’s reading. The majority of the rest of the world was not so lucky. Global PMI fell further into a contractionary reading of 49.4 vs 49.8 in the prior month. China, Japan, UK, Germany, Italy and a host of smaller countries are now below 50. Of note is Germany which dropped to 45. The ten year German Bund now stands at a record low of -0.36.
A quick note about our latest thoughts on the potential for Trump to fire/demote Chairman Powell-
The Chairman of the Federal Reserve is appointed by the President and approved by the Senate. Despite the selection of the Fed Chairman and board members, the Fed is independent and does not take orders from the President or Congress. It is this veil of Independence that is a key reason that monetary policy has not been abused as it has in other countries where government is directly involved in setting policy. If Trump were to fire or demote Powell, this veil could be weakened and the short and longer term consequences to the economy, inflation, and the dollar could be severe. This is why we have made a big deal in past commentaries about the potential for President Trump to fire Chairman Powell and will continue to do so.
To better understand the situation we spoke with a labor arbitrator to get his opinion on whether the President can fire Powell for “cause.” He thinks that the President certainly fire him, however differences in opinion on policy typically do not qualify for “just cause”, and he believes that such a decision could be easily overturned by the courts. Interestingly, he did say that based on his interpretation of the Federal Reserve Act, which governs the Fed and appointment of key Fed positions, the President can demote Powell with fewer complications. He thought it would be contested in some form but would have a greater chance of working.
Note that over the last few months the President only used the word “fire” when talking about what he wants to do with Powell. In the last week or so the word “demote” has been used. It is likely Trump’s advisors are on the same page as our arbitrator. We will continue to inform you as this beltway soap opera continues.
July 1, 2019
The continuation of trade talks with China sparked a rally in the equity markets over night. Currently the S&P is up over 40 points. This weekend’s newsletter The “Art of the Deal” versus The “Art of the War” shares our current thoughts on what transpired over this past weekend between President Trump and Xi. Also presumably helping the market was Trump’s visit to North Korea and increased prospects for peace on the Korean peninsula.
Looking ahead on the economic front, the last BLS employment report before the Fed meets at the end of the month will be released this Friday. Also of importance this week, especially given last Friday’s sub-50 reading from the Chicago PMI report, will be the ISM and PMI manufacturing surveys released this morning. On Wednesday ADP will release their labor report which has a strong correlation with the BLS report due Friday. Domestic markets will be closed on July 4th and barring any big surprises in the employment report market, we suspect it will be a dull trading day.
June 28, 2019
UPDATE: Chicago PMI printed at 49.7, signaling economic contraction. As noted below, this is likely to increase economic concerns at the Federal Reserve.
The string of bad Fed indexes and surveys continued yesterday as the Kansas City Fed Manufacturing Index fell to zero versus expectations of +3. As shown in the June 26th Chart of the Day, this index adds to the list of indexes/surveys that are perilously close to signaling economic contraction.
The Chicago PMI, a widely followed survey of purchasing managers, will be released at 9:45 this morning. Expectations are for an expansionary reading of 53.6. While not expected, a contractionary reading below 50 would almost certainly increase calls for the Fed to take action sooner rather than later. The index has steadily declined after piercing 64 in February.
Bitcoin has been on quite the roller coaster over the last week. On June 20th Bitcoin opened up at $9500. Six days later on June 26th it was 45% higher at 13,850. It then proceeded to fall below 11,000, but has gained some ground since as it stands at 11,850 this morning. To be honest we are not quite sure what to make of the extreme volatility in Bitcoin and other cryptocurrencies and have seen no evidence of related volatility in the major asset classes.
As discussed in prior commentaries, the G20 meeting will be conducted this weekend. While a China-US trade deal is not expected, the market will be on the lookout for signs that the two parties are making progress with the potential for an agreement later in 2019.
June 27, 2019
As the second quarter comes to an end asset managers are once again partaking in window dressing and portfolio rebalancing actions. Window dressing is when managers, who report their holdings monthly or quarterly, sell what hasn’t been working and buy what has recently traded well. These trades give their clients the appearance that their portfolios are well positioned for the current market dynamics. Rebalancing is when portfolio managers buy and sell their current holdings to bring them back in line with targeted allocations. For instance, the utility sector is up over 20% this year alone. Managers that have held XLU for the year will find that their allocation to the sector is 20% over their targeted goal. As such they may sell about 20% of XLU to bring it back to its target weighting. At the same time they are likely buying those sectors or stocks that trailed the market and have become underallocated in their model.
Both window dressing and rebalancing can cause strange move in individual stocks, sectors, and at times even asset classes as we may likely see with bonds and gold due to their recent surges. As an aside, unlike many managers, we rebalance when we believe an asset is at a price that warrants adding to or reducing. Other than tax related trades, we do not let the calendar dictate our portfolio management.
The US and China have reached another truce heading into the G20 meeting this weekend. As part of the truce the US will hold back on additional tariffs. This is likely a requirement of the Chinese if they were to hold talks this weekend. This is a positive step forward but it still appears there are a lot of differences, so while progress may be made this weekend, expectations for a deal are slim.
June 26, 2019
Consumer Confidence fell sharply from 134.1 to 121.5. Of concern was the jobs hard to get question. Per Econoday- “Jobs-hard-to-get in this report are closely tracked by forecasters as an early signal for the monthly employment report….Now this question, surging 4.6 percentage points to 16.4 percent, is signaling significant weakness for June’s employment report.”
Today’s Chart of the Day highlights the rapid decline in a host of regional and national surveys and outlooks. We have discussed individual survey and outlooks on numerous occasions over the past few weeks but this graph provides a more complete picture of seven of the most watched ones. As shown, the recent decline is sharp but does not necessarily portend a recession is imminent. As we saw in 2016, surveys based on expectations fell sharply, but hard data reflecting the actual decisions businesses make slowed but not to recessionary levels.
Hard economic data released this summer will be important to follow as we look for signs that the surveys accurately reflected the mood of corporations or that the corporations were concerned for a while but did not back up their concerns with actions.
The Trump-Powell saga continued yesterday as Powell responded to Trump’s latest barrage against the Fed Chair. In particular Powell stated that the “Fed is strictly nonpolitical and won’t make mistakes of integrity or character.” Further, “The Fed is insulated from short-term political pressures -what is often referred to as our ‘independence. Congress chose to insulate the Fed this way because it had seen the damage that often arises when policy bends to short-term political interests.” This may seem like nothing more than a political battle and media headline fodder, but if Trump were to take action against Powell the consequences on markets and the economy could be severe. For more on this read Market Implications for Removing Fed Chair Powell.
June 25, 2019
Last night we published Investors Are Grossly Underestimating The Fed on RIA Pro. The article provides evidence that the market, without fail, underestimates how much the Fed will raise or lower interest rates. While it appears the market is aggressive in pricing 3 rate cuts by year end, history argues they may not be pricing in enough? To read the article click the link below.
The Dallas Fed Manufacturing survey, like the Fed’s Philadelphia Business Outlook Survey and Empire State Survey, fell sharply from -5.3 to -12.1 (worse than the lowest analyst estimate) and is the lowest reading since June 2016. The Chicago Fed National Index was better than expected but is still in negative territory. The weakening of Fed surveys helps explain, in part, why the Fed has become more dovish over the last few weeks.
President Trump continues to publicly share his thoughts on Chairman Powell and the Federal Reserve’s policy stance. Specifically, yesterday in reference to the Fed he stated “Federal Reserve that doesn’t know what it is doing.” It is clear the dovish talk from Mario Draghi of the ECB coupled with no rate cut at the June 19th Fed meeting irritated the President. To wit: “Now they stick, like a stubborn child, when we need rates cuts, & easing, to make up for what other countries are doing against us. Blew it!”
Currently this dissatisfaction may only be Beltway politics, however there are potentially wide ranging and underappreciated consequences if the President took the unprecedented action of firing or demoting the Fed Chair. We will discuss this topic and what firing or demoting Powell may mean for specific asset classes in our Real Investment Advice article to be published tomorrow.
June 24, 2019
This morning The Chicago Fed will release their National Activity Index and the Dallas Fed their Manufacturing Survey. With the latest round of surveys teetering on the verge on economic contraction we will pay close attention to these releases. As a reminder, last week the Philadelphia Fed Business Outlook Survey came in at +0.3 versus +16.6 the prior month and against expectations for an 11.0 increase. A reading below zero on this index points to contraction.
The highlight of the week might likely come tomorrow when Jerome Powell speaks for the first time since last week’s Fed meeting. This “conversation” with New York Times reporter Neil Irwin will provide Powell the opportunity to further stress his views on Fed policy. We suspect Irwin will ask Powell questions around Trump’s latest round of comments about demoting Powell. James Bullard, the only voting member that voted for a reduction of rates will speak tomorrow night. Over the weekend, non-voting member Neel Kashkari told the media that he would have voted for a 50bps rate cut if he was a voting member.
June 21, 2019
The market rallied to new highs yesterday on the assumption is set to lower rates sooner rather than later. But this should not be a surprise since market participants have been trained to “buy” any time the Fed mentions “accommodative policy.” However, it was probably best to remember that historically when the Fed STARTS reducing interest rates, a topic we are covering in this weekend’s newsletter, it has been in response to a financial crisis, recession, or both as shown in the chart below.
Click Image To Enlarge
The other important point to remember is that while the “bulls” rallied to the markets to all-time highs, they did so on the assumption the Fed has already agreed to cut rates. However, that is not actually the case. It is an easy matter to remove the word “patient” from the prepared statement, it is another thing to actually cut rates when there is very little of that particular policy tool available. More importantly, the Fed did not actually “say” they were looking to cut rates and the Fed’s own “dot plot” shows NO easing for 2019 and only one rate cut in 2020.
As traders and investors it is important for us to pay attention to what “IS” rather than what the market “THINKS.” The market has priced in a scenario that hasn’t occurred which leaves investors vulnerable to disappointment.
Oh, and pay attention to what is rallying the most — Bonds, Gold, and Defensive Positioning. Such market action doesn’t necessarily suggest the most optimistic of outcomes.
June 20, 2019
While the Fed did not lower rates yesterday as some suspected, Wall Street and the media now believe the Fed is on a path to cut rates on July 31st with one or two more cuts to follow later in 2019. Almost all asset classes rose yesterday on the heels of the Fed announcement except for the US dollar. The dollar fell appreciably yesterday and is falling again this morning. It is now down over 1% versus other leading currencies and importantly about 50 cents below its 200 day moving average.
The markets, along with intense pressure from President Trump, are creating a dilemma for the Fed: The economy is doing well, but everyone is clamoring for lower rates. There are a lot of uncertainties that could change that picture but the Fed isn’t convinced that things will get worse.
Here are a few takeaways from the FOMC meeting and Powell press conference:
The removal of the word patient in reference to looking at economic data tells us they are ready to act quickly if economic conditions decline appreciably.
“It’s our objective to sustain the expansion,” – Powell
The Fed wants to see if the cross currents about trade and global growth continue to weight on the outlook before acting, he says.
Powell says there wasn’t much support for a rate cut today, although Fed President Bullard voted for a 25 basis point rate cut.
The risks to the expansion are evolving.
Powell says he’s concerned about the shortfall in inflation. “We need to be really strong on 2% inflation,” he says. “We certainly don’t want to be seen as weak on inflation, and I don’t believe we are.”
Many FOMC members pointed to weak capital spending and business sentiment as arguing for a rate cut, Powell says.
The Fed “wants to see more” before cutting rates, Powell says.
The divisions within the Fed run deep judging from the central bank’s projections of future interest rate moves known as the “dot plot.” Nine Fed officials predict no rate cuts this year while eight forecast one or two reductions.
The Fed dot plot does show a quarter-point cut in 2020 owing to a subtle shift in voting patterns, with rates rising again in 2021 to the current target of 2.4%.
The expectation that rates will rise in 2021 would seem to suggest the Fed thinks the record 10-year-old expansion will continue for at least a few more years — a sign of confidence in the economy.
The Fed stuck close to forecasts that gross domestic product will expand 2.1% this year, 2% in 2020 and 1.8% in 2021.
The Fed’s decision is likely to rub President Trump the wrong way, especially on the heels of renewed ECB dovishness. Trump has been pushing hard for a rate cut for months and the president has repeatedly criticized Powell, with the White House even going so far as to research whether it could remove him. We would not be surprised if Trump were to make more direct threats and possibly even take action to remove Powell. We will have an article coming shortly on the implication on asset prices if Powell were removed.
Gold is up over $35 overnight on dollar weakness and reports that Iran shot down a US drone. Also playing a role is that gold clearly broke above its five year resistance line. While its likely gold will at some point retreat back to the line of resistance before moving higher, it is possible the weakening dollar, dovish Fed and ECB, and tensions in Iran cause it to continue to surge higher.
Today is Fed day and for the first time in a while there are a wide range of potential results.
1- The Fed could cut the Fed Funds rate by .25% as an “insurance” measure. This would likely cause risk assets to soar but it might also be worrisome to investors as it signals a heightened level of Fed concern for the economy.
2- Most likely the Fed leaves rates stable but introduces new language to their statement that conveys a rate cut is coming at the July 31st meeting and others in the future are increasingly probable. Depending on the degree of dovishness in the statement the markets will probably like such a message. Keep in mind the bond, stock and gold markets have rallied strongly over the last few weeks on hopes for such an outcome, so an initial sell-off should not be unexpected.
3- Lastly, and highly unlikely, is a hawkish tilt in which future rate cuts are discounted. While completely unexpected, we should remind ourselves that the stock market is within one percent of a record high, employment at 50 year lows, and prices are stable.
After the FOMC meeting results are announced, Chairman Powell will hold a press conference and further explain the Feds thinking.
The stock market soared yesterday as it was announced that Trump will me Xi at the G20 meeting and discuss trade. The renewal of high level talks brings hope that the conflict can be resolved without more tariffs and further disruptions to trade. Also helping the markets was Mario Draghi calling for more dovish policy in the Euro region. The markets appear to be betting the combination of trade agreements and aggressive central bank policy will arrest any chances of a global recession.
June 18, 2019
One of the primary reasons the Fed is considering cutting rates as early as tomorrow is that the global economy is rapidly weakening. Last night the well followed German ZEW index of investor sentiment tumbled to -21.1 versus expectations of -5.6. German bund yields fell to an all-time low of -.30% (yes- negative). The euro is also lower versus the dollar as markets are pricing in the potential for more ECB rate cuts or QE.
S&P futures are currently up $10 overnight and bond yields are lower. The 10-year US Treasury yield is down another 4 basis points to yield 2.05%. Interestingly, the 3 month T-bill is up 3 basis points this morning, a sign that a Fed cut tomorrow is not as likely in the markets eyes.
Yesterday, the Empire State Manufacturing Index fell sharply from +17.8 to -8.6, the largest one month drop in almost 20 years. The New York Fed produces this survey based on the answers of approximately 200 manufacturing executives from the state of New York. While this is one report from one region, it does cover activity in June. Due to its timeliness we will keep an eye on out on upcoming manufacturing surveys to see if this an anomaly or reflective of a potential contraction in the manufacturing sectors of the economy. The Philadelphia Fed Survey will be released Thursday. It is likely the Fed already has its results as they ponder the path of future interest rate policy.
June 17, 2019
There are two main events this week which will be moving markets – The Fed meeting which starts tomorrow and the G-20 meeting where all eyes will be on the President for comments about the “trade war” with China.
We currently expect Fed policy to remain “unchanged” this week given the subjective odds of a June cut at only 10%. More importantly, while Goldman looks for a dovish tilt to the proceedings, the risk is it won’t be nearly enough to appease markets that have aggressively priced rate cuts in the fall.
Barring an unlikely surprise on the funds rate, we expect the market to focus on four key developments:
the statement’s policy stance/balance of risks paragraph,
the number of participants projecting cuts in the Summary of Economic Projections (SEP),
the extent of dovish changes to the statement and economic forecasts, and
the tone of Powell’s press conference.
The main reason why the Fed is poised to disappoint markets is simply that not enough has changed to warrant a clear signal of an upcoming cut. Indeed, “since the March SEP meeting, stock prices are higher, the unemployment rate fell to a 50-year low, consensus growth forecasts are unchanged, and the very tariffs on Mexico that prompted the latest calls for rate cuts have been taken off the table.”
Not only that, but the economy continues to chug along largely as expected: outside of May payrolls, the growth data still look decent: Goldman’s Q2 GDP tracking estimate has rebounded to +1.6%, Atlanta Fed GDPNow is +2.1%, and the bank’s own tracker of private final demand is at an even healthier pace (+2.8%).
We expect nothing to come out of the G-20 meeting but as shown in our CHART OF THE DAY below, Bank of America’s Chief Investment Officer, Michael Harnett, laid out a 2-by-2 matrix summarizing the four possible scenarios that could result from the Fed’s announcement next week, and the G-20 meeting on June 28-29, where there is a chance (if minuscule) that Trump and Xi will announce the trade war ceasefire, although far more likely, will simple lead to further trade war escalation.
Of these 4 scenarios, two are most remarkable: the best/best and the worst/worst cases. The first one sees a Dovish Fed statement, coupled with a G-20 deal, which according to BofA will send the S&P > 3000, and the 10Y yield to 2.00%, while the worst possible outcome would be if there is a 1) a hawkish Fed surprise and 2) no Deal at the G-20, which would send the S&P below 2,650, or potentially resulting in a 12% drop in the market, while slamming 10Y yields to 1.50% and helping gold rise above its 5 year breakout zone as the VIX surges.
June 14, 2019
Retail Sales for May will be released at 8:30 this morning. Expectations are for a 0.7% increase and 0.4% excluding autos and gas. Another indicator of the health of the consumer, the University of Michigan Consumer Sentiment Survey, will follow at 10:00 am. Economists expect a slight decline from 100 to 98.4.
Along with weak inflation and warning signs from the U.S. bond market, “a downward policy rate adjustment may be warranted soon” to help boost inflation expectations and help ease fears that have emerged in bond prices of a sharper-than-expected U.S. slowdown. -From a CNBC interview of Fed President James Bullard
This quote and other similar comments allude to the fact the some members of the Fed are expressing concern about inflation expectations. Regardless of the fact that expectations are well within longer term data trends, it is appearing more likely the Fed might use weak inflation expectations as a rationale for lowering rates.
Today’s Chart of the Day highlights the significant correlation (.759) between oil and inflation expectations. The price of oil has fallen 15 percent since last October and inflation expectations declined .29 percent over the same period. If oil continues to trend lower, inflation expectations will likely follow and we suspect the market will ratchet up the odds of future rate cuts. Stay tuned!
June 13, 2019
Like PPI on Tuesday, Wednesday’s CPI report was a little weaker than expectations. CPI m/m and y/y were both 0.2% weaker than the prior month. While neither report is overly concerning, they both point to limited price pressures. The market may perceive the price data in the two reports is more evidence the Fed has the green light to ease, however we remind you that one of the Fed’s closely watched measures of inflation, CPI excluding food and energy, is running at 2.0 percent y/y which is exactly the Fed’s preferred rate of inflation.
Two oil tankers were attacked in the Strait of Hormuz and as a result the price of oil is up nearly 4 percent this morning, recouping much of yesterday’s decline. Given the potential uptick in tensions with Iran, we will watch the price of oil closely for clues as to whether or not the incidents represent an escalation between Iran and the U.S. and Saudi Arabia. Iran has denied responsibility.
A few subscribers have asked us why investors are so willing to buy U.S. Treasury securities with yields in the low 2 percents. Our immediate answer is that we, and apparently quite a few other investors, believe that yields can go much lower, thus producing price gains on the bonds, and ultimately returns greater than the stated yield. Another important reason is where else can you find sovereign debt from a highly rated country with a yield anywhere close to those in the U.S. A quick tour of some potential options include German 10yr notes at -0.25, Japanese 10yr notes at -0.12, and U.K. 10yr notes at +0.87. Needless to say, U.S. 10yr notes at 2.12 seem mouthwatering!
June 12, 2019
Yesterday’s PPI inflation report was slightly weaker than expected. The year over year (y/y) rate increased 1.8 percent versus expectations of a 2.0 percent increase. However, the core number, which excludes food and energy, met the consensus estimate with a 2.3 percent y/y rise. Today’s CPI report will shed more light on the inflation picture. The market expectation is for increases of 0.1 m/m and 1.9 y/y. Core CPI is expected to come in slightly higher at 0.2 m/m and 2.1 y/y
Today’s Chart of the Day shows an important inversion in a very short term maturity Treasury yield curve. While the market is intently focused on the 2yr/10yr curve and waiting for it to invert, our eyes are on the 3month/6month T-bill curve. Based on history, this curve is warning that a recession is imminent. Check back later today as we will have more on this in an RIA Pro article entitled Quick Take: The Treasury Bill Yield Curve Says A Recession Is Imminent. The article goes into detail of the importance of the curve as well as provide support for Lance Robert’s saying “Sell the first Fed cut and buy the last.”
June 11, 2019
Trump has threatened China with higher tariffs if President Xi Jinping does not meet with him at the coming G20 Summit (June 28/29). The market does not seem overly concerned, trading up nearly half a percent in pre-market trading.
The members of the Federal Reserve just entered their self-imposed blackout period and are not allowed to speak publicly until after next Wednesday’s FOMC meeting.
Over the last two months we have increasingly heard quite a few Fed speakers bemoan the fact that inflation and inflation expectations are trending lower than their 2 percent target. Today at 8:30, the BLS will release the Producer Price Index (PPI) and follow it up on Wednesday with the Consumer Price Index (CPI). Both indexes are expected to come in at a +0.1 percent m/m increase, which is weaker than the prior month in both cases. If the data meets consensus, or is weaker, it likely further affirms the markets view that the Fed could ease as early as July 31st. Conversely, higher than consensus prints on the data may cause some second guessing.
One of the biggest risks to the bond and stock markets is that the market maybe wrong in that the Fed will not ease rates over the rest of the year. The graph below, courtesy Deutsche Bank, shows that such a scenario would certainly not be the first time the market was wrong about the Fed. In fact, based on the graph, we are putting some thoughts into how the market could be wrong- are they expecting too many rate cuts from the Fed, or not enough? CLICK TO ENLARGE
June 10, 2019
On Friday the S&P 500 rallied over 1 percent capping off a strong 150 point rally for the week. Friday’s gain came on what appeared to be a dismal employment report which raises the likelihood that the Fed could cut interest rates as early as mid-June, but more likely in late July. We use the word “appeared” because we learned this weekend that trade/immigration issues with Mexico were resolved and tariffs on Mexico will not go into effect. We have no doubt that there were traders/banks in “the know” and the rally on Friday, and possibly Wednesday and Thursday, was in part driven by those with knowledge of the pending deal.
The market rally and deal with Mexico does little to change our longer term market thoughts. We had anticipated a “sellable rally” as noted in this week’s Newsletter and the prospects of Fed easing along with the Mexican pact likely sped that rally up. Economic growth for the current quarter is estimated to range from .5 to 1.5 percent. Most investors think the slowdown from prior quarters is trade related. While there is little doubt some of it is related to trade, we believe the bulk of the slowdown is natural.
The benefit of corporate tax cuts, hurricane/fire emergency spending and larger fiscal deficits have largely run their course. Without these spending benefits the economy should fall back to its natural run rate. According to the Fed, the natural rate of real economic growth is 1.90 percent for 2020 and it declines from there. Based on productivity growth, debt and demographics we believe the rate is closer to 1.5%. Either way, such economic growth rates do not jibe with equity valuations that portend significant earnings growth in the years ahead.
June 7, 2019
UPDATE: The BLS reported that 75,000 new jobs were created in May, 105,000 below the consensus estimate and 15,000 below the lowest estimate. The number was 2,000 more than the average of our two estimates. Average hourly earnings and private payrolls also missed estimates. We must remember this is only one months worth of data and certainly doesn’t constitute a trend. That said, we will follow other employment indicators closely in the weeks ahead as it does help confirm other signs of a weakening economy.
At 8:30 am the BLS will release the monthly employment report for May. Today’s data will be watched closely for signs the slowing economy is hampering the jobs market. On Wednesday, we highlighted ADP’s employment survey and in particular the fact that it only increased by 27,000 jobs for the month of May. Not only was the report significantly below Wall Street estimates but it was also the lowest level of job growth in a decade.
Today’s Chart of the Day highlights the strong correlation between ADP and BLS data. The r-squared in the graph is .7558, meaning the correlation between ADP and the BLS data is statistically significant. Based on the regression line of data going back to 2002, we should expect payrolls to climb by a net of 34,000 jobs. We also regressed the data on a 3 month rolling basis which proved more statistically significant (r-squared = .86). The expected payrolls number based on that analysis is 113,000 jobs.
The consensus, as shown in the table below, is for a gain of 180,000 net new jobs. If either of our statistical estimates is in the ballpark, today’s data will likely further fuel the growing market mindset that the Fed will ease rates in the next few months.
CLICK TO ENLARGE
June 6, 2019
As we updated yesterday, the ADP employment report registered a much lower than expected increase of 27,000 jobs. As shown below, this was the lowest number of monthly jobs added per the ADP Report since the last recession. CLICK TO ENLARGE
Wednesday’s release of the Fed Beige Book, a Fed report detailing economic activity in each Fed district, mentioned the word tariff 37 times, up from 19 in April and 18 in March. This report will only further the Fed’s concerns that trade will put a damper on economic growth. If anything, it provides the Fed more ammo to lower rates.
The following quote is from Lakshman Achuthan, Economic Cycle Research Institute
“The received wisdom is mistaken on how recessions are made. They are not simply caused by shocks. They are caused by a window of vulnerability in the economic cycle where the cyclical drivers of the economy have weakened to the point where it’s susceptible to a negative shock. Within that window of vulnerability, virtually any reasonable shock becomes a recessionary shock. That’s how you get a recession.”
The quote above sums up the economic situation so well. The current economic expansion is vulnerable due to slowing global growth and the lack of stimulus that boosted economic activity over the prior two years. As Lakshman says the “window of vulnerability” is open. A negative shock could be related to the trade war, a stock market decline, Iran hostilities, BREXIT, or possibly something not on our radar at the moment. The bottom line is a recession is not guaranteed but the odds of having one in the next six months to one year is certainly higher than its been in a few years.
June 5, 2019
UPDATE: The ADP Employment Report came in at a lowly +27,000 jobs versus expectations of +175,000 increase. If the Friday BLS employment report is similar, the Fed is much more likely to reduce rates as early as late July.
Fed Chair Powell spoke yesterday morning and seemed to further confirm Bullard’s dovish statements from the prior day. The following headlines caught our attention: POWELL SAYS FED WILL `ACT AS APPROPRIATE’ TO SUSTAIN EXPANSION and POWELL SAYS ‘DOT-PLOT’ OF FED RATE FORECASTS HAS DISTRACTED ATTENTION FROM HOW FED WILL REACT TO UNEXPECTED EVENTS. Basically Powell is saying to ignore Fed forecasts for no rate hikes this year as they will lower rates if needed.
More interesting to us was the following quote from Powell: “Using monetary policy to push sufficiently hard on labor markets to lift inflation could pose risks of destabilizing excesses in financial markets or elsewhere.” Powell clearly is concerned that longer term bond yields would rise with central bank induced inflation and could cause harm to the financial markets. In particular he is probably most concerned about the corporate bond market.
Vice Chair Richard Clarida also chimed in yesterday with the following: IN PAST EPISODES IN THE 1990S WE DID HAVE INSURANCE CUTS. Basically he is setting the stage for proactive rate cuts. Clarida is providing us with further confirmation that the Fed could cut rates within the next few months.
The stock market interpreted the comments as “we have your back” and rallied over 2%. In prior days we mentioned the market was oversold and technically due for a bounce. Is this the short term bounce we were looking for or will the Fed’s support help the market retake all-time highs?
This morning ADP will release their employment report at 8:15. Expectation is for a 175,000 increase as compared to 275,000 last month . We will have more on Friday’s employment report tomorrow.
June 4, 2019
St. Louis Fed President James Bullard gave us reason to suspect that the Fed is coming around to the market view that rate cuts are not that far off. The following headlines hit the wires yesterday: RATE CUT MAY BE WARRANTED SOON TO LIFT INFLATION and MARKETS TELLING FED CURRENT RATES ARE TOO HIGH. With this trial balloon released by the Bullard and the Fed, the idea of rate cuts as early as July 31st, does not seem too far flung anymore.
PMI was revised lower yesterday from 50.6 to 50.5, the lowest level since September 2009. The Institute of Supply Management (ISM) Survey confirmed the weak PMI, coming in yesterday at 52.1 which is below consensus (53.0) and the prior month level (52.8). While PMI and ISM remain above 50, signaling economic expansion, any further decline could likely tip the indexes into economic contraction readings. On Wednesday both organizations will release their non-manufacturing (services) version of the index.
Here are some survey answers from ISM that confirm our concerns that trade talks and tariffs are affecting the actions of manufacturing executives:
“Ongoing tariffs [issue is] impacting costs and influencing supplier realignment on country of origin. Border issue is causing delays in imports from Mexico.” (Computer & Electronic Products)
“The threat of additional tariffs has forced a change in our supply chain strategy; we are shifting business from China to Mexico, which will not increase the number of U.S. jobs.” (Chemical Products)
“Newly increased tariffs on Chinese imports pose an issue on a number of chemicals and materials that are solely produced in China. We are expecting increases in raw materials starting June 1.” (Plastics & Rubber Products)
It is worth noting the following countries have PMI readings below 50: South Korea, Japan, Taiwan, Malaysia, Russia, Poland, Turkey, Czech Republic, Italy, Germany, and The UK. China stands just above 50 at 50.2.
June 3, 2019
We learned this past weekend that Steven Mnuchin convened a meeting of the Financial Stability Oversight Council to discuss the surge in corporate borrowing and the economic and market risks it now poses. Fed Chair Jerome Powell attended the meeting.
Today’s Chart of the Day shows the 3-month/10-year U.S Treasury yield curve. This curve is inverting in part due to longer term yields falling as they reflect increased chances of economic slowdown. While this occurs, the very short end of the maturity spectrum is static as yields are heavily dependent on the Fed Funds rate. Currently, expectations for a rate cut by the Federal Reserve in the next three months is low. When the market starts implying Fed rate cuts in the next three months, the 3m/10yr curve will flatten and then turn positive. Once this occurs the odds for a recession increase sharply.
May 31, 2019
In a surprising move last night, Donald Trump slapped Mexico with a 5 percent tariff on all goods and set in place a schedule to ratchet it up to 25% over the next four months. The new tariffs are not in retaliation for trade, but a punishment designed to get Mexico to halt illegal immigration into the U.S. The S&P 500 fell 25-30 points on the news and remains near the lows this morning. The dollar index is relatively flat, but the Mexican peso is down 3 percent versus the dollar, and bond yields have declined 5-6 percent.
Mexico is the United States third largest trade partner not far behind China and Canada. To put further context on the amount of trade between the U.S. and Mexico, the combined trade of Japan, Germany, and South Korea with the U.S. is less than that with Mexico.
Corporate Profits, reported by the BEA yesterday, fell from +11.2 percent annual growth in the fourth quarter to 1.6 percent annual growth in the first quarter. As we have seen with earnings being reported from individual companies, the growth benefits of the tax reform bill have largely run their course. Profits will remain higher due to lower taxes, but we will no longer see profit growth due to the bill.
Also of concern yesterday, wholesale and retail inventories both increased above levels expected by economists. While the numbers will boost the second quarter GDP number, they are additive to already bloated inventories from the first quarter and provide another signal that business and consumer spending have slowed. At some point soon corporations will run down inventories and reverse the benefits to GDP we saw in Q1 and may see to a lesser degree in Q2.
Chicago PMI will be released today at 9:45. Last month it fell sharply but consensus forecasts have it rising a point from last month’s 52.6. Again, we are looking for confirmation of the national PMI report that the breakdown in trade talks is starting to affect the purchasing behaviors of large manufacturers. While not expected in today’s report, a reading under 50 points to economic contraction and could spook the stock market and boost the bond markets even more.
May 30, 2019
Yesterday the S&P 500 traded below key support (2800-2809) and the 200 day moving average (2776). A late day rally pushed it slightly above the 200 day moving average. For our latest technical analysis, read- Quick Take: Market Update 5/30/2019.
Making this recent market decline hard to decipher is that there does not appear to be an obvious reason for it. Yes, economic growth has been weaker than expected and trade talks with China are not going well, but those factors have been known since early May. The fact that bond yields have declined steadily through May lead us to believe the equity market is coming to grips with slowing economic growth. Over the last week, a few leading bank economists have downgraded their second quarter GDP forecast to the 0.7-1.5 percent range.
What Are Implied Fed Funds?
On numerous occasions, we have mentioned the importance of following the implied future Fed Funds Rate. We thought it might be helpful to explain better what this rate is.
The Fed Funds rate, set and managed by the Fed (known as the effective rate), has hovered around 2.40 percent since it was raised last December. Fed Funds futures (aka implied rate) trade on the Chicago Mercantile Exchange (CME). Its contract prices represent the respective rate that traders collectively believe Fed Funds will average for specific months in the future. For example, the October 2019 contract implies that the Fed Funds effective rate will average 2.21 percent for the month of October. Given the current Fed effective rate is 2.40, the market is implying a .19 percent rate cut (2.40-2.21) or a 76% (19/25) chance of a standard .25 percent rate cut by October.
When Fed and market expectations diverge widely a bout of volatility in the fixed income and equity markets should be expected as expectations for one or both parties tend to change rapidly. Currently, the Fed expects to keep rates steady for the remainder of the year, while the market thinks the Fed will cut by over .50% by next April. The graph below charts the divergence. CLICK TO ENLARGE
May 29, 2019
The market is trading weaker overnight following a sharp 20 point decline yesterday afternoon. Of concern, from a technical perspective, is that the S&P is currently trading at 2790, below 2800, a key line of support. We are watching for a close below the 200 day moving average which is currently at 2776. A sustained breach below 2800 and 2776 favors a return to the low 2600’s, which served as support in late October and November of 2018.
Yesterday, the Dallas Fed Manufacturing Survey came in at -5.3 versus last month’s reading of 2.0 and a consensus forecast of 6.0. The expectations component led the survey into negative territory. This latest manufacturing survey affirms the weakness we discussed in the PMI report last week. Conversely, Consumer Confidence surged from 129.2 to 134.1. Consumers will ultimately pay the price for tariffs but it will take time for them to work through the economy and affect them. As such, strong levels of confidence, especially given stocks are near their all-time highs, is not surprising.
Last Thursday the PMI report pointed to weakness in the manufacturing sector, most likely the result of the breakdown in China-US trade talks. PMI is one of a handful of surveys that provide economists early clues of economic acceleration or deceleration. Most hard data takes 2 to 3 months or even longer in some cases to get reported, so these timely surveys are important to follow. This week we will look to see if other surveys are consistent with PMI. Conversely, we might find out that the report was an outlier.
Today at 10:30 the Dallas Fed Manufacturing Survey will be released. On Wednesday The Richmond Fed will release their Manufacturing Survey and on Friday the Chicago PMI Survey will be released.
The Atlanta Fed’s GDPNow forecast stands at 1.3 percent growth for the second quarter. This is inline with recent forecasts by the banks which are currently forecasting growth in a 1 to 1.75 percent range.
May 24, 2019
The market fell yesterday on concerns that the Fed minutes appeared to push back on the idea that rate cuts were coming in the next six months. Despite the seemingly hawkish stance of the Fed, Fed Funds futures contracts rallied and now imply a 95 percent chance of two rate cuts by January 2020.
Further harming investor sentiment are growing concerns over the trade war with China. In particular China’s General Secretary Xi Jinping ruled out the possibility of meeting with Trump at the coming G20 meeting.
Yields continue to fall with the 10-year Treasury bond reaching 2.31 percent, down nearly a full percent from the highs attained just last November. Crude oil fell by 5 percent on higher than expected supplies and is now 12% lower in just the last month.
PMI, released yesterday, provided our first look at how the US-China trade talks are affecting managers in the manufacturing and services industries. The composite level fell to 50.9 from 52.8. While still pointing to expansion of the economy, the composite is close to falling below 50 which would signal economic contraction. Here are a few sobering comments from Econoday:
Key here is outright contraction, that is a sub-50 reading, for new orders. This is an unwelcome first since August 2009 and the last recession.
Growth in orders slowed as did hiring for this sample.
Overall confidence is now at a 7-year low with overall job growth at a 2-year low. The composite index, at 50.9, is at a 3-year low.
Have a great Memorial Day weekend!!
May 23, 2019
The Fed minutes (released yesterday) from their May 1, 2019 policy painted a more hawkish picture than we anticipated. In particular, the following statement about equity and debt markets seemed to come out of left field: “(Fed members) judged asset valuation pressures in equity and corporate debt markets to have increased significantly this year.” Yes valuations have risen sharply as the equity market surged in 2019, but valuations just rebounded back to the same levels they have been at for the better part of the last two years. We are not sure what has changed in the way they assess valuations, but regardless, if the Fed truly believes valuations are high they are less likely to lower rates as doing so could further richen valuations.
The Fed also warned about the buildup of corporate debt and said the situation could amplify any financial market shocks. Like with excessive valuations, debt has been at record levels for a while, so it’s interesting to see that corporate debt has now become a topic du jour for the Fed.
In regards to inflation, the Fed said the recent dip in inflation is transitory and went on to list the same inflation gauges we discussed in Inflation: The Fed’s False Flag. If in fact the recent spate of slightly lower inflation readings are transitory, the Fed is less likely to lower rates. That said, they seem to be increasingly focused on inflation expectations and not inflation per se. To wit: “inflation expectations could become anchored at levels below those consistent with the committee’s symmetric 2 percent objective.”
We are a little surprised the Fed took a more hawkish than expected tone, and equally surprised the stock market did not immediately fret about the Fed’s messages. The market is opening decently lower this morning so maybe it took a while for investors to fully digest the Fed’s mixed messages.
Essentially, the Fed is in a wait and see mode. Interest rate cuts, if any, appear to have been pushed out further on the horizon.
May 22, 2019
The Fed minutes from their May 1, 2019 policy meeting will be released at 2pm today. While they are called minutes, they are not minutes in the traditional sense. The transcripts are frequently updated and modified to further stress topics of interest that the market may not have appreciated three weeks prior when the Fed put out their original statement. We will be on the lookout for more signs the Fed is uncomfortable that inflation is not high enough.
The shares of J.C. Penney, Kohls, and Nordstrom were down 7, 12, and 10 percent respectively yesterday on poor earnings and revenues. Given the weakness in retail sales and personal consumption along with higher credit card rates and rising oil prices we are not surprised by their poor performance. Target will release earnings this morning.
Equities are trading slightly weaker this morning on concerns that Trump will expand the list of Chinese technology companies that U.S. companies are restricted from doing business with. Clearly another sign that trade talks are not progressing well.
May 21, 2019
Small Cap and Mid Cap stocks have underperformed large cap stocks throughout the 20% post-Christmas surge. Please see Today’s Chart of the Day for a performance comparison of small-caps to large caps. We believe the unusual underperformance of small caps in a rising market is possibly due to two factors. 1- Large caps are heavily buying back stock and supporting their share prices while small caps are much less likely to be doing so. 2- Small cap earnings are more susceptible to weaker economic growth and investors are starting to rotate towards stable large caps in anticipation of slower growth. The first case is supported with data showing that buybacks for 2019 are already on pace for a record setting year. The second case is backed by bond yields which have steadily declined despite the stock market rising.
Last night Jerome Powell said the Fed is closely watching the sharp increase in corporate debt outstanding but thus far they do not view the situation as a threat similar to subprime in 2008. Corporate debt to GDP currently stands at a record high. Further over 40% of the debt is rated BBB and only one notch away from being downgraded to junk. We will have more on this topic tomorrow in a Real Investment Advice article entitled The Corporate Maginot Line.
Per Yahoo Finance: Powell said one key difference between 2008 and now is that the increase in business borrowing is not being fueled by a dramatic asset price bubble like the housing bubble of the past decade. – We counter by saying the dramatic rise in business borrowing is fueling a stock bubble. A large amount of money borrowed has been used to buy back stocks and was not invested into R&D, employee development, or other investments that could generate future earnings growth and support the debt balances.
The Fed will never publicly acknowledge a financial problem for fear of fueling it. Beyond that, we also question whether they know a problem is truly brewing in the corporate debt markets. This denial has a familiar tone to the words spoken by members of the Fed in 2005-2008. To wit: “All that said, given the fundamental factors in place that should support the demand for housing, we believe the effect of the troubles in the subprime sector on the broader housing market will likely be limited, and we do not expect significant spillovers from the subprime market to the rest of the economy or to the financial system.” – Ben Bernanke May 2007
May 20, 2019
The economic calendar is light this week. Of interest, Vice Fed Chair Clarida will speak at 1pm today and Chair Jerome Powell at 7pm. We will be on the lookout for further discussions on inflation from the two Fed leaders.
The Fed has publicly ramped up talk in recent speeches about their desire to see more inflation. As we noted in Inflation: The Fed’s False Flag, inflation and inflation expectations have been range bound for the past few years. On Friday, the University of Michigan Consumer Sentiment Survey provided further evidence. Per Reuters: “The survey showed consumers expecting higherinflation over the next 12 months and five years. The survey’s five-year inflation expectations measure rose to 2.6% early this month from 2.3% in April.”
It is becoming more clear by the day that the Fed is looking for excuses to lower rates and inflation appears to be that reason.
The following Tweet by Donald Trump and headlines appearing this past weekend further stress increasing tensions between the US and Iran.
Tweet Donald Trump- If Iran wants to fight, that will be the official end of Iran. Never threaten the United States again!
Iraqi Parliament To Vote On Bill That Would Ban US Military Troops From Iraq
Exxon Mobil Employees Begin Evacuating an Iraqi Oil Field Amid U.S.-Iran Tensions
U.S. Orders Partial Evacuation of Embassy in Baghdad
*AL-JUBEIR: SAUDI WILL RESPOND WITH STRENGTH IF IRAN CHOOSES WAR
In a sign that these headlines have some validity, Crude oil continues to creep higher, despite a stronger US dollar. These actions and rhetoric might be posturing for renewed Iran nuclear weapon discussions, or they possibly are linked to US-China trade talks. Iran is a crucial link on the One Belt One Road (OBOR) Chinese initiative. Given the importance of oil in just about every aspect of the US economy, we advise paying close attention to the headlines coming out of the middle east and importantly the price of oil.
The map below shows the proposed route of OBOR and the important role that Iran plays in completing the path to make Chinese trade with Europe much cheaper and easier. Click to Enlarge
May 17, 2019
Stocks traded lower all night as it appears trade discussions are on the rocks again. As investors, it is important not to get caught up in the tweets and constant posturing between China and the US. There is little doubt that the stock market will remain volatile with large up swings, have we saw the last few days, and large declines as we saw in prior days.
Markets typically “price in” or “price out” certain future events. For instance, since January the market has “priced in” a high likelihood of a trade deal with China. As we have seen over the last two weeks, the risk with having such surety is that if the deal were to fall apart, 2019 gains could largely be erased. Said differently, risk/reward is skewed against investors.
While the trade negotiations have certainly driven the market, expectations for Fed rate cuts have co-piloted the assent higher. The table below shows market implied expectations for the Fed Funds rate through January of 2020. Currently, the market is assigning a 32.6 percent chance of a rate cut by the end of July and is close to 100 percent certain of a cut by late January 2020. Like the China trade deal, we should be asking if those odds are reasonable and, if not, is the market pricing in too much or not enough. Frequently, large gains or losses come when what a market has priced in or out changes drastically.
May 16, 2019
Retail Sales for April declined by -0.2 percent versus expectations for a +0.2% increase. The less volatile sales data excluding food and energy also fell by -0.2 percent versus expectations of a +0.4 percent increase. On a two month basis, including last month’s 1.7 percent increase, retail sales appear strong. However, if we exclude March’s strong increase, Retail Sales have been flat or negative in four of the last five months.
With yesterday’s weak Retail Sales and Industrial Production data (-0.5 pct. vs +0.1 pct expectations), the Atlanta Fed’s GDPNow forecast for the second quarter GDP fell from 1.6% to 1.1%.
Yesterday, we mentioned that the Empire State Manufacturing Survey might provide an early glimpse of how manufacturers are reacting to new tariffs. We may have to wait another month as the bulk of the survey was completed before the new tariffs were levied. As explained by Econoday: “The 10th of this month was when additional tariffs were levied against $200 billion of Chinese imports and the 10th of this month was the date that the bulk of the month’s sample was completed though the sample remained open early this week.” The report was stronger than expected at 17.8 versus expectations of 9.0.
May 15, 2019
Retail Sales for April will be released at 8:30 this morning. Current expectations are for an increase of 0.2 percent and 0.4 excluding gas and automobiles. Of particular interest to us today will be the Empire State Manufacturing Survey. May’s report may provide us the first indication of how the manufacturing sector is responding to tariff hikes on China. Expectations are for a slight 1.0 point decline from last month’s level.
Renewed optimism over increased prospects of a trade deal helped the market recover about a third of Monday’s losses. The “Art of the Deal” and its associated maneuvers will no doubt create a lot of market volatility until a deal can be agreed upon or the process hits a dead end. We expect the market to key off of Trump’s tweets which are mainly optimistic, but also his actions which have not boded as well for a deal. We have taken portfolio measures to slightly reduce risk. The potential downside of a no-deal is more substantial in our opinion than the upside of a deal. These actions and possibly others to come are detailed in the Dashboard-Portfolio Alerts as well as in the Portfolio section.
In today’s Chart of the Day we annotated a chart of S&P 500 activity for May. The graph shows a repetitive behavior in which the market moves higher for a day or two and then gaps lower on the following open. This odd behavior signals a market in which buyers stand at the ready to buy the dip (BTD). Thus far the BTD trade has not worked out well. At some point dip buyers will either be right and be generously rewarded or they will learn their lesson and start backing away from the trade. If the latter is the case, the market decline could pick up speed as fewer buyers will cushion market declines.
May 14, 2019
The US/China trade war heated up on Monday as China retaliated with not only tariffs but the threat to sell their holdings of US Treasury bonds. It is a growing possibility that this latest volley could lead to a currency war. Since May, the Chinese Yuan has been devalued by 2 percent versus the US dollar. We believe the US might take action to weaken the dollar, thus not allowing China to gain any advantage by weakening their currency.
Below are the two major headlines floating around the market this morning. We remain cautious and weary of statements from the US and Chinese governments.
TRUMP SAYS TRADE DEAL WILL HAPPEN ‘MUCH FASTER THAN PEOPLE THINK’
US officials say a China trade deal isn’t close – Axios
UBER, the latest multi-billion dollar IPO was issued on Friday at a price of 45 per share. Typically new IPO’s of “hot” companies immediately trade to a double digit percent premium of its offering price. UBER, has done the opposite, falling on its first trading day and again yesterday. On Monday it closed at 37.10, down 18 percent from its offering price. The IPO craze of 2019 might have just witnessed an abrupt ending. While not a positive sign for the market in general, we must be patient and wait for the trade war headlines to simmer down before reading more into what the IPO market may be telling us.
Gold has had a strong correlation with the Chinese Yuan. We were concerned that a breakdown of negotiations would lead to a weaker Yuan and thus a lower gold price. Today’s Chart of the Day provides us hope that the relationship might be disengaging, meaning gold could strengthen despite a weaker yuan.
May 13, 2019
Update: That didn’t take long. The following headline was just released- CHINA SAYS TO RAISE TARIFFS ON 2493 U.S. GOODS TO 25%. S&P futures are now down 50 points.
Friday’s gain and then some were erased as the markets reopened last night. Currently S&P futures are down about 40 points. Trump’s threats of new tariffs coupled with warnings to China to not retaliate with tariffs are scaring global investors as the threat of a prolonged trade war increased.
Trade talks with China now enter what could become a longer and more volatile period. Trump will likely continue to pressure China with tariffs. Barring a steep market decline or sharp weakening of economic sentiment we believe he will be able to get away with such measures. China, can obviously retaliate with tariffs but it might be more effective to devalue their currency to help partially offset tariffs. Last night their currency, the Yuan, fell 1% against the dollar. China may also decide to use targeted tariffs on specific products or even companies. As we saw to a small degree a year ago, such actions would largely affect those that companies and laborers that work in areas that voted heavily for Trump in the last election.
On the data front, we look forward to Wednesday’s retail sales report for clues about how the consumer is holding up. Current expectations are for an increase of 0.3 percent. Weak auto sales will have a big effect on this number, so extra attention will be paid to the core (ex. autos) data.
May 10, 2019
This morning the market may have hit peak absurdity this morning because just hours after another round of US tariffs against China went into effect as some $200BN of Chinese imports saw tariffs hiked to 25% and Beijing vowed it would strike back, world stocks and US equity are only down slightly as the official narrative goes according to Reuters, “investors held out hopes for a trade deal between the United States and China” even as, as noted above, another round of U.S. tariffs on Chinese goods took effect.
Yesterday, it was this same holding out of “hope” that allowed the market to successfully test, and held, the 50-dma. Today, it will look to retest that level again at the open. It will be important the market holds support through the end of the day today. With the markets getting short-term oversold, there is an increasing probability of a rally next week so trading positions can be added.
Trump tweeted out this morning that:
“Tariffs will make our country much stronger.”
This is economically wrong and the surge in bankruptcies of American farmers should tell him that. The administration continues to chase a very dangerous policy which will likely spur the next recession sooner rather than later. (Be sure and read “Game Of Thrones” this weekend when I publish the newsletter.)
However, as we head into summer, the risk is to the downside for a more substantial correction as both earnings and economic growth continues to show weakness. While the long-term bull market trend remains intact currently, it is coming under attack and is at risk of losing ground as we head into 2020.
Portfolios should remain long-biased equities, but over the next several months it is going to be a traders market so positions will need to continue to hold tight stops and a process of regular profit taking will be key.
For today, we are doing nothing. We will wait and see how the market handles todays action and if support holds. We will evaluate what actions we need to take over the weekend and will update you on Monday.
Have a great weekend, and call your Mom.
May 9, 2019
Despite Tweets from Trump and Press Secretary Sarah Sanders on the likelihood of a trade deal, the market failed to ignite yesterday as we have come to expect over the past few months. It’s quite possible a shift is occurring in the way that investors and algorithms react to China trade statements. Are investors and traders just being conservative given the Friday deadline or is there a regime shift in the market regarding trade? Answering this question is a key to positioning and risk taking over the coming days and weeks.
Please see today’s Chart of the Day for more evidence that selling, thus far, has been driven by equity futures and VIX traders, and not traditional cash investors. Our concern is that said futures selling, if it continues, might cause cash investors like mom ‘n pop and larger institutional investors to get nervous and start selling, leading to a sharper slide akin to Q1 and Q4 of 2018.
PPI will be released this morning and CPI tomorrow morning. Given the Fed’s new found concern about inflation, these numbers will hold greater importance than normal. For more on the Fed and their use of inflation as a rationale to ease policy, read our latest Inflation: The Fed’s False Flag.
May 8, 2019
On Monday morning, with the S&P 500 down 50 points, gold and bonds were slightly higher but not as much as we expected given the bad trade news. By the end of the day gold was down slightly and bonds mustered a minor gain. Yesterday the equity market fell 1.65 percent and gold and bonds finished higher but again not by as much as we would have expected.
The lack of buying in traditional safe haven securities signals to us that the recent decline might be relatively shallow and short term in nature. If gold and bonds start performing better we will be more inclined to believe the market has further to correct.
With the VIX closing at 20.35, the surge over the last two days was the fourth largest two-day advance in volatility since 2016. It is only exceeded by two dates in February of 2018 and one in October of 2018. Please look at the Chart of the Day from April 15th showing how net exposure to VIX futures was near a record short amount. Since we posted the graph it broke the record. This equity decline is in part being fueled by traders covering VIX shorts. This was evidenced by VIX futures volume which was far and away the highest since the decline in Q1 2018. This again leads us to the conclusion, at this point, that the decline is temporary. All bets are off, however, if a trade deal falls apart by Friday’s deadline.
May 7, 2019
On Monday the stock market spent most the day rallying back from deep overnight losses and closed with moderate losses (S&P -13). Shortly after the close, however, US Trade Representative Lighthizer, affirmed new tariffs which sent the market lower. Currently S&P futures are down 17 points.
Yesterday it was made obvious that the buy the dip/FOMO mentality trumps any properly constructed risk/reward type analysis. While we think a deal is likely, we also think a deal has largely been priced into the market. As such, the potential upside from a deal is limited while the downside of no deal, new tariffs, and other trade actions are large.
This will be a light week from an economic data perspective. At 10am the JOLTS report of labor turnover will be released. PPI and CPI are scheduled to be released on Thursday and Friday respectively. A few Fed members will be on the speaking circuit this week headlined by Jerome Powell on Thursday morning.
May 6, 2019
With Friday’s deadline for a China-US trade agreement, Trump raised the stakes threatening China with additional tariffs if a deal is not consummated. S&P 500 futures are trading about 50 points lower, however gold and bonds, typically sectors that investors flock to for safety, are not showing similar levels of concern. It is likely investors in those markets think this is a tactic designed to better the deal for the US.
We suspect this week will be filled with volatility, both up and down, as trade talks take center stage. The Chinese trade delegation is still planning on meeting with US representatives later this week, providing hope this incident is simply “the art of the deal” and not the death of a deal. While we remain optimistic that a trade deal will be completed, we remain cognizant of the all of the market surges over the last few months on rumors of a deal. Any failure to complete a deal could be very problematic for stock prices in the short run.
New York Fed President Williams released a paper on Friday which primarily focused on inflation running below its target. He clearly argues for lower interest rates to combat this “problem.” We have an article coming out on Wednesday which addresses inflation and how we believe it is being used as a “false flag” to justify future rate cuts.
The headline employment data was strong, however the breadth of the report had a lot to be desired. For instance the household survey reported a decline in jobs for the second month in a row. Hours worked, wages and the labor participation rate were also weaker than expected.
Lost in the flurry of economic data last Friday was the inventories report. Retail inventories fell 0.3 percent while wholesale inventories were flat versus expectations for a 0.3 percent increase. If you recall, first quarter GDP was strong in large part due to a build in inventories. As we discussed in our Quick Take: GDP a likely reduction in inventories, as we just got a whiff of, along with the sharp increase in Q1 oil prices will stunt 2Q GDP growth.
May 3, 2019
UPDATE: The employment report was strong showing a gain of 263k jobs. The unemployment rate fell to 3.6 percent however the decline was largely due to people leaving the workforce. This is evidenced by the participation rate which fell to 62.8 percent. Bottom line- a strong report that will make it hard for the Fed to lower rates.
The table below, courtesy of Econoday, shows expectations for the BLS employment report due at 8:30am.
U.S. auto sales continue to show weakness, falling 6.1 percent, to 16.4 million units a year. That is the lowest annualized sales rate since 2014.
Copper is referred to in the markets as Dr. Copper due to its ability to assess global economic activity. Because of its widespread use in industrial production and electronics its price is closely followed as a barometer of supply and demand. Since mid-April the price of copper futures has declined about 10 percent with more than half of that occurring over the last two days. Might the doctor being trying to warn us?
After a self-imposed media blackout, Fed representatives will begin public speeches today. Of interest to us will be Vice-Chair Richard Clarida. He has recently highlighted concern about inflation not reaching the Fed’s 2 percent inflation target. If he pushes back on Powell’s comments about weak inflation being “transitory” we might see risk assets recover some of the post-FOMC decline.
Yesterday afternoon we released Part 2 of our Value Your Wealth series. Click the link below to read the article.
May 2, 2019
The market fell sharply and the dollar rallied after Chairman Powell’s press conference. It appears investors wanted to hear a more dovish tilt than Powell provided. In particular they focused on his use of the word “transitory” to describe a recent spate of weaker inflation. It appears they were hoping Powell would think that inflation running below the 2 percent goal was troublesome. Instead he characterized it as temporary. We will focus on the next round of Fed speakers to see if the Fed is in unison with Powell, or if Powell is a lone wolf and the other members are more dovish and concerned about inflation.
Our expectations for the Fed’s policy statement turned out to be spot on. There were two material changes. They downgraded their characterization of inflation trends and cut the IOER rate by 0.05 to 2.35 percent. There was no perceivable change in the Fed’s neutral policy stance. The 5 basis point reduction to the IOER further incentivizes banks to lend to other banks. This should cause the effective Fed Funds rate to decline slightly going forward. If, however, the rate continues to rise it signals the increasing probability of a liquidity issue in the banking sector. We will follow this situation closely.
With a third of the quarter in hand, the Atlanta Fed (GDP Now) published their first estimate of second quarter GDP. Currently they are forecasting an increase of 1.2%, well below the market consensus of 2.5%. It is still early in the quarter so do not read too much into either forecast.
A good proxy for Friday’s employment, the ADP Survey, reported that 275k jobs were added in April, well above expectations of a 180k increase. Currently, expectations for the Friday employment report are for an increase of 180k with a range of 160k to 240k.
May 1, 2019
At 2pm the Federal Reserve will update their current policy thoughts via the FOMC statement and Jerome Powell press conference. We expect to see few changes in regards to the broad language the Fed uses to describe the economic environment, although we suspect they may reduce their outlook for inflation.
Essentially the Fed is on hold, and at this point, very likely not committing to raise or lower rates. More interestingly we will be on the lookout for any changes to the schedule for winding down QT (reducing their QE asset purchases) or changes to the IOER rate paid to banks. For more on this read Warning 3 in our most recent Technically Speaking: A Warning About Chasing This Bull Market.
“It is quite possible this situation will cause the Fed to stop QT before the scheduled September 30th end date. More importantly, it also raises the specter that QE, which injects liquidity into the banking system, is not as far off as we think. Watch the IOER/Fed Funds rate differential and the dollar for clues of further liquidity problems.”
On Tuesday President Trump was once again trying to persuade the Fed to lower rates. Per CNBC: Trump calls on Fed to cut rates by 1 percent and urges more quantitative easing. As we have discussed the odds of Trump firing Powell are not zero as the market seems to believe and the consequences of such an action across all asset classes are immense.
April 30, 2019
Chinese manufacturing and non-manufacturing PMI surveys were both weaker than expected leading to questions on just how much China is willing to increase credit to boost growth. China represents over 30 percent of global GDP growth so stay tuned.
Google shares are currently trading down 8 percent on weaker than expected earnings, revenues and other financial and user metrics. Of particular interest from a broader economic perspective is a six percent decline in Google’s advertising revenue. Advertising spend and economic activity have a long and well established positive correlation. Simply advertisers spend more when the economy is growing dependably and consumers are more likely to respond positively to advertisements and vice versa when economic confidence fades. The sharp decline in advertising revenue from one of the largest media companies, follows on the heels of Q1 GDP which pointed to weakness in the consumer sector.
For more on Friday’s GDP report we published a Quick Take yesterday afternoon. Click the image below to read the article.
Yesterday the BEA released personal income and consumer spending data for March. Despite a strong jobs market, punctuated by record low jobless claims, personal incomes only rose 0.1 percent versus an expected increase of 0.4 percent. Despite weak income growth, consumer spending beat estimates by 0.2 percent, increasing 0.9 percent. It is likely this boost in spending was not discretionary, but due to the sharp rise in oil prices over the last quarter.
The combination of BEA data points provides a clue that while consumer spending has been weak, what marginal spending has occurred is increasingly coming on the back of credit usage. To support this we checked out the Fed’s weekly report on credit card and other revolving debt. This figure is running 4.3 percent higher than last year while wage growth is approximately 2.5 percent higher. Such increases in credit usage growth above wage growth are not sustainable over longer time periods.
April 29, 2019
As we updated last Friday, GDP surprised to the upside with a 3.2 percent gain versus expectations of 2 percent. In this weekend’s newsletter – The Bull is Back… But Will it Stay?, we examine some of the drivers of first quarter growth to see how sustainable the quarterly boost in economic growth is. Later today we will add to the research with a Quick Take examining fuel prices and the role it played in boosting “reported” economic growth.
There are two big events on the calendar this week. On Wednesday, the Fed reports on the status of monetary policy via the FOMC Statement and a Jerome Powell led press conference. We expect a very similar statement as was released from the meeting that occurred six weeks ago. The strong GDP and employment data will make it difficult for the Fed to move to an easier posture. On Friday, the BLS will report on employment. We will provide market expectations for April’s labor report later in the week.
April 26, 2019
UPDATE: GDP beat all expectations coming at 3.2 percent. Despite the strong number, a look under the hood leaves a lot to be desired. The bulk of the gains were due to a surge in inventories and slower trade as imports fell. Consumer spending and business investment, historically accounting for over 70 percent of economic activity, slowed to a crawl.
This report leaves the Fed in a bind. It will be hard to take on the dovish stance that Trump is asking for. Last night Kudlow said the Fed was leaning towards a rate cut. Even if true, the odds of that are now greatly decreased.
Q1 GDP will be released at 8:30 this morning. Expectations are for a 1.60 percent increase, slightly lower than last quarter’s 2.00 percent growth rate. The long-run natural economic growth rate is currently around 2 percent. Barring additional fiscal and/or fresh monetary stimulus, this is the rate of growth that we should expect and use when modeling and evaluating investments over longer time frames.
Yesterday MMM fell nearly 13 percent due to poor earnings. We attribute their bad Q1 showing in part to weakening global economic growth and in part to U.S. dollar strength. Last night INTC also fell victim to both factors. INTC is currently expected to open down 8 percent. Today’s Chart of the Day shows the strong relationship between revenues of S&P 500 companies and the U.S. dollar. If the relationship holds we should expect S&P 500 revenues to be flat or even negative over the coming two to three quarters.
The graph below (CLICK TO ENLARGE) shows that dollar strength, from a technical perspective, can continue. The red arrows denote three potential resistance levels to keep an eye on. The green line is the ratio of the S&P 500 to the U.S. dollar. Note the lower highs in the ratio as compared to higher highs in the S&P.
April 25, 2019
The U.S. dollar index has consistently appreciated versus other major currencies over the past month and now sits at two year highs. A stronger dollar has negative implications for corporate earnings. For instance, this morning global conglomerate MMM posted poor earnings including earnings and revenue misses. More importantly, MMM, shows how large domestic companies are affected by the continuing global economic slowdown.
Global weakness was also highlighted last night when South Korea posted a surprising decline in economic growth. GDP fell by 0.3pct marking the first decline since 2008. This data point along with their large trade presence in Asia provides clues that China continues to suffer despite their recent spate of positive economic data.
As a net importing country, a strong dollar is deflationary as prices of foreign goods should decline in dollar terms. The negative is that those imported goods are more attractive and take away sales from domestic companies. The stronger dollar is also a negative for emerging markets which borrow a lot dollars. As the dollar rises the cost of paying interest and principal increase. Many an emerging market crisis started with a stronger dollar.
We would not be surprised if the administration were to begin talking down the dollar in coming weeks.
April 24, 2019
The April 18th Chart of the Day showed how the amount of IPO’s for 2019 has already reached prior peaks, which coincidentally are also the market tops of 2001 and 2008. We are beginning to see similar activity in corporate buyouts. Today PG&E is trading 25% higher on rumors that Berkshire Hathaway will acquire them. More interestingly, Chevron’s bid for Anadarko was bested by Occidental this morning. Occidental is offering the company an extra 10 billion over Chevron’s bid. Anadarko’s shares are now trading near 75 a share, up from 65 yesterday and 45 before Chevron made the initial bid.
The S&P 500 rose 26 points to an all-time high yesterday because __________. Fill in the blank, because honestly we do know the catalyst. It is clear that investors are willing to ignore a lot of economic data and other news as they are once again entrenched in a FOMO (fear of missing out) mentality. Investors are clearly encouraged by the Fed which loosened its stance on monetary policy. Once again the Fed flexed its muscles when the market stalled last year. The Fed Put is still alive!
Will higher stock prices and rising oil push the Fed toward a more hawkish stance?
April 23, 2019
The Chart of the Day shows the national average price for gasoline has risen 69 days in a row. The broad affects will be two fold. The rising price of gasoline, crude oil, distillates and everything made out of oil will be rising in price. At the same time consumers and corporations will divert more of their budgets towards these products, thus spending less on other goods and services. To put this into context, gasoline RBOB futures have risen 65 percent since Christmas. On average that accounts for approximately an extra 25 dollars each time we fill our vehicles up with gas.
As mentioned yesterday, rising inflationary pressures against slow growth is a tough spot for the Fed. They will need to be vigilant against inflation while at the same time wanting to help the economy with lower rates. Further, Donald Trump will likely push the Fed to lower rates even more aggressively than he has in the past.
The markets have been drifting sideways on incredibly light volume. We are not sure what will break this period of investor malaise but quite often periods of tight consolidation, as we have, are followed by a volatility surge upwards or downwards. Given how close the market is to all time highs this could get very interesting in the days and weeks ahead.
April 22, 2019
Crude oil is trading up 2pct this morning and over 65 dollars per barrel on news that Trump will not extend export waivers to the 8 countries that were currently allowed to import Iranian oil. Five of the eight, China, Japan, South Korea, China and India will need to stop importing oil from Iran or deal with actions from the U.S. The remaining 3 have already halted imports from Iran.
Given the positive progression of trade discussions with China we expect them to follow suit. The others are also likely to adhere to the limits. We noted last week the strong relationship of oil and inflation. This action should strengthen the price of oil and put the Fed on further alert for higher inflation. As such, it will be harder for the Fed to take a dovish stance and the battle with the White House will likely increase in intensity.
Today the Chicago Fed National Activity index will be published at 8:30 and existing home sales at 10:00. The big economic data point will come Friday with the release of Q1 GDP. Current expectations are for a 2.0 percent increase (2.2 percent last quarter). Corporate earnings will also continue this week with the bigger tech companies on deck. Click HERE for a link to the earnings calendar courtesy Yahoo Finance.
April 19, 2019
The futures markets were closed last night and the stock and bond markets will be closed today for Good Friday. Since there is little to report on the markets/economics front we thought we would share graphs in this commentary and in our Chart of the Day concerning value versus growth investment styles.
When markets are priced at large valuations and the economic cycle appears to be nearing an end, investors should look to overweight companies with strong fundamentals and avoid high flying growth companies that make little to no profit. Simply said, favor value over growth. We will have a lot more on the topic in coming articles, but the two graphs we present today serve as a nice introduction to the current market state of the value versus growth.
April 18, 2019
UPDATE: Retail sales were much stronger than expected (+1.6pct vs expectations of +0.8pct) but the gains came largely from gasoline sales and automobiles. We have warned about rising oil prices and we are now seeing them seep into economic data. Consumer spending represents nearly 70% of economic activity so proper analysis of this report is important. The question we will attempt to answer in the coming weeks and months is- does the March mark a trend of improving retail sales data to come or was it an anomaly to the recent 6 month trend. The following Tweet from David Rosenberg provides broader context to the report:
Strong March for retail sales but look at the entire first quarter. Down to +0.2% SAAR from 1% in Q4, 4.3% in Q3 and 6.1% in Q2. REAL sales in Q1 were -0.7% and followed -0.5% in Q4, first back to back contraction since the first half of 2009.
Over the last two weeks we have made mention of the extreme to which this market is overbought. You can track this condition on our Dashboard page with the Technical Measures Gauge on the right side. Yesterday, Sentiment Trader put out a chart that confirmed our measure as shown below. Bottom line- investors are more confident today than since 2010. The prior two peaks of this index preceded the drawdowns of Q1 and Q4 2018. Click to enlarge.
Despite what appears to be some degree of economic strengthening in China, data from Europe continues to languish. PMI surveys released last night point to a German recession on the horizon. PMI for the entire Eurozone is not as bad (still in expansionary territory) but it is closing in on the all-important 50 level. Last night it dropped to 51.3 down from 51.6. PMI has a high correlation with GDP. A reading in the low 50’s, as we have for the entire eurozone, corresponds with economic growth of .1 to .2 percent.
April 17, 2019
China surprised investors with a better than expected GDP of 6.4pct vs consensus of 6.3pct. We caution that Chinese economic data is very suspect and the .10pct “beat” is likely being manufactured by the Chinese government to help trade talks continue. The fact of the matter is that GDP consistently matches consensus to the penny and which has always led us to question their data. Such a perfect record is unheard of in other developed nations. Given the stronger than expected GDP number along with a host of other strong economic data should we expect China to clamp down on credit growth?
On the political front, the Mueller report is expected to be released tomorrow. We doubt that there will be market implications but we keep it on our radar just in case.
Earnings continue to be released. Last night NFLX matched expectations and its stock is trading slightly higher. IBM on the other hand disappointed on revenues and is trading down about 3percent. A lot of regional banks report earnings today along with PepsiCo, Textron, Alcoa, and Kinder Morgan.
The markets will be closed Friday for Good Friday.
April 16, 2019
Chinese GDP and other economic data will make the headlines tonight. Expectations that recent increases in liquidity should help revive economic growth which was struggling. GDP is expected to come in at 6.3 percent. Expectations for GDP and the actual GDP report are almost always identical. Anything below 6.3 percent would likely be seen as a tactic towards trade negotiation with the U.S. In general, the talks appear to progressing.
Thus far banking earnings are mixed. JPM’s earnings and revenues were better than expected. Yesterday, GS and Citi reported weaker than expected revenues, with GS stock falling over 3 percent yesterday on the news. Trading revenues for both banks were weaker further hampering revenue.
This morning Bank of America fell in line with GS and C as they beat expectations for earnings but missed on revenue. Helping earnings per share was a 7% decline in the number of shares outstanding. Given the flatness to inversions in various yield curves we expect that margins should continue to decline over the coming quarters for the banking sector.
April 15, 2019
As shown below, President Trump went after the Federal Reserve once again this weekend with pressure to ease monetary policy. This may seem like lip service and “gentle” persuasion to some. We believe that if the Fed resists the implications for Jerome Powell and Fed independence might be jeopardized. We will be writing more on this topic which is growing in importance over the coming weeks.
Goldman Sachs and Citigroup along with other financial companies announce their earnings today. Tomorrow topping the list is JNJ and NFLX. We will focus on the sales and earnings from companies versus expectations as we always do. This earnings season, however, we believe forward looking comments will hold more weight than normal as investors try to judge if the recent economic weakness is temporary or expected to be sustained for a longer period.
April 12, 2019
Despite the flattening yield curve, JPM reported better than expected earnings and revenues.
Chevron announced its intention to buy Anadarko for 65/share a premium of nearly 20% from yesterdays closing price.
China reported better than expected trade and credit creation data giving a boost to the equity markets.
What little of Powell’s speech to the Democrat Caucus being released, what little we have gotten is focused on Fed independence. This theme will likely become a bigger issue, especially if economic data or markets show weakness. CPI and PPI inflation data from earlier this week was slightly higher than expected but when food and energy are excluded, as the Fed prefers to do, the data do not point to increased inflationary pressure.
April 11, 2019
We expect to hear excerpts from Jerome Powell’s speech to the Democrats House Caucus meeting today or tomorrow. Speaking on behalf of the Fed today is Vice Chairman Clarida, and Governors Williams and Bullard.
The Fed minutes yesterday held few surprises. The tone was decidedly dovish but they are clearly not close to reducing interest rates as is being demanded by Trump, Kudlow and Stephen Moore. This battle between the Fed and the administration could heat up leading up to the next Fed meeting on May 1st.
At yesterday’s ECB meeting Chairman Mario Draghi essentially confirmed recent rumors that the ECB might buy stocks in the future. He was quoted as follows; “We’re ready to use all instruments. ALL instruments.”
Combine his quote with various quotes from Fed officials discussing using QE in the next crisis and we are left to ponder what do the central bankers know that we don’t. The obvious answer being that a recession is closer than the market thinks and because interest rates are already at or near historic lows globally, they have little in their traditional tool chest to combat a recession with.
April 10, 2019
Today will be chock full of action. The European Central Bank (ECB) met and decided to leave rates unchanged for the remainder of the year. CPI will be released at 8:30, Fed minutes from the last meeting will be released at 2:00, and Jerome Powell will speak at the House Democratic Caucus.
We will focus on the Fed minutes, which are edited/revised after the fact. There is a likelihood that their tone will turn slightly more dovish, possibly inferring a rate hike later this year. The Fed is in a fight for their independence and can use this opportunity to make it appear that Trump and Company are having little affect on policy.
JOLTS (Jobs Openings and Labor Turnover Survey) released yesterday for February saw a sharp decline in job growth and job openings. Expectations were for 7.565mm job openings, instead the BLS reported the number at 7.087mm. The difference between openings and hires, at 1.391 million, narrowed by more than 400,000, pointing to less of an imbalance between the supply and demand for labor. This report should ease concerns of building wage inflation especially if similar trends emerge in other labor data.
April 9, 2019
Crude oil continues to gain ground and is now trading near 65/barrel. Traders are concerned that increasing tensions with Iran and fighting in Libya will hurt supply. As we showed last week, higher oil prices have a big affect on inflation. Will the Fed begin to take notice?
Markets are drifting this morning as traders await the FOMC minutes as well as a speech from Jerome Powell on Wednesday. Given Trump’s recent rhetoric around lower rates and QE, the Fed may use these two events to assert their independence and take on a slightly more hawkish tone. It is possible such a tone might involve leaning towards one or two more rate hikes in the coming year or two.
Over the course of this week the number of companies that cannot buy back their own stock will rise sharply. The graph below charts the percentage of S&P 500 companies in a buyback blackout period through May. Click to enlarge.
April 8, 2019
With little economic data due for release this week the focus will largely be on the Fed. Jerome Powell speaks Wednesday, Thursday and Friday. Further the FOMC minutes from the last meeting will be released Wednesday afternoon.
Earnings season kicks off this week with JPM and WFC on Friday. We have entered the earnings blackout period which will preclude many companies from buying back their own shares.
The following hit the wires on Friday: Trump says “I personally think the Fed should drop rates” because they are slowing down the economy and instead of “quantitative tightening it should actually now be quantitative easing”
The question is why QE if we are not in a financial crisis. In our opinion, here is why:
The natural rate of economic growth is about 1.5 percent or even less. In the absence of fiscal/monetary stimulus that is the rate of longer term growth that we should expect. The rate of growth has been higher under Trump in large part due to one time stimuli such as hurricane/disaster spending, tax cuts, and larger deficits. Those growth sources have run their course and have largely stopped contributing to growth. With a house run by the Democrats it is unlikely new fiscal stimulus will replace them. As such the only tool at the President’s disposal to goose short term growth is monetary policy. Given the election in less than 2 years, we suspect Trump will push the Fed to lower rates, bring back QE, and possibly take other measures to spark temporary growth. We caution that while he may or may not be successful, such strategies are laden with longer term consequences. Most important is that such a low interest rate environment discourages investment into innovation and thus causes the regulator of economic growth, productivity growth, to further decline. To read more on this we share an article from January- Productivity: What it is and Why it matters
April 5, 2019
President Trump nominated Herman Cain to the Federal Reserve Board yesterday. Cain is known for his hard-money philosophy. Trump has clearly pushed the Fed for easier money policies and Moore is living up to it. While we hope Cain holds to his prior views, we suspect he will fall into the dovish camp shortly.
The BLS employment report takes center stage today. The table below shows last months data as well as consensus expectations for today’s report. Last months payrolls gain of only 20,000 jobs was considered a fluke, attributable largely to bad winter weather on the east coast. Consensus for this month has payrolls back to an average running rate gain of 170,000. We are inclined to side with the market and expect a range of 150-200k. However, we are concerned that another weak number may be signalling that slowing global growth and weakening domestic activity is having an effect on the labor market. Click the table to enlarge.
April 4, 2019
ADP, a good proxy for employment, grew by 129,00 jobs, a sharp decline from last month’s revised reading of 197,000. On Friday the BLS will release the official data. Current expectations are for an increase of 170,000 jobs and the unemployment rate unchanged at 3.8pct.
Crude oil, now trading near 62.50/barrel is up almost 40 pct year to date. While relatively fairly priced as compared to its price over the last few years, it is moving higher quickly. Annual changes in crude oil and inflation are well correlated as shown by the graph below. If crude continues to rise, inflation prospects will increase and put the Fed in a bind. Such inflationary pressure along with the possibility for increased wage inflation flies in the face of the Fed’s rate pause. If an inflationary impulse were to materialize it could force the Fed to hike or even discuss rate hikes at the same time the economy is weakening and the President is “demanding” immediate rate cuts.
April 3, 2019
President Trump continues to voice his dissatisfaction at Fed Chairman Powell for raising interest rates despite the Fed recently backing off future rate hikes and halting QT. Yesterday’s WSJ article article: Trump to Fed Chairman Powell – I Guess I am Stuck with You is more evidence that Powell is under the gun. Based on Trump’s recent selection of Stephen Moore, to the Fed, and Moore’s statements about immediately wanting to cut rates by 0.50pct, we believe Powell will have to choose between his job (cutting rates) and Fed independence (staying put on rates). If you are wondering, we believe Trump can and might fire the Chairman. We wrote on this last October – Chairman Powell – You’re Fired.
The next question you might be thinking is what are the implications for the markets. That is the subject of an article we are working on. We will release it if such an event becomes more probable. At the speed things are moving that could be in a few weeks!
Quick note– We have had a few questions on why we discuss the Fed so much. The answer lies in the fact that the economy is increasingly driven by debt and asset prices and less so on inventory cycles as it has been. The Fed controls money supply, strong arms interest rates, and more recently concerns themselves with the stock market. For the time being they are a big factor that we must account for. This arrangement is unsustainable longer term, but for the time being we must acknowledge it and invest accordingly.
April 2, 2019
Positive economic sentiment is clearly the growing narrative driving the market. We seem to read more and more every day that investors feel the economic slowdown of the 4th quarter of 2018 and recent quarter are now in the rear view mirror. Global and domestic data has been mixed at best. As noted China’s recent round of survey data was positive which is certainly important, but as of yet there are no signs that Europe is reversing course.
On Friday the BLS will report on the employment situation. Close attention will be paid to see if last month’s meager 20,000 increase in payrolls will be revised higher. Expectations are for a 170k increase in March which is on par with the longer term average for this expansion.
As shown previously on Chart of the Day, the percentage of companies in stock buyback blackout periods is rising sharply and will hit 50% by the end of the week. Might the market surge on Friday and yesterday be related to companies buying back stock before they enter their blackout period?
April 1, 2019
Update: Retail sales data for March was well below expectations at -.02pct, however the prior month was revised from 0.2 to 0.7pct, matching the difference between the March consensus and the actual number. The stock market is unfazed having barely budged since the data was released.
On Saturday night it was reported that China’s PMI survey surged back above 50, denoting that their manufacturing sector is back in expansion mode according to those surveyed. Interestingly however, Germany another barometer for global manufacturing activity, saw its PMI drop deeper into economic contraction at 44.1, an 80 month low. Since December of 2017, Germany’s PMI has dropped steadily from a high of over 65. It is worth noting that their services survey has been relatively flat over this period. This divergence points much more to global economic weakness than German weakness. The graph below charts the stunning decline of German PMI. Click on the image to enlarge.
Also causing us to question China’s survey data was Japan, in which their much followed Tankan Survey, saw the sentiment of large manufacturers hit a 6 year low.
Today is a big day for economic data in the U.S. as well. At 8:30 Retail Sales will be released. Given that the consumer accounts for nearly 70pct of economic growth, we will pay close attention to see if the recent consumer pullback is sustained or showing signs of rebound. Expectations are for a 0.3pct increase as compared to 0.2pct last month. Later, at 9:45, PMI Manufacturing will be released with expectations of 52.5 vs 53 last month.
March 29, 2019
The market is looking to open stronger this morning as we roll into the last day of the quarter. We do offer caution as the last day of the quarter can be volatile as traders and investors buy and sell securities as their portfolios are reported to investors. All eyes are on Britain today as Parliament votes on another BREXIT deal. This one has May offering to sacrifice her job in exchange for passage of the deal. Needless to say, this is a last ditch effort by May.
Chicago PMI Survey will be released at 10am today. This is the first of the major surveys that will help us gauge business activity in March. The prior reading was 64.7 which is historically high, so its likely to fall short. Consensus is 60.3.
March 28, 2019
Lance and Michael have written and discussed more about the Fed’s policy actions and the slope of the yield curve over the last few months than any other topic. A few days ago we presented you with an animated yield curve to help you better appreciate the gyrations of the curve. The Fed, with its abrupt U-turn in policy and the machinations of bond yields are screaming that growth is slowing quickly. This is not just an American story but one that is pervasive around the world. The amount of negative yielding bonds has doubled to over 10 trillion since September of last year. That bears repeating, there are now over $10 trillion of bonds that have a yield below zero! Equity investors should be asking themselves – are bond markets sending a false alarm or should I heed its siren song? As the saying goes, bond traders are usually right.
The currency markets are also starting to signal trouble. The dollar continues to slowly increase in value versus other currencies. Along with the message from the bond market, this is another sign that a “flight to quality” is upon us. The only question we have is when will the equity market take notice. With quarter end upon us, the market may likely stay put or even grind higher today and tomorrow. That said, all bets are off for early April. Keep in mind that many companies will be restricted from buying back their stock over the next few weeks due to earnings announcement. Corporations have been the largest buyer of stocks over the last two years. See today’s Chart of the Day.
March 27, 2019
The market is drifting lower this morning following yesterday’s rally. Of note, the Turkish Lira slid appreciably as overnight lending rates soared to over 700pct. The high rate was put in place by the government in order to prevent currency speculators (shorts) from weakening the currency. Turkey is trying to avoid a repeat of what happened to the Lira last summer.
The Consumer confidence data yesterday pointed to economic weakness. We follow this report closely as consumer spending accounts for nearly 70pct of GDP. The composite confidence number which had rebounded after the fourth quarter stock market, gave up most of those gains. The sharp decline this month, despite a relatively strong stock market is troubling.
The relationship between consumer confidence and stock prices has held strong since the mid-1990’s as shown below. While one month certainly does not make a trend, weakening confidence along with an inverting yield curve and concerning global economic data all point towards a coming slowdown in the U.S. economy. The relationship between economic activity, confidence and stock prices can create a potent circular dynamic in which stock prices fall, causing confidence to fall further, causing more economic weakness….and repeat. The first graph below shows the relationship of stocks and confidence.
Also within the consumer confidence report was information about the employment picture. This data also paints a concerning picture on the state of the labor market. See the second and third graphs below for more context. Click on the images to enlarge
March 26, 2019
The GIF below shows the monthly shifts of the Treasury yield curve from January 2018 to the curve as of last Friday. A few things to note as you watch the gyrations over time:
Watch the short maturities on the left side as they rise throughout 2018 and now appeared anchored near 2.50pct.
Led by the belly (3-7yrs), the curve becomes somewhat convex in the last few months.
30yr bonds start and end at the same levels.
The markets are opening stronger this morning on little news. Yesterday, the market was selling off but reversed course when Janet Yellen was quoted as saying: “Global Central Banks don’t have adequate crisis tools.” This continues a decent amount of Fed chatter in which they are essentially lobbying for extraordinary policy tools in the future. Prior to the last few months, and including the last five years or so, the Fed seemed more focused on reversing the policies of the post Financial Crisis era.
Fed Governor Quarles speaks Friday on the topic of Strategic approaches to the Fed’s balance sheet and communications. Sounds like another opportunity for the Fed to publicly discuss the use of QE, negative rates or other policy measures for the next recession/crisis.
March 25, 2019
Given that the possibility of a conviction of the President, his family, or key staff would have posed political problems and complicated the President’s agenda, it is surprising the market is not reacting more positively after the release of the Mueller Report.
Friday’s sharp decline on the heels of lower yields and yield curve flattening/inverting is telling us that the market is beginning to worry that the sharp change in Fed policy tack, as announced Wednesday, may be a tell that they think we are closer to a recession than commonly believed. It is worth highlighting that the 3month-10year yield curve inverted on Friday, marking its first inversion since the months preceding the Financial Crisis.
As we noted in Friday’s Ria Pro article Fearing Complacency, linked below, the financial markets (stocks, bonds and dollar) are trading as if market risks were benign. We beg to differ and think investors should take some risk off the table if they were uncomfortable with Friday’s decline.
March 22, 2019
The biggest story of the week that is not getting enough attention is the considerable drop in U.S. Treasury yields and the further flattening/inversion of yield curves. Bond investors are showing considerable concern about economic growth and we believe its only a matter of time until the stock market catches up to these worries.
Consider the following table highlighting the large weekly and monthly moves in longer maturity yields, as well as the flattening of all curves, and the inversion of shorter curves. Click to enlarge
March 21, 2019
Yesterday, the Fed stated that monthly amounts of QT will be reduced and ultimately halted by the end of the third quarter. They also lowered their Fed Funds rate expectations such that they do not expect to hike rates this year and expect only one hike next year. While, those results were widely expected, the tone in their statement is more dovish than expected. The Fed significantly tempered expectations about economic growth versus that from the last meeting in January. Fed speakers come out of the blackout period on Friday, so we look forward to any commentary from Fed Governors on their latest meeting.
What does the Fed know or who is pressuring the Fed to stop hiking rates and end QT? More importantly, and not widely appreciated is that Fed expectations for long-range Fed Funds is now 2.6pct, having been lowered from 3.1pct. The long term neutral rate is 2.75pct. The Fed is implying they will keep rates below the neutral rate, thus the economy will need stimulus over the next two years.
Jerome Powell: “economic fundamentals remain strong and our outlook is positive” – This is what we call talking out of both sides of your mouth.
March 20, 2019
Update Fed:
*FED TO TAPER BALANCE-SHEET ROLLOFF, SEES IT HALTING END-SEPT
*FED SIGNALS NO RATE HIKE THIS YEAR WITH ONE INCREASE IN 2020
The Fed has taken another dovish step.
Trade rumors drove the market up and down yesterday. Decent morning gains were erased on news that China might “walk back” some trade prior trade offers. The market quickly rebounded as it was announced that Mnuchin and team will travel to Beijing for talks this week. The market ultimately closed flat and confusion around trade abounds.
The Fed will likely drive the market today. They announce any policy actions at 2pm and follow it up with a press conference by Jerome Powell. No one is expecting any change to interest rate policy, however, it is probable they will amend their QT schedule with a final date. This has been well telegraphed in advance so we are not anticipating large moves on such an action. The wild card is most probable during the press conference. Stay tuned.
March 19, 2019
The market drifted higher overnight on little news of note. The big story this week will be the Fed meeting that starts today and ends tomorrow at 2pm with a policy statement and Jerome Powell press conference. We see little coming from this meeting that could send the market in one direction or the other. That said, it is this kind of set up, when everyone thinks they know the result, that can cause violent moves up or down.
The BREXIT debate rages on between those favoring an extension of the deadline and those against delaying BREXIT any longer. There is no clear consensus expectation at this point. Those that own assets in British pounds or hold pounds should consider currency hedges as trading in the pound could get much more volatile.
The market is rising above resistance levels we showed last week and into a new batch of resistance. The difference between today and a week ago is that if the next set of resistance levels are cleared there is little standing in the way of record highs.
March 18, 2019
Despite news reports from the Chinese media claiming that trade talks have been pushed off until June, the market is little fazed. With little news over the weekend the market will begin to look forward to Wednesday’s Fed FOMC meeting. The market is not expecting any rate action, but will be on the lookout for more guidance around diminishing and ending QT. We believe they will slow the pace of buying and ultimately end it during the fourth quarter. Any other economic and policy guidance from the meeting or Chairman Powell’s press conference will be closely followed for additional hints as for the future course of monetary policy.
The economic calendar is slow this week and Fed Governors will be blacked out from speaking due to the meeting on Wednesday. We expect they will restart the speaking circuit on Friday.
Companies reporting earnings in early April will begin their stock buyback blackout periods soon. The first earnings reports tend to be heavily concentrated in the banking sector.
March 15, 2019
The S&P 500 looks to open 10-15 points higher despite any real news. As mentioned yesterday, today is quadruple witching day so market makers will have a greater influence today than on most days. Expect volatility, up and down.
At ten am the BLS will release the JOLTS report. Job openings have been on the rise for a decade. While the data is expected to ease to 7.2mm from 7.34mm, there is little that tells us the job market is slowing in any meaningful way. This report tends to lead employment so any trends lower in this number over the coming months will be noteworthy. A consensus of economists expect industrial production to rebound today following a .6pct decline last month. Weakness in other countries industrial production data leaves us weary that the data may fall short today.
March 14, 2019
Update: As mentioned, Quadruple Witching day occurs tomorrow. Erik Lytikainen was kind enough to allow us to share his most recent model and its projections. Of note, S&P 500 and Crude Oil futures have options expiring tomorrow.
Based on Erik’s work the S&P could fall 45 points and crude oil over 2 dollars by tomorrow’s close. Erik’s model is based on the current price and the price need to achieve a neutral delta and gamma for the given options on the securities. Of the two Crude Oil is most interesting as Erik’s final price magnet has proven nearly perfect over the last six months. Click on the chart to enlarge it.
The China/US trade agreement is now being delayed. A scheduled meeting between XI and Trump will not happen in March and may not occur in April. The futures markets gave up overnight gains on the news.
In January we noted that credit creation surged in China. Credit data released for February were not nearly as impressive and lead us to believe that the one time surge was an effort to boost economic activity to advance trade talks. Economic data was little affected by the surge in credit as most Chinese economic data continues to be weak.
Tomorrow is a Quadruple Witching day, meaning that four sets of stocks options expire. The four include: stock index futures, stock index options, stock options and single stock options. Frequently, as we have shared with Erik Lytikainen’s reports, these day can be volatile. Given where the market sits, as discussed in the next paragraph, we suspect tomorrow could be a roller coaster kind of day.
As shown in the graph below, the S&P is pushing right into strong resistance. A move higher is likely bullish, but given the weakening macroeconomic outlook and political volatility (China trade, BREXIT, Mueller, etc. ) could also be a false breakout. The beige level below represents a Maginot line of sorts- stay long above it and be careful below it. We remind you that the market likes to extract the most pain possible at turning points. A 25-50 point run higher above the resistance line would get the shorts long, and the longs longer, setting up a painful point to turn lower.
March 13, 2019
Markets were quiet overnight despite the growing potential for economic turmoil in Britain. Parliament rejected a revised last minute BREXIT deal in an overwhelming defeat. 75 Tories from May’s own party voted against the deal. With the deadline for a deal approaching in two weeks, the options are limited. Today Parliament will vote on whether to leave the EU on March 29th with no deal (hard BREXIT) or agree to delay. While global markets seem unconvinced of a hard BREXIT, the possibility is growing. Over a year ago we wrote an article entitled Keep Calm and Carry On. While a little dated it still provides valuable information for how BREXIT may resolve itself and what the potential pitfalls are.
CPI inflation numbers were weak yesterday providing the Fed more cover for their dovish tone. PPI, released today, is expected to be weak as well due to the stronger dollar of late. Durable goods, expected -0.6pct, will be released at 8:30 and should provide more insight into how the weak global economy is affecting the domestic economy. Lastly, the Atlanta Fed’s GDP forecast, as shown below, is only expecting first quarter GDP growth of +0.2%. Click to enlarge.
March 12, 2019
The British pound is trading sharply lower as the race for a BREXIT deal is coming down to the wire. The EU has made it more clear over the last few days that the deal they have on the table is the last deal they will offer. Without a deal, it may come down to a hard BREXIT, which could prove damaging to the entire region.
While the Fed has certainly taken a dovish tack based on weakening global and domestic growth, inflation has yet to materially turn down. Investors will look at today’s CPI report for more clues about inflation. Current expectations are for a 0.2 and 1.6 pct increase monthly and annually, respectively.
Bloomberg ran an interesting article yesterday on the Term Premium in US Treasury Notes. Their is a lot of debate on whether the premium, which has recently become a discount, foretells weak economic growth.
March 11, 2019
The BLS will release January retail sales at 8:30am. Given recent weakness in the consumer sector we will be monitoring it to see if the trend continued after the holiday season. Consensus is calling for no change, following December’s 1.2pct decline. Personal Consumption accounts for nearly 70pct of economic activity so any trends related to the consumer bear watching closely.
CPI and PPI follow up the report on Tuesday and Wednesday respectively. Strength in CPI and PPI could prove troublesome for dovish tone the Fed has recently taken on. Jerome Powell will speak at 7pm tonight although little is expected as this is pre-recorded welcoming remarks for a conference.
Boeing shares are set to open lower by about 10pct on the impact of the Ethiopian Airlines crash.
Jerome Powell was on Sixty Minutes and said little new but it is worth watching- https://www.cbsnews.com/video/federal-reserve-chairman-jerome-powell-the-60-minutes-interview/
March 8, 2019
Update: Only 20k new jobs were added in February, far below expectations of +178k. We caution, winter months tend to be volatile so do not to read too much into the report. Hourly earnings beat expectations by .10pct. The combination of weak new payrolls and stronger than expected wage growth puts the Fed in a pickle. Jerome Powell speaks at 10am, lets see if he comments on the report.
Weak Chinese exports (-17pct yoy) coupled with a supposed delay of the Mar-A-Lago Trade summit caused China’s markets to sell of significantly. US markets are also trading weaker but today’s direction will likely hinge on the employment report.
Good is bad and bad is good. That is our thought at least. A weak payrolls number allows the Fed to stick to ending QT and keep its dovish tone. If we get another strong employment print with gains in wages and hours the Fed may be forced to take on a more hawkish tone. As precursor to today’s employment report we share the following recent employment data and the chart with today’s consensus expectations:
ADP +183k
JOLTS – Job cut announcements rose 45pct to 76,835, the highest monthly total in three years
Jobless claims- The 4 week moving average is 226k. Historically very low, but it has trended higher since October
March 7, 2019
Tomorrow the BLS will release employment data for February. The table below shows last month’s figures and the consensus expectations. Also of note Jerome Powell will speak at 10am tomorrow. A third strong employment report in a row will make it difficult for the Fed to continue to talk back 2019 rate hikes.
The following headline caught our attention yesterday- FED’S WILLIAMS SAYS IN A DOWNTURN WE COULD CONSIDER QUANTITATIVE EASING, NEGATIVE RATES.
On December 19, 2018, less than three months ago, the Fed was set to raise rates 3 times in 2019 and Jerome Powell said QT was on “autopilot.” Since then, the Fed has signaled that QT will end soon and they have discussed using QE in the future on numerous occasions. Now, Governor Williams is adding negative interest rates to the list. Clearly, the Fed is deeply concerned about something!
March 6, 2019
Update: The Dow Jones Transportation Index has fallen 6 days in a row and is lagging the Dow and S&P 500. The following article from Zero Hedge provides some insight into what this might portend for the broader market. -Click to read the article.
Stocks are looking to open slightly weaker after lackluster trading yesterday and last night. The S&P is currently at the same levels as February 20th, attesting to the recent sideways action. Trade rumors have helped the market but it appears that we are at the point where a deal will be needed to budge it from its range. While it may seem obvious based on trading that a deal will be good for the market, we simply offer caution. “Buy the rumor, sell the fact.” Our concern is that a deal with no teeth is reached or once a deal is reached, Nancy Pelosi immediately states that Congress will not approve the deal.
On Friday we get the BLS report on employment but today at 8:15 et, ADP will release their jobs report. This report tends to have good predictive power. The current ADP estimate is for a gain of 183k jobs as compared to 178k for the Friday report.
March 5, 2019
Markets were quiet last night with the only news of note coming from China. China lowered their 2019 GDP growth target to a range of 6.5-6pct. This compares to 2018s goal of 6.5pct. They also lowered various VAT (taxes) to help stimulate growth. Deal or no deal, China will be negatively impacted by Trumps trade stance. It is likely they will stimulate economic activity using domestic means to help offset whatever they may lose in trade.
Yesterday, the market sharply reversed an overnight rally that was based on positive trade news. There was no news of consequence to justify the reversal. While the S&P 500 only closed down ten points, at one point in the day it was down over 50 points from the pre-market highs. As noted by Lance in last weekends newsletter, might the market be exhausting itself?
Of note, the S&P 500 futures (es) traded above 2814. As Brett Freeze has stated, this signifies a two month high is now officially in place. In the past this signal has helped confirm bear markets. For more, click on his latest Cartography Corner article below.
March 4, 2019
Not to sound like a broken record but the S&P 500 is looking to open about 10 points higher on news of the progression of US/China trade talks. Unlike prior rumors the news coming out over the weekend included specifics regarding trade in Natural Gas and Whiskey.
Economic data will be light this week, however the employment on Friday will be a huge focus. Currently expectations are for a gain of 178k jobs, down significantly from the 304k created in January. Fed speakers will not be as prominent over the next two weeks as the FOMC meeting is March 20th. We will have much more on this in two weeks but it is becoming more probable that a schedule to end QT will be announced at this meeting.
March 1, 2019
The market is up sharply on stronger than expected economic data from China. The Caixin PMI data report rose to 49.9 from 48.3. While still pointing to economic contraction it is not as weak as expected. The US markets strong reaction to this report and nonchalant response to a slew of weak data is telling. The market makers are trying to push markets higher. This is much easier to accomplish during the less liquid overnight session as we saw last night. One of the traits preceding the declines of the first and fourth quarters of 2018 were strong gains in the early part of the trading sessions erased by days end. We have witnessed some such activity recently but not enough to warrant too much concern. Will today be another instance?
Today, PMI and ISM will release their manufacturing Indexes for the US. Chicago PMI was strong yesterday, so we suspect this set of data will be in-line with or better than consensus.
February 28, 2019
Despite flooding the economy with new debt in January, China’s economy is still showing troubling signs. China’s Purchasing Managers Index- Manufacturing (PMI) fell to 49.2, below consensus of 49.5. A reading below 50 denotes economic contraction. The drop was led by the new export order sub component which shows deeper contraction at 45.2. China’s non-manufacturing PMI remains in expansion mode at 54.3, but has also been declining. In the past, China’s economy responded positively to impulses of new credit. This dynamic bears our attention as China has been the world’s drive of economic growth for the past decade.
US GDP will be released this morning. Annualized Real GDP is expected to be 2.1pct versus 3.4 pct last quarter. Please see our chart of the day to put today’s GDP into context with the past four years.
If you were on vacation since Thursday you will be happy to know you didn’t miss anything. Here are the daily closes of the S&P 500:
2792.34 Today
2793.90 Tuesday
2796.11 Monday
2792.67 Friday
February 27, 2019
Chairman Powell will speak again today in front of the House of Representatives. We suspect he will be grilled on policy and in particular disparaging comments he made about MMT yesterday . It is not likely market moving comments will come from this testimony.
Pending home sales will be released at 10am along with factory orders. Given the poor housing data yesterday we will pay attention to today’s data.
Between Michael Cohen’s testimony to Congress, India/Pakistan border hostilities and the Trump/Kim summit we are on the lookout for news that might move the market.
February 26, 2019
Update: Housing data released this morning was weak. Housing starts fell over 11 pct. to a rate that was 150,000 below expectations. It was the weakest showing since 2016. Adding further insult to injury, the Case-Shiller Home Price Index was reported at +4.18 pct. While still a nice growth rate it is the lowest in nearly 7 years.
Tesla is off over 5% as the SEC asked a judge to hold Elon Musk in contempt of court for violating their settlement from last last year.
Catepillar and Home Depot, two large Dow Jones Industrial comapnies, are opening weaker this morning. CAT was downgraded to a rare “sell” from UBS, while HD’s earnings and revenue were reported to be weaker than expected.
Jerome Powell will speak today at 10:45 et. It seems as if the policy makers at the Fed are in agreement but Powell may shine light on a Fed that is split in regards to future direction of policy.
Interestingly yesterday’s rally on the trade agreement faltered with the markets closing marginally higher. If you recall we saw decent gains wiped out intraday in the periods leading to the October sell-off and the February 2018 declines. One day does not make a trend but certainly bears watching given the grossly overbought conditions. We ask you read our short article Cartography Corner Market Update published yesterday. This note from Brett Freeze is an alert that a trusty indicator of his is now signalling that we could very well be in a bear market.
February 25, 2019
The S&P 500 is opening stronger and China’s stock markets are surging on the delay of the March 1 trade deadline. The CSI 300, a broad index of Chinese stocks is up nearly 7pct this morning.
The market is also being helped by comments from Fed Governor Richard Clarida, who on Friday, mentioned how QE might be used differently in he future. While some perceive that as bullish, we simply ask you to consider why has the Fed made such a policy U-turn in two months and paid so much lip service to QE? We think there is more to the story than the market has figured out. Jerome Powell speaks on Tuesday and Wednesday and will hopefully shine more light on the Fed and their intentions.
President Trump tweeted the following this morning: “Oil prices getting too high. OPEC, please relax and take it easy. World cannot take a price hike – fragile!” Crude oil is trading lower on the comment.
February 22, 2019
Trade talk optimism is back and markets look like they will recover yesterday’s losses. Of note today will be Kraft Heinz (KHZ). The stock closed yesterday at 48.18 after being as high as 90 in early 2017. After the close yesterday the company revised earnings lower and took a 15 billion dollar impairment. The stock is slated to open down 20 percent this morning.
Soft data, such as business surveys, tend to be good leading indicators of economic activity. Yesterday, on the heels of signs of economic contraction in Japan and Eurozone, two US “soft” indicators were mixed. The PMI composite was higher than expectations but the manufacturing component within the index was below consensus. Of much more concern was the Philadelphia Fed Business Outlook Survey which was reported well below expectations at -4.1 (consensus was +14.0). This survey points to economic contraction in the Philadelphia region. We should not read too much into a regional survey but this survey tends to be a good leading indicator. The Philly Fed was the first indicator to surge higher after President Trump was elected. Also of note, a key component of the survey, New Orders, now stands at lows not seen since 2016.
Today’s calendar is chock full of Fed speakers as follows:
8:15 AM Bostic
10:15 AM Williams and Daly
1:30 PM Quarles, Clarida, Bullard, and Harker
5:30 PM Williams
February 21, 2019
Last night there were numerous press releases and Tweets pointing towards agreement with China on a host of trade issues. The market rallied at first, but is currently trading lower. Given the state of China’s economy, is the market realizing that China does not have the ability to sign a major deal that would further harm their economic activity?
The Eurozone and Japanese PMI Manufacturing Indexes both fell below 50 and, as such, their respective economies are now considered to be in contraction. This latest data set lines up with a host of other economic data that also points to recession in both regions.
South Korean exports to China fell 14 pct for the first 20 days of February. The strong message coming from China’s trade partners is that China’s economic activity is slowing rapidly. The trade dispute is with the US, therefore trade activity with South Korea and Japan, as we mentioned yesterday, should be relatively stable. It is clearly not and the world economy is suffering as a result.
In the January 2019 FOMC minutes (released yesterday), the word “uncertain” was used 17 times. We have opined that the Fed appears to be out of sync with economic data and being led by the financial markets. Thus far the market trusts the Fed, but its likely the trust wears thin as “uncertain” can lead to panic.
February 20, 2019
Update: Per the FOMC minutes it does appear that QT will end this year. Here is the paragraph in the minutes alluding to the change. Click to enlarge.
Japanese exports to China fell by 17.4pct attesting to a continued weakening of Chinese economic growth. With Japan and Europe teetering on recession and economic growth being downgraded domestically, further slowing in China could push the global economy into a recession.
As part of negotiations with the US, China is being asked to keep their currency, the yuan, stable. This flies in the face of years of claims from Bush, Obama, Trump and much of the rest of the world, that China was manipulating their currency to favor trade in their goods. Now, according to sources, China is being asked to manipulate their currency so they do not offset tariffs or other trade agreements with a weaker currency.
The FOMC minutes from the January meeting will be released this afternoon. FOMC minutes are revised well after the meeting to reflect current thoughts. As such we look for more clarification of Mester’s comments about putting an end to QT.
Volume on the NYSE yesterday was the lowest since the day before Thanksgiving. Given the recent surge, bulls are becoming weary and possibly taking some profits. At the same time, bears are licking their wounds and appear scared to reset shorts. We suspect this market standstill could continue for a few days. Beware however, frequently lulls in trading that occur after a volatile period are met with a resurgence in volatility. Use this rest bit to adjust your positioning for what will likely be larger moves up and/or down in the weeks ahead.
February 19, 2019
New Feature: We just added a heat map to our site. As shown below, the new tab shows a heat map that can be based on a number of different sectors or security types. You can also run the heat map for different time frames by clicking on the drop down box that is set to “Today’s.” If you click on Grid, you can sort the securities in the sector or index by a number of variations. This function also works for your personal portfolios and watchlist. Click on the picture to enlarge.
The market is opening weaker with little economic data on the calendar today. Of interest might be Fed Governor Loretta Mester who is scheduled to speak this morning. As we noted in the February 13th Quick Take, Mester made it clear that the Fed was discussing how and when to put an end to QT. Five Fed Governors speak on Friday to help us better understand the current Fed thinking. Also of note, the minutes of the January Fed meeting will be released tomorrow.
The horrendous retail sales report and other poor economic reports last week caused the Atlanta’s Fed GDP forecast to plummet as shown below. This was confirmed by the New York Fed’s GDP Nowcast which was reported at 1.08 pct Down from 2.17 pct. Evidencing the unexpected nature of the weak data, the Citi Economic Surprise Index posted its biggest weekly drop since 2011. The index measures economic data as reported versus expectations for said data. Click the Atlanta Fed GDPNow image to enlarge
February 15, 2019
Update: The Michigan sentiment number came in slightly better than expectations, reducing concern over yesterdays retail sales number. However, the following was part of the commentary released with the survey- “Consumers’ long term inflation expectations fell to the lowest level recorded in the past half century”
S&P futures are up over 15 points from the lows last night. You guessed it- China trade talks. The rebound occurred right after Steven Mnuchin tweeted the following : “Productive meetings with China’s Vice Premier Liu He and Amb. Lighthizer.”
We belabor the consistent rally’s off the same trade news because it increases the likelihood that any failure to produce a deal or a poor deal has the potential to shock the market. We remind you of an old Wall Street adage- buy the rumor – sell the fact.
This morning keep a close eye on the University of Michigan Consumer Sentiment Report. Retail sales, as noted yesterday, pointed to a marked slow down of consumer economic activity. While it was blamed on a host of one-time reasons, the Michigan report will help us understand if the excuses are real or consumers are really cutting back. On the back of weak data yesterday expectations for first quarter growth were revised sharply lower from 2.7 pct to 1.5 pct from the Atlanta Fed.
Reminder that Monday is Presidents Day and the markets will be closed.
February 14, 2019
Update: US advance retail sales unexpectedly fell 1.2% in December. It was the biggest drop monthly since 2009. Jobless claims advanced slightly versus an expected decline.
The S&P 500 is looking to open about 10 points higher on reports that the US/China trade deadline may be extended 60 days. The question on the top of our mind seemingly every morning is how many times can the market rally on the same news- positive trade talks? Apparently, many more than makes sense.
On the economic front PPI will be released at 8:30. Expectations are for a gain of 0.1pct monthly and a 2.1pct rate of growth annually. Jobless claims will also be released with the market looking to see the recent increase in claims due to the government shutdown erased. Lastly, retail sales, which was delayed due to the shutdown, is expected to show a .1pct gain.
We expect that the President will sign legislation to avoid another government shutdown. While already priced in, we would not be shocked if the market rallied once he inked his signature. Such is the nature of this rally over the last six weeks, and for the better part of the last 8 years.
February 13, 2019
Update: Please see the Blogs tab for our article on Mester’s comments.
The market had a strong rally yesterday on what was credited to progress in US/China trade talks and an agreement to avoid another government shutdown. The strength of the rally was surprising and we suspected there was something more to it.
Last night we found out what it was. Fed Governor Loretta Mester from the Cleveland Fed, said the Fed plans to end balance sheet runoff at the coming meetings. We will publish a “Quick Take” short article on this surprising announcement later today.
This morning the BLS will release CPI which is expected to increase 0.1 pct for the month and 1.5 pct year over year. More importantly, based on the prior comments, Mester will speak at 8:50et. The market will seek more details of her comments from last night. Again, a deal to avoid a shutdown and US/China trade talks will be atop of things to watch for.
February 12, 2019
The market is looking to open up strong this morning on prospects of a government shutdown being averted. The “deal” on the table contains less than 2 billion in funding for the wall so the big question is will Trump sign it?
Also helping the market is positive movement on the China/US trade talks.
In regards to both of these, the last government shutdown went from December 22nd to January 25th. Over that period the market surged. As such, it is not clear to us that averting a shutdown is meaningful for the market. As far as trade talks we have seen one false rumor after another purporting forward progress. While this may be the case, any deal will be most certain to hurt China’s economy. Given they are already witnessing a significant slowdown, will they sign such a deal? We believe there will be a deal, but given China’s economic situation we do not believe it will carry much weight.
The dollar is slightly higher this morning and on an eight session winning streak. For countries such as China which employ US dollar debt, a stronger dollar means more of their home currency is required to convert to dollars for interest and principal payments. Therefore a strong dollar is an added expense and economy killer to those countries dependent on the estimated 10+ trillion of foreign debt denominated in dollars.
February 11, 2019
The market stormed back from 1pct loses on Friday afternoon after San Francisco Fed Governor Daly claimed the Fed was debating using QE “on a regular basis” and not just for emergency policy as was clearly stated over the last five years. There are a host of Fed speakers throughout the week so keep an ear out for any further discussion about the benefits of QE as a “regular” policy tool.
On Thursday and Friday trade talks between Vice Premier Liu and US Trade Representative Robert Lighthizer will commence. Market direction later in the week will sway with statements alluding to progress of the talks. This discussion may be the last face to face negotiations before the March 1st deadline set by Donald Trump so it is of added importance.
Other than inflation indicators CPI and PPI, released on Wednesday and Thursday respectively, there will be little economic data released. Earnings reports will also begin to slow this week as most companies have reported fourth quarter results.
February 8, 2019
Markets sold off yesterday on concerns that trade talks with China are not progressing as well as previously thought. That is the media’s narrative at least. The fact is that the market was very overbought, having rallied 17 pct in a little more than a month and was pushing up against the all important 200 day moving average. As we suspected, and witnessed by our recent portfolio actions, the market was due for a let down. The big question is are we just bouncing around to allow overbought conditions to moderate or has the downturn that started in October resumed?
These are key questions and we are looking for technical clues to help answer the question. For the time being we look at the 200 day MA as the top (2742) and the 50 day MA as a floor (2615). If either is broken it is quite likely the market will continue in that direction. We point out that the 100 day MA capped three buying spurts in October and November before the market fell in December to new lows. On Monday the 100 day MA was overtaken. Yesterday the market traded below it until the last few minutes where it closed 2 points above it. It is trading below this morning. A break below it today or in the coming days would be a sign that the 50 day MA is the level to watch.
February 7, 2019
Yesterday we published RIA Pro Economic Update, an economic outlook that reviews the worlds four largest economies. Our take- U.S. growth continues to hold up but that of China, Japan and Germany all appear to be weak, with parts of the Eurozone likely to enter recession in the coming months. In case you missed it, the link is below.
More signs of global slowing were revealed last night as the Bank of England (BOE) lowered their growth forecast from 1.7 pct to 1.2 pct and Italy’s forecasted GDP growth for 2019 was reduced further to a paltry 0.2%. In Asia, India cut their benchmark interest rate as an economic slowdown is felt on their shores. India and recent weakness in Australia are likely the affects of China slowing much more quickly than is understood by most media outlets.
Global growth matters. They represent about 40% of S&P earnings.
Chairman Powell spoke last night but had little to add to prior comments. Interestingly however, former Chair Janet Yellen spoke and said the following: “Both outcomes, a Fed hike or a cut, are possible.” We are not sure what to make of it but it does further strengthen our argument that the Fed may be trying to talk dovishly and walk hawkishly, or as we said “talk out of both sides of their mouth.”
February 6, 2019
German Industrial Orders not only fell for the 7th consecutive month, but reported the largest decline since 2012. Last week Italy report a negative fourth quarter GDP which, given it was also negative in the third quarter, puts Italy, the worlds 8th largest economy, officially in a recession. Germany, the worlds 4th largest economy, reports GDP on Friday February 14th. Expectations are for a slight increase. We expect a negative reading and with that Germany would join Italy in a recession. We are currently putting the finishing touches on a RIA Pro article that discusses economic activity in China, Germany and Japan to help get a better read on the domestic economy. We hope to have it out by tomorrow at the latest.
Reminder- Jerome Powell speaks at 7pm et tonight. If he speaks on monetary policy and the Fed’s recent about-face on future policy we will report on it tomorrow morning.
February 5, 2019
The markets drifted higher overnight as seemingly appears to be the recent trend. After an extremely volatile fourth quarter and early start to January, the equity markets appear to be undaunted by negative economic data and earnings. This recent activity has the look and feel of trading activity of the last three years. We caution however the issues that turned the market lower in the first and fourth quarters of 2018 are alive and well.
We are looking for this rally to halt somewhere between current levels and the much watched 200 day moving average. The moving average is currently at 2741 or about 15 points above current levels. It is likely the market will struggle to overtake the average on its first attempt and could retreat as conditions are greatly overbought and market breadth is not strong. In this scenario, we must be nimble and be willing to buy on a decent break above the moving average but not lose sight that it is very likely we have entered a longer term bear market. Trade short term – Invest long term. For traders, current levels represent a decent spot to reduce holdings or add a short position with a stop loss and possibly buy order above the 200 day moving average. Frequently, prices will rise 1-2 percent above a key technical level, trick the market and then reverse. Accordingly patience, tight stops, and close attention is warranted.
Chairman Powell will speak tomorrow night and we have some concern that he might walk back some of his market friendly statements following the Fed meeting last week.
February 4, 2019
Global markets are quiet this morning, in part because China just began its New Year holiday. News should be light from China as the holiday lasts a week.
At 10 am et factory orders will be released. We caution the data is for November so do not read too much into it. This week President Trump will present the State of the Union on Tuesday night and Jerome Powell will speak on Wednesday night. As far as markets go, any discussion by Trump on China and trade should elicit a market response. Once again with Powell we will look for clues on the new path of easier monetary policy.
February 1, 2019
The BLS reported this morning that 304,000 new jobs were added in January, nearly double the 170k expected. The caveat to the report was that last months 312k job gain was revised lower by 90k. That said the two month jobs gain is running strong and above trend.
The unemployment rate rose for a second month to 4.0 pct. This is largely a function of new entrants entering the work force and not the more traditional causes of higher unemployment. Average hourly earnings only rose .1pct versus expectations of .3pct. This is a little surprising given the strength in new jobs and the full employment rate.
The two month pick up in jobs growth is sure to worry the Fed which, as you know, as been backing away from the idea of raising rates.
Later this morning we will publish a second part to the Quick Take Fed meeting notes. With more time to think and discuss the abrupt pivot of the Fed we have more thoughts and questions to share with you.
January 31, 2019
Please note we published a Quick Take yesterday afternoon containing our thoughts on the Federal Reserve meeting and the ensuing press conference. The article is in the Blogs tab and can also be read by clicking the picture below.
Of particular interest to us yesterday was that the dovish pivot by the Chairman and the Fed as a whole was accompanied by a decline in long term interest rates. As of 7am et, the yield on the 10 year US Treasury Note has dropped from 2.73 to 2.66. Given relatively decent economic strength and a new policy stance that is more inflationary we would have expected rates to rise. Might bond traders be warning us that there is a reason for the quick Fed pivot?
Gold, as to be expected given the Feds new dovish stance, is trading well. It consolidated below 1300 for the better part of January but over the last few days surged to 1320. Overhead resistance is in the 1360-80 range, the highs of early 2018 and 2016. Look for 1300 as support and the aforementioned range as resistance.
January 30, 2019
UPDATE: The Fed is clearly taking on a more dovish tack. The following quotes were taken from today’s statement:
“The FOMC will be patient as it determines what future adjustments to the target range for the federal funds rate may be appropriate”
“The Committee is prepared to adjust any of the details for completing balance sheet normalization in light of economic and financial developments”
In addition they downgraded their assessment of economic growth to “solid” from “strong”. The market initially surged higher on the dovish statement. Chairman Powell will speak at 2:30et and may shed further light.
The following statement was also released which in our opinion makes QE4 a question of when not if.
“The Committee continues to view changes in the target range for the federal funds rate as its primary means of adjusting the stance of monetary policy. The Committee is prepared to adjust any of the details for completing balance sheet normalization in light of economic and financial developments. Moreover, the Committee would be prepared to use its full range of tools, including altering the size and composition of its balance sheet, if future economic conditions were to warrant a more accommodative monetary policy than can be achieved solely by reducing the federal funds rate.”
The market is looking to open higher on quiet overnight trading. Apple’s much anticipated earnings came in as expected, which should not be surprising given they updated guidance two weeks ago. Today, as we are now at the height of earnings announcements, we get a barrage of earnings reports including Tesla, Visa, McDonalds and Boeing.
Also of note today will be the ADP Employment Change which is currently estimated at +181,000. This number has reasonable correlation with the BLS jobs numbers released this Friday, so close attention will be paid. Last month ADP rose 271,000 which accurately predicted the strong rise in BLS payrolls (+312,000). Another strong payrolls print may be alarming to the Fed as strong job growth in such a tight labor market is all but certain to presage wage inflation.
Most important today will be the Fed’s monetary policy announcement and Powell’s press conference following the statement release. The market is looking, dare we say “hoping”, for further indications that rate hikes have indeed ceased and a reduction in the amount of balance sheet run-off is in the works. Anything short of these could lead to weakness in the markets. We will have more on the meeting and conference after they occur.
For what its worth, Powell has presided over 7 Fed meetings and the market has been down on the day in each one.
January 29, 2019
The rally off of the Christmas eve lows was driven in large part by very oversold technical conditions. With it however came two core narratives that may have helped elongate the surge. First was a shift in rhetoric and optimism from both China and the US that a trade deal was progressing nicely. Second, was rumblings of a shift in Fed policy away from further rate hikes and possibly a reduction in the amount of balance sheet reduction.
Almost a month later and the severe oversold condition has been transformed into an overbought condition. On the trade front we are increasingly growing concerned by the US actions against Huawei and its CFO. Applying pressure with criminal charges, as occurred yesterday, may be a leveraging position by the US, but the Chinese are not happy with it. Will this point of contention be resolved or is it a sign that negotiations are breaking down? The Fed meets today and Wednesday and then will release their policy statement followed by a press conference by Jerome Powell (2pm et 1/30). Will the Fed live up to the article in the WSJ that proclaimed they were done hiking rates and considering reducing the pace of QT? Maybe, but what if that article was not a leak from the Fed and they come out more hawkish than the market suspects?
These narratives are on thin ice. Time will tell if the market can now stand up on its own without narratives and technical support or if the poor fourth quarter was the opening salvo into a greater decline.
January 28, 2019
This week will be a busy week with the potential for numerous market moving events/announcements. At the top of the list are the following:
Trade talks with China will continue this week. Last night the Chinese yuan rose to a three month high, which is a positive signal. A stronger currency makes imports into China cheaper and exports to other countries more expensive. Therefore a stronger yuan, which is controlled by the government, is a sign they are negotiating in good faith.
The Federal Reserve meets on Tuesday and Wednesday in regards to monetary policy. We do not expect the Fed to raise or lower rates but are looking for firmer language about the future path of rate policy and QT.
The biggest technology companies will report fourth-quarter results throughout this week.
There will be a number of potentially key votes in the U.K. Parliament about Brexit.
Last but not least, will be the employment data to be released on Friday.
We will post more on these events as they occur.
January 25, 2019
Happy Friday!
Market is looking to open higher this morning after testing the 50-dma average for a third day in a row.
Interestingly, despite rumors of lack of progress on trade talks, the ongoing Government shutdown, and less than stellar earnings reports, the market has been saved repeatedly this week by late day appearances from Larry Kudlow talking up White House progress.
This morning, futures are pointing higher which looks to test the downtrend line from the 2018 market highs. A break, and close above that downtrend line will reverse the bearish trend from 2018.
(Click To Enlarge)
Top Overnight News
A Chinese delegation including deputy ministers will arrive in Washington on Monday to prepare for high-level trade talks led by Vice Premier Liu He, according to people briefed on the matter
Commerce Secretary Wilbur Ross said the U.S. and China are eager to end their trade war, but the outcome will hinge on whether Beijing will deepen economic reforms and further open up its markets. “We’re miles and miles from getting a resolution,” he said in an interview on CNBC on Thursday
U.K. Chancellor of the Exchequer Philip Hammond warned that leaving the European Union without a deal would betray voters who were promised a “more prosperous future” if they chose Brexit. EU ties itself in knots on Irish border amid Brexit tension
Senators began a new effort to end the 34-day partial government shutdown after blocking two rival spending bills. The White House signaled President Donald Trump was open to a plan to reopen agencies for three weeks, but at a price
The Greek parliament’s historic vote on the agreement with the Republic of Macedonia over the latter’s name, was pushed to Friday, with not enough time for all listed lawmakers to speak Thursday
Oil rose for a third day as a deepening crisis in Venezuela that threatens to complicate OPEC’s task of balancing world oil supplies outweighed a surprise jump in U.S. crude inventories
Bank of England Governor Mark Carney said threats of jail for bankers are just a bluff and the real weapon to improve behavior is hitting pay packets
U.K. Chancellor of the Exchequer Philip Hammond suggested he could quit the government in protest if the U.K. plunges out of the European Union with no-deal in nine weeks’ time
Benoit Coeure and Francois Villeroy de Galhau — two of the top contenders to become the next ECB president — said they don’t know if the institution will be able to raise interest rates this year
January 24, 2019
European economic growth continues to slow. Last night Germany, the world’s fourth largest economy, reported that their PMI manufacturing survey dropped below 50, signaling contraction. This was the first time it fell below 50 in almost five years. The ECB met this morning and said they would keep rates constant “through the summer of 2019” and also keep QE balances steady as they will reinvest all maturing proceeds. It is important to note that ECB borrowing rates are currently near zero. If a recession occurs, which is becoming more likely, what tools does the ECB have at their disposal? Negative interest rates and more QE!
In the US we will get PMI (composite, manufacturing and services) at 9:45 et. This soft data survey will provide clues if we are following in the slow growth footsteps of Europe. Keep in mind some economic data is being withheld due to the government shutdown, so these soft data surveys are an important source for economic information.
January 23, 2019
UPDATE: Richmond Fed came in at -2. While slightly better than expectations, it points to economic contraction for the second straight month. This is the first time this has happened since 2016.
New Feature: We added a tab entitled Blogs which will house RIA Pro exclusive articles alongside articles regularly published on the Real Investment Advice site. Please refresh the screen if the tab does not appear at first.
Tuesday marked the first down day of greater than 1% on the S&p 500 since January 3rd. During the day the market slipped below the 50 day moving average but closed above it due to a late day rally on rumors that the budget impasse was resolved. As we have said numerous times in regards to market charging rumors- “Deja vu all over again” – Yogi Berra.
The market is looking to open slightly higher albeit with little news to propel it one way or the other. Keep an eye out on the Richmond Fed survey due at 10am et. Given the missing government data this will provide another clue as to whether the economy is hitting a soft spot. Current expectations point to an economic contraction reading of -6.
January 22, 2019
Following the IMF downgrade of global economic growth and China’s lowest GDP growth since 1990, Germany further confirmed that global growth is slowing in both the euro region and the world. Germany is the worlds third largest economy. Their widely followed ZEW index (survey – soft data), continued to point to a contraction of economic activity. While the overall index was slightly above expectations at -15 vs -18 (consensus) it still points to economic contraction. More concerning was a sharp drop in the current situation index which fell to levels last seen during the 2014 recession. Please see the Chart of the Day.
The US economic calendar is light this week with the headliners being the Richmond Fed Survey and Durable Goods. The market will likely take its cue from trade talks with China.
January 21, 2019
Cash US markets are closed for the Martin Luther King holiday. Futures are open on a partial schedule and showing a ten point decline in the S&P. Concerns about trade and the government shutdown appear to be the rationale.
The IMF revised their estimate of global GDP growth as follows:
Global GDP 2019 3.5 (3.7 Oct)
Germany 2019 1.3 (1.6)
USA 2018 *2.9 – 2019 2.5
China 2018 6.6 – 2019 6.2
January 18, 2019
UPDATE: Industrial Manufacturing a sub-component of the Industrial Production number was much higher than expected today. We warn you this is December data, whereas the regional surveys we have been worried about are for later December and January. This is a great example of lagged hard data and current soft data telling two different stories. Time will tell which is right.
Netflix beat their expected earnings per share but every other metric including the all important forward guidance was worse than expected. The stock is off of its lows but still down over 3% in the pre-market. Tesla reduced fourth quarter earnings guidance and announced plans to release 7pct of its workforce. The stock is down about 8% in the pre-market. Lastly, Foxconn, the largest producer of iPhones is also reducing its workforce by about 50,000 jobs. All three news events point to revenue shortfalls in the high flying tech sector. It is these stocks, that led the market higher.
Despite the poor earnings news the market continue to chug higher. The latest rationale for higher prices is supposed progress in the China-US trade talks. Our thoughts- In the words of baseball great Yogi Berra “Deja vu all over again.”
Industrial production will be released at 9:15 and Consumer sentiment at 10:00 eastern time. Given the market’s current predisposition to rally regardless of news, it is not likely either data point will be of concern to the market.
The market continues to break through a wide swath of various resistance levels. While we continue to think a top is near, we are also respectful of the market and are considering tactical purchases if the market keeps showing strength. Our longer term outlook has not changed.
January 17, 2019
The markets have certainly calmed down this week from the frantic up and down trading we witnessed over the prior few months. We take a look at volatility in our latest RIA Pro article titled Has The Market Entered The Bears Den. In this article we highlight the ATR (average true range) or daily difference between the days high and low. This week it is averaging below 1 pct. You have to go back to December 3rd to find the last day where the range was below 1%. As a point of reference, the average ATR for the period ranging December through last week was 2.35pct.
On the economic data front we will get Housing Starts, Jobless Claims and The Philadlephia Fed Survey. Of interest will be the “Philly” Fed as we look for continued declines in the soft data (survey) indexes. The current estimate is 10.
Lance Roberts wrote a great piece describing and quantifying this recent change in soft data. The link is as follows- https://simplevisorins.wpengine.com/the-economy-is-slowing/
January 16, 2019
Stocks look to open flat this morning despite the BREXIT defeat, political turmoil in the U.K. and concerns that U.S. – China trade talks are stalling.
On the positive side Bank of America reported earnings above expectations and China added reserves to their economy which should spur some economic activity. On a separate note, retail sales were slightly lower than expected at .1 pct versus expectations of a .2% increase.
Lower rates are helping housing activity as shown by the most recent MBA housing activity reports. The purchase index rose 9 pct last week following a 17pct increase the preceding week. Lower rates will help housing and autos.
January 15, 2019
Update: Further signs of economic weakness emerged this morning. The Producer Price Index (PPI) for December was -.2% m/m and 0% y/y, both were .2% less than consensus. The Empire State Manufacturing Survey was 3.9 vs. estimates of 12. This survey confirms weakness that has been cropping up in other manufacturing surveys.
Update: JPM missed on earnings by a wide margin and barely missed on revenue. Like Citi, weak trading revenue (1.86bn vs estimate of 2.29bn) was a big source of the poor earnings.
JP Morgan, Wells Fargo and United Healthcare are on the earnings docket this morning. Citigroup stock was higher on Monday despite missing revenue estimates but they did beat earnings estimates due to a reduction in expenses. The stock was up over 4%, albeit still down about 25% from its October lows. Of note profits from equity and fixed income trading were weak. This theme should repeat itself all week due to the recent bout of volatility in the markets.
January 14, 2019
Weak import/export data from China and much lower than expected Eurozone industrial production is sending the markets lower in overnight trading. Further, heightened concerns of a failure of Prime Minister May to pass a BREXIT deal and the high likelihood of a PG&E bankruptcy are providing additional pressure. Lastly, the ongoing government shutdown isn’t doing the market any favors either.
Economic data this week is relatively light, however Retail Sales on Wednesday should provide a glimpse into the robustness of holiday sales from December. Earnings season is now upon us and the banks will lead off this week. Citi announced earnings this morning and most major banks will follow in the coming week. The full calendar can be found here: https://finance.yahoo.com/calendar/earnings?from=2019-01-13&to=2019-01-19&day=2019-01-15
January 11, 2019
Update: At the bottom of the Dashboard page, global economic data is reported. Today’s CPI report matched expectations and presented little reason to think inflation is brewing. CPI MM, SA (CPI – Month over month, seasonally adjusted) was down .1% from last month. This is one of the first pieces of so called hard data that will help us confirm if the weak survey data (soft data) that we have recently seen are valid. This is only one data point but does confirm some weakness.
Chairman Powell spoke yesterday and provided little in the way of guidance that we did not know. The only thing worth noting is that he seemed to imply that future balance sheet reductions were probable. This has been a topic he has been wishy-washy on over the past few weeks. In our opinion, this liquidity the Fed is withdrawing from the banking system and the market is a big reason stock prices have faltered in recent months.
Oil rose for a record 10th day in a row yesterday. Optimism over China-US trade talks, hope for Chinese economic stimulus and a weaker dollar are all partially responsible for the nearly 25% increase. However, in context, oil is still down over 23 dollars, or about 33 pct. from its early October high and, like the S&P 500, is reaching an area of multiple resistance. It is likely that oil and the stock market will trade together in the coming weeks. As such it is likely the easy money has been made on the oversold rally and much caution should be applied from here.
January 10, 2019
Update: In our Active Trader section (under Market Data tab) you can see that the Retailers (Macy’s, Kohls, Gap, Target, and Nordstrom) are among the worst performing stocks today. Weaker than expected holiday sales guidance from Macy’s (M) is the culprit.
The market looks to open weaker this morning on concerns that there will be little in the way of progress in the China-US trade debate. Further, the President and Democrats are not making much headway on the Government shutdown. In all fairness, the market has risen almost 6% in this new year so a pullback should be expected, especially as we are reaching multiple points of technical resistance.
European economic data continues to be concerning. France showed a third month of declining industrial production, which follows on the heels of a large decline in German manufacturing. In Asia, China reported a sharp decline in producer prices, which further confirms their economy is weakening.
Chairman Powell will speak today and take questions at 12:45 et. The chairman’s message has fluctuated over the past few months. Today we will pay attention to see he tries to walk back his dovish and market friendly messages from late December. Any divergence back to a hawkish tone would be problematic for the markets.
Yesterday a few subscribers asked why the % of S&P 500 that was overbought or oversold was zero. It is not a model error but in fact there were no stocks, based on our RSI formula, that were in either extreme. Today, as shown below and on the Overview tab, there are 4 pct. oversold and 1pct. overbought.
January 9, 2019
The market rally seems hinged on successful trade talks with China. While better trade relations with China will certainly help the economy we question whether the market is pumping the market up on this news and waiting to dump it once the news is released. As we have discussed the market is approaching a stiff line of technical resistance and severely oversold levels have moderated and in some cases are becoming overbought. We remain very cautious.
The FOMC will release the minutes from the December Fed meeting in which they raised rates 25 basis points. We will be on alert for anything that leads us to believe the Fed is taking a more dovish tack as Chairman Powell seemed to imply in his last speech. Better guidance on the Fed’s stance will be given Thursday when Chairman Powell speaks at the Economics Club in Washington DC.
January 8, 2019
The latest round of trade talks between China and the US end today and we suspect, as does the market, that there will be positive announcements. Does this mean we will have a final trade deal and assuage market fears – highly unlikely. Nonetheless both parties have a vested interest to produce a positive statement and calm down financial markets that are affecting both countries negatively.
We are on alert for the market to continue to run higher on any trade news, but as we often see in markets any news could mark the climax. There is an old adage that says buy the rumor sell the fact. That is our chief concern over the next few days.
The ISM non-manufacturing survey was weaker but provided a bit of good news as new orders were strong. Surveys such as this have been moderately weak in the US and pointing to economic contraction abroad. There is little data this week however corporate earnings for the fourth quarter will start being announced. This week is light with only 43 companies announcing, many of which are not well known. Next week, however, the number more than doubles as a lot of the major banks and a few other larger companies will report.
January 7, 2019
Update: Current thoughts from Lance and Mike : https://www.youtube.com/watch?v=HUAjPsACazU
Fed Chairman Jerome Powell spoke last Friday morning and provided investors a late Christmas gift. He noted the Fed is paying attention to market and that monetary policy should be reflective of activity in the financial markets. This is somewhat of a departure from prior comments in which he seemed to minimize the importance of the recent market decline. More importantly he noted that QT, the act of reducing the Fed’s balance sheet, might be altered if financial conditions warrant. Curiously, only two weeks ago he said QT was on auto-pilot. Clearly the Fed is much more concerned about the recent market drawdown then they were leading on to prior to his new comments. The question we will be focused on going forward is Powell just paying the markets lip service to placate the markets and the President or is he truly concerned? Powell will be speaking this Thursday and will hopefully provide us more clues.
Does Powell’s speech change our opinion on the market? NO
We still think the market has likely entered a bear market and rallies should be used to lighten positions. Our technical thoughts can be found in two current articles in the Articles section below – The New Year Starts with a Rally and Major Market Buy/Sell Review.
January 4, 2019
Update: As we suspected, expect the unexpected. 312k jobs were created in December, almost double that forecasted by a consensus of economists. The data blew away our high end estimate of 250k as well. Importantly, wages and hours worked both increased as follows: weekly hours 34.5 vs 34.4 and earnings .4 vs .2. Both data points are warnings to the Fed that wage pressures remain a concern. On the flip side, the unemployment rose from 3.7 to 3.9. The unemployment rate is considered a lagging indicator and over the last 7 recessions has predictably turned higher within months of a recession. While a change of .2 does not change the trend it is something that we will pay attention to.
Jerome Powell speaks at 10:30. Given the employment data it is likely he maintains his hawkish tone.
The BLS will release the December employment report at 8:30 am. Expectations can be seen in the table below.
The December report is an unusually tough month to forecast for a number of reasons. First a large majority of holiday spending and therefore temporary hiring occurs in December. In recent years economists have struggled to accurately forecast the changing patterns in the way consumers shop and what that means for jobs and sales. Second, the market has gotten mixed messages from other employment reports. ADP, which has a strong predictive track record, showed a large gain of 271k jobs which is 100k more than expected. Challenger reported that 43,844 jobs were lost in December, which, while lower than November, makes 2018 the highest number of jobs lost for the index in three years and second most since 2011. Lastly, the ISM manufacturing survey’s sub-index of employment was weak as noted by the ISM: “December employment for the PMI sample was the softest in 18 months with both production as well as overall optimism at 15-month lows.”
In our opinion payrolls could come in below 100k or as high as 250k. As we have noted in prior comments, employment is being watched closely by the Fed for signs that wages are rising. Keep an eye on hours worked and average hourly earnings for the best indicators of wages in this report.
January 3, 2019
Update: The ISM manufacturers survey dropped from 59.3 to 54.1. The last two times the survey dropped by over 5 points occurred during the recession of 2001 and 2008 as shown.
Shortly after the market closed on Wednesday, Apple (AAPL) shares fell 9% on guidance from the company that fourth quarter revenues would fall short of expectations. The blame is being squarely placed on a marked slowing of sales in China. Nearly 40% of US corporate profits come from abroad, so the warning from Apple should be taken seriously and not thought of as a one off event. Global manufacturing surveys are pointing to economic contraction in large swaths of the world as we have been reporting. Recent surveys from the Richmond, Dallas and Kansas City Federal Reserves point in a similar direction for the domestic economy. While surveys are an important barometer to follow, we are waiting to see “hard” data such as employment tomorrow, CPI and durable goods orders to see if the global economic cooling is working its way to America.
There was more action after the market closed as the currency markets went haywire. Around 6pm and in the period of just a few minutes, the Japanese Yen rallied over 3% versus the US dollar on no apparent news or event. The British pound and Australian dollar also saw large sharp moves. The dollar has since regained about half of its decline against the yen. While a 3% move may seem minor, it is a large move in the currency markets, especially considering there was no news event to accompany it. The currency markets are the most liquid markets in the world so volatility should be followed closely by investors of all types of assets. This activity might be a harbinger of impending volatility in other markets.
The graph below can be found by clicking on the dollar yen currency pair in the FX table below.
January 2, 2019
Update- PMI came in near expectations at 53.8 which, while still signalling economic expansion, points to a cooling of the economy. The following comment was released with the data: “This report as well as a run of regional data from Richmond, Kansas City and especially Dallas all point to trouble for December as the manufacturing sector appears to have ended a very strong year on a very soft note.”
The glimmer of hope the market provided in the last few trading days of 2018 appears to be dimming this morning. S&P futures are currently down 35, following stocks lower in Asia and Europe. The Chinese Caixin manufacturing survey, followed other Chinese surveys in economic contraction. Taiwan further confirmed economic weakness in Asia as two manufacturing indexes fell below 50, also into contraction mode. Maybe most concerning was the decline in growth of South Korean exports. The graph below charts global corporate earnings growth alongside South Korean exports. Needless to say SK exports have been an excellent predictor of earnings over the last decade plus.
In the US, PMI will release its US Manufacturing Index at 9:45 with consensus expecting a slight drop (53.9) from last months reading of 55. Tomorro, ISM will provide a second survey on the state of manufacturing expectations in the US. On Friday, the BLS will release the monthly employment reports. More details will follow on this most important report.
December 31, 2018
Update: The Dallas Fed Manufacturing Index plunged to -5.1 from 17.6. This follows the Richmond and Kansas City Fed indexes showing similar sharp declines. This was the first negative reading in nearly 3 years and the largest decline in the 15 years they have compiled this index.
The market is once again looking to open up about 25 points higher as of 8am. The impetus appears to be a Tweet from Donald Trump saying that trade negotiations with China “are going very well.” Take any discussion of trade with a grain of salt as the market has been fooled numerous times into believing a trade pact was achievable.
Markets are open for a full day but we suspect that liquidity and volume will dry up after lunch time. We suggest any trading be made in the morning.
Of note, last night China released their Purchaser Managing Survey which dipped below 50 for the first time in three years. A reading below 50 means that a majority of those surveyed believes the economy is not expanding. Chinese auto sales were down a staggering 16% for the month of November, the worst reading in seven years.
US surveys are still well above 50 but we suspect they will gradually head towards 50 over the coming months as the global economic slowdown in China as well as Europe and Japan, takes its toll on the economy.
December 28, 2018
Volatility reigns!! After being down more than 60 points the market surged in the final hours to close up over 20. Given light investor participation due to the holidays and the recent behavior of the market we expect the roller coaster to continue into the final days of the year.
Yesterday Consumer Confidence was released and showed a sharper than expected decline. We will stay on top of confidence numbers to see if the recent decline in the market is starting to effect consumer behaviors. The chart of the day shows how the consumer expectations and current conditions have proven to be a good recession indicator.The red line should start rising when expectations starts to decline.
This morning we will get our first glimpse of how purchasing managers are reacting to the market, Fed and government shutdown. Current expectations are 62.4, down from 66.4. This is one of the earliest data points showing economic activity in December.
December 27, 2018
Update: the following graph shows how large upward surges (5% or greater) are hallmarks of bear markets.
The market was up 5-6 percent yesterday in what can only be characterized as a severely oversold market. Volumes were weak on the surge in part due to the holiday season. Despite the run up, the market is technically still showing signs that the decade old bull market has ended. We will have more confidence in that statement once the month ends. In the meantime we should treat this a bear market bounce.
The S&P is looking to give up about 40 points on the open. Traders can consider taking short term speculative positions but with the discipline of stop losses in place. Longer term investors should take advantage of the bounces and reduce their exposure to the market.
On numerous occasions we have written that “volatility begets volatility.” We think that is every bit as true today, if not more so, then it was then. We would not be shocked if yesterday gains were erased entirely today or if the markets added a few percent to yesterday’s gains. Bear markets tend to be much more volatile than bull markets and for that reason hard to trade. Look back at a graph of 2008 and you will see large surges despite the trend which was decidedly downward.
December 26, 2018
Futures are looking promising at 8am with a gain of slightly over 10 points. The market is sitting on critical support, so not only would a bounce be welcome but expected. Following Treasury Secretary Steve Mnuchin’s blunder last weekend he is now on the hot seat. We are currently running a poll on Twitter to see who is more likely to get fired first; Steven Mnuchin or Jerome Powell. With over 500 votes recorded Mnuchin has almost 80% of the votes. To vote please visit Michael Lebowitz’s Twitter account @michaellebowitz
December 24, 2018
The market traded higher overnight on reports that Treasury Secretary Mnuchin had conversations with the CEO’s of the largest banks. Apparently the purpose was to check on the banks liquidity given the government shutdown. We believe Mnuchin, under the urging of Donald Trump, is greatly concerned with the stock market and trying to get these banks to support the market. Actions like this are not new, in fact the beginning sell-off in 1929 was met with massive bank buying that boosted the market for a short period. Inevitably the market is bigger than anyone and it fell precipitously in the months and years that followed. We have little doubt that any rally Mnuchin can muster will be erased.
Rumors this weekend swirled that Trump might fire Jerome Powell. It has since been denied but we have little doubt this is a genuine concern. We will have more on the implications of such an action.
Despite rising almost 30 points overnight, the market is now down about 10 points. Markets will close at 1:30 et due to Christmas Eve.
December 21, 2018
As if the market is not grappling with enough news, we now find out that a government shutdown is looking more likely this afternoon. In the past, shutdowns have not been tough on markets and assuming this only lasts a short time we are not overly concerned. That said, disfunction in government is not something to be bullish about.
The market is greatly oversold and will likely bounce in the coming days. Traders can try to take advantage but we urge discipline and tight stops. Investors should use any bounce as an opportunity to reduce exposure if they are uncomfortable with their current level of risk.
Durable Goods orders disappointed coming in at 0.8 pct versus expectations of 1.4. The revision to Q3 GDP came in a tenth of a percent lower at 3.4.
December 20, 2018
Update: Bill Dudley of the NY Fed has come out in full support of Chairman Powell, adding more credence to his hawkish stance. “TIGHTER FINANCIAL CONDITIONS PROBABLY A NECESSARY THING”
Basically the Fed does not care, at least not yet, about the market’s decline and will tolerate more before considering any action.
Update: The volatility index (VIX) is breaking out on this move lower. As shown volatility stayed in a contained range since October. Today’s move appears to be a breakout higher which signals trouble ahead.
Please read our thoughts on the Fed meeting in yesterday’s commentary. After more deliberation and reading other people thoughts we have come to the conclusion that the Fed is intent on rising rates and reducing their balance sheet further regardless of the stock market. In the words of billionaire investor David Tepper on CNBC – “The Fed Put is dead.” Unlike David, we think the Fed will ride to the rescue of the market but it may not occur until the market drops significantly further. This is very different from the behavior of Jerome Powell’s three predecessors and will cause much anxiety.
Despite the seemingly hawkish Fed stance, the market may rally to close the year but we think the market will continue to trend lower and push the Fed. Ultimately the Fed will cave but it may not occur to a recession is all but imminent and the stock market is another 10-25% lower. As we have stated for the last few weeks, use rallies to reduce risk and please understand bear market rallies can be incredibly strong. Do not fall into the trap that these surges are the resurgence of the bull market until the technical situation improves. We will let you know if that were to happen.
If you have any economic/market questions please send them to us and we will answer them directly or if appropriate answer them in this forum for all to read.
December 19, 2018
FED UPDATE: In this press conference, Chairman Powell said balance sheet normalization (QT) is on auto-pilot. This tells us they are not even considering changing the amount of their balance sheet that rolls off each month. This is a big problem for the market that is so dependent on liquidity.
FED UPDATE: The following Fed statement from September as we showed yesterday is updated below. The orange text highlights any additional language.
“Consistent with its statutory mandate, the Committee seeks to foster maximum employment and price stability. The Committee expects judges that somefurther gradual increases in the target range for the federal funds rate will be consistent with sustained expansion of economic activity, strong labor market conditions, and inflation near the Committee’s symmetric 2 percent objective over the medium term. The committee judges thatRisks to the economic outlook appear roughly balanced, but will continue to monitor global economic and financial developments and assess their implications for the economic outlook.“
First they added the worded “some” to describe further gradual rate increases. This appears to be a first step in lowering expectations for future rate hikes.
Second and more importantly, the addition to the last sentence of the paragraph. They are telling us that slowing global growth and volatility in the financial markets will play a larger role in the way the Fed thinks about monetary policy going forward.
The statement as a whole is more dovish than the last one, but we are not so sure it as dovish as the market was hoping. Currently the market is 30 points off its highs. We will stay tuned for any telling comments from the press conference.
The S&P 500 is currently up about ten points as traders anxiously await the results of the Fed meeting at 2:00pm et and the ensuing press conference. Given that the S&P has dropped by almost 10% this month alone and technical readings are very oversold short term, we think the odds favor a surge higher this afternoon. That said, it could easily continue its recent downward trend if the Fed appears to show little concern for recent market moves. We will likely reduce equity positions today or over the coming days if a surge occurs.
We will post Fed updates later today based on the days events. Yesterday we published our thoughts on the Fed meeting in the Articles section. It’s worth a quick read before the meeting.
Italy appears to have a budget deal with the EU. That should provide a little strength to the euro and alleviate broader market fears in Europe.
If you have any economic/market questions please send them to us and we will answer them directly or if appropriate answer them in this forum for all to read.
December 18, 2018
The two-day Federal Reserve monetary policy meeting starts today with their statement, press conference and any changes to policy (Fed Funds) occurring tomorrow afternoon. Later this morning we will release an article with our thoughts on how a hawkish or dovish tone might affect the markets.
As is customary the Fed will adjust the prior statement from the September meeting with some edits. It is those slight changes in vocabulary and phrasing that will be studied carefully for clues on the Fed’s thinking. We believe possible changes to the second paragraph holds the most weight. The paragraph from September reads as follows:
“Consistent with its statutory mandate, the Committee seeks to foster maximum employment and price stability. The Committee expects that further gradual increases in the target range for the federal funds rate will be consistent with sustained expansion of economic activity, strong labor market conditions, and inflation near the Committee’s symmetric 2 percent objective over the medium term. Risks to the economic outlook appear roughly balanced.”
Any changes to the two bolded statements will likely be paramount to understanding if indeed the Fed is pivoting to a more dovish stance.
The entire statement from September can be read here – https://www.federalreserve.gov/newsevents/pressreleases/monetary20180926a.htm
December 17, 2018
Update: The National Association of Home Builders Housing Market Index was considerably weaker than expectations. The index now stands at 56, down 4 from last month and 12 from two months ago. This was the worst back-to-back change since 2001 and second worst on record.
The pre-Christmas week is usually quiet and tends to have an upward bias. This week, however, appears to be less predictable. The market is sitting at critical support, which if it breaks could result in another downswing of 4-5%. If support can hold there is plenty of ability to move higher an equal amount.
The Fed will meet Tuesday and Wednesday with a 25bps rate hike expected by the market. More importantly will be the tone of the FOMC minutes and importantly Chairman Powell’s press conference that afternoon. Given his speech two weeks ago, the market and ourselves are expecting a dovish tone. If this is the case the market may jump higher. We urge caution however and ask that you consider selling into a surge as it may be a good opportunity to reduce risk. We will provide commentary on the minutes and his press conference on Wednesday.
December 14, 2018
Update: The US dollar is up this morning and now stands at one year highs. A strong dollar has an adverse affect on foreign dollar borrowers as they must pay back principal and interest in more expensive dollars. A stronger dollar is another form of liquidity drainage.
The German Central Bank cut their 2018 GDP to 1.5 percent from 2 percent and next years forecast from 1.9 to 1.6. This is yet another sign that Europe is slowing quickly. The news out of China was not any better. Retail Sales grew at 8.1 percent, year over year, which is the slowest rate in fifteen years. Industrial Output also slowed considerably.
Economic growth is slowing as the Fed is removing dollar liquidity. The world runs on dollars. As dollars are removed from the system credit necessarily shrinks and typically foreign economies feel the pinch first.
Consider this- There is an increasing probability of a global recession and at the same time central bank rates in Europe and Japan are at zero and only 2.25% in the United States. There is little to no room to cut rates. This is a very important oft overlooked theme we will continue to harp on if it becomes more likely a recession is coming.
December 13, 2018
Update: ECB CONFIRMS IT WILL HALT ITS ASSET-PURCHASE PROGRAM. This headline from the European Central Bank is further confirmation that global liquidity will decline for the first time since the financial crisis. This first time confirmation is not an asset-friendly headline although markets are not reacting to it yet as it has been rumored for weeks.
From yesterday’s commentary “Expect the roller coaster to continue and volatility to force the squeamish out of trading positions.” And that is exactly what happened yet again on Wednesday. S&P futures rose from a low of 2629 at 4am in the morning to 2685 at 1:30pm. Following what seems like a daily script, it then fell about 35 points into the close for a small gain. When looking at a candle chart, the last three days have long tails and short bodies, meaning they have traded in wide ranges but closed very close to the open. Considering the market is exhibiting such strong signs of indecision, extra caution should be applied to short term trading positions. The market could easily rally to the top of the range as we suspect. On the same hand, a break lower could snowball to the downside. We strongly suggest tight stops on all short term trading.
On the data front we are looking towards today’s jobless claims to see if the recent uptick is a trend or just a short term anomaly. The market is expecting 228 k, down 3k from last week. More importantly retail sales will be released tomorrow. The Fed will closely inspect this number to help gauge the financial health of the consumer.
The following commentary from Peter Boockvar is very important to understand and is a primary reason why we think the trade war is a side show and the Fed and a global economic slowdown are the main acts that are driving stock prices lower.
“Let’s be clear- China lowering the tariff on US autos to 15% from 40% just puts the rate to where it was before July. And China buying more soybeans is what they were doing before they completely stopped. In other words, this is only optics so far.”
December 12, 2018
“Deja Vu all over again”- In the words of baseball great Yogi Berra, the market is opening higher on the same rumors that propelled it higher yesterday and many mornings before. A trade deal with China is looking more probable, Italy is making concession to ease its rift with the EU and Theresa May all of a sudden is much closer to a BREXIT deal that will pass Parliment.
Expect the roller coaster to continue and volatility to force the squeamish out of trading positions.
For those of you putting trust and faith in the Fed for your investment returns please consider the following:
December 11, 2018
The S&P is currently about 25 points stronger on news that China will reduce or eliminate tariffs of US automobiles. While this is a good sign of progression in China-US trade talks, we remind you the market is facing two other strong headwinds. First is slowing economic growth abroad and signs that domestic growth is starting to slow as well. Second is the Federal Reserve is removing 50 billion of liquidity from the markets every month. In our opinion trade matters but the other two headwinds are far more important.
Yesterday the market was extremely volatile. It pushed on and broke the lower end of the range we discussed in the Portfolio Alerts. We are concerned but waiting to reduce risk until the break occurs on a weekly basis and better confirms the market is heading lower. On Monday the S&P ended up 5 points but intraday came within two points of the closing lows from the beginning of the year. The bounce and today’s current follow through may provide a push for more gains especially considering seasonal factors favor a rally into Christmas. The rally’s are tradeable, with tight stop losses, we view them ultimately as opportunities to reduce risk.
December 10, 2018
The stock market is opening slightly weaker on a plethora of concerning headlines including:
Japan sharply revised lower their recent GDP to -2.5 pct from -1.2pct. Other Japanese data was weaker as well
Prime Minister May continues to move forward on a BREXIT vote that appears doomed to fail
Weaker trade and inflation data from China
French protests continued over the weekend
Chief of Staff Kelly is resigning
Huawei ordeal continues to grow raising concerns about a US-China Trade deal
None of these are overly concerning on their own but the sheer number of negative events is likely to weigh on equity markets here and abroad. We suspect U.S. Treasury bonds will continue to perform well. Pay close attention to shorter 2 and 3 -yr yields for signs that the market thinks the Fed rate hikes come to an end after their planned December hike.
December 7, 2018
Update: The payrolls number was weak at 155K vs an expected 190K. Hourly earnings and hours worked were also weak, coming in a tenth of a percent below exceptions. The case is clearly building for a much more dovish tone when the Fed meets in three weeks.
Yesterdays rally from 60 point lows to closing nearly flat was sponsored by the following Wall Street Journal headline- Fed officials may signal a ‘wait-and-see’ approach following rate increase this month. The bottom line is that the Fed is getting nervous about stock market conditions. This was evident in Powell’s and Clarida’s speeches last week, (reviews of the speeches in the Articles section below) as well as media trial balloons hinting at pause that appeared in the days before their respective speeches.
The table below contains expectations for today’s Employment report. This will be the most closely watched economic data point for the month of December as it will help the market further consider the future path of the Fed.
December 6, 2018
Update: In the latest Cartography Corner (Articles and Videos section) Brett Freeze provided guidance on trading levels for the S&P 500. He wrote- Active traders can use 2818.00 as the upside pivot, whereby they maintain a long position above that level. Active traders can use 2691.25 as the downside pivot, whereby they maintain a flat or short position below it.
The high on Monday morning (2811) never breached the upside pivot. Since then it has collapsed to 2628 (currently). Following his advice would have thus far resulted in a 63 point gain and importantly helped avoid the bullish impulse to buy when the market looked strong on Monday morning.
We also remind you of the following quote from the same article- We want to stress the point that if the S&P futures close the month of December below 2742.72, the market is providing a strong signal that the nine-year-old bull market may likely be in jeopardy.
The market opened poorly last night on the following headline- *CANADA ARRESTED HUAWEI’S CFO AT REQUEST OF U.S. AUTHORITIES. More details are in the Portfolio Alerts to the right.
“We will be paying very close attention to what incoming economic and financial data are telling us.” Fed Reserve Chairman Jerome Powell
“At this stage of the interest rate cycle, I believe it will be especially important to monitor a wide range of data as we continually assess and calibrate whether the path for the policy rate is consistent with meeting our dual-mandate objectives on a sustained basis.” Vice Chairman Richard Clarida
The two quotes above, which we highlighted in our reviews of their most recent speeches, talk to Fed new “Data Dependency.” In other words, Fed policy and the question of raising rates further will be much more dependent on economic data in the days, weeks and months ahead. With that as a back drop there is a large amount of important economic data coming out today and tomorrow. The data schedule, expectations and actual data points can be found towards the bottom of the Dashboard page. We believe the following are the most important to follow in regards to clues about Fed policy:
Thursday-
ADP Employment- Good proxy for Friday’s BLS Employment report
Jobless Claims- It has ticked up in recent weeks and we are curious if this is a new trend.
PMI and ISM non-manufacturing surveys- Look for clues in regards to forward looking orders and prices
Friday-
Employment- This is the most important piece of data for the month of November. In addition to the unemployment rate, hours worked and average hourly earnings are key data points the Fed is following. We caution that employment data for November can be volatile based on where Thanksgiving falls within the month and the number of ensuing holiday shopping days. The weather in November through March can also create odd hiring patterns.
December 5, 2018
Reminder: US markets are closed today.
The significant equity rally following Powell’s dovish speech and the “truce” with China were largely erased with yesterdays 800 point DJIA sell-off. The yield curve continues to flatten and warn that economic growth is slowing. Growth concerns are also showing up in the widening yield spread between investment grade corporate debt (LQD) and US Treasuries. As shown below the price of LQD is flat for the last month, while IEF is up about 4%. Said differently, the benefits of lower yields are not accruing to investment-grade corporations. We will post our monthly fixed income summary shortly which will go much further into yield and spread dynamics from the month of November.
December 4, 2018
Update- The yield curve flattening and stock market weakness are feeding off each other. Currently the 2s/10s curve is down to 10basis points and the 2s/5s curve is now inverted by 3 basis points.
It is often said that investors should follow the bond market, not the stock market for economic signals. Well, the bond market appears to be screaming that economic growth is slowing. We have documented slowing growth abroad, and now there are increasingly more signs that a domestic slowdown is coming. For instance, Ford, following GM’s lead, announced significant layoffs yesterday. There is a slew of economic data scheduled for Thursday and Friday to lend credence, or not, to the machinations of the bond market. We remind you the market is closed tomorrow in honor of George Bush.
U.S. Treasury yields curves began to invert yesterday as longer yields fell and short term yields rose. Yield curve inversions tend to be a prescient, albeit early, warning of recession. The last inversion preceded the financial crisis. The 3yr/5yr curve is now inverted and the more widely followed 2yr/5yr is at zero. The most popular yield curve, 2yr/10yr, stands at a cycle low 14 basis points. Frequently, and as we are now seeing, shorter term curves invert first and tend to be a precursor for the longer curves.
December 3, 2018
Update- David Rosenberg, whom we highly respect, penned the following article in which he disagrees with our recent take on Powell’s speech from last week.
The “deal” agreed upon this past weekend with China is more of an agreement, or even truce that ensure negotiations continue. While not the deal that the White House has been dangling in front of the markets, it does appear to offer hope and certainly averts an all out trade war for the time being. Essentially, China and the US will continue to negotiate for 3 more months with no new tariff actions. China also agreed to increase their purchases of US agricultural goods and some other commodities. Please see our Chart of the Day.
Stocks are flying out of the gate as the worst case scenario was averted. There is almost certainly some short covering occurring as there were plenty of investors with hedges that now need to be covered. Bonds are drifting higher in yield but remain well below the highs of two months ago.
There is lot of economic data this week, as shown, capped off with the much important employment report on Friday. Note that markets will close Wednesday in honor of the passing of George Bush.
November 30, 2018
Update- Add Canada to the list of global economic concerns. They just reported a .10 percent decline in GDP growth.
Global economic growth continues to show signs of marked slowing. Last night Italy joined Germany, Switzerland and Japan in posting a negative GDP growth number for the most recent quarter. Further, China’s PMI manufacturing survey registered a 50.0 which means it is on the brink of contraction according to that widely followed measure. We believe part of the recent switch to a more dovish tone from the Fed emanates from the global economy. In most cases, the stronger dollar and higher US interest rates are making dollar denominated debt tougher to service and pay back which is adding to weakness abroad.
The G-20 meeting kicks of today. The big highlight will be dinner tomorrow night between Xi and Trump. We have no doubt the market will be chock full of rumors today which may result in significant volatility.
November 29, 2018
The market shot higher on comments from Fed Chairman Jerome Powell. Please see our review of his speech and that of his Vice Chair in the Latest Articles section below. The following line from the Powell review sums up the rationale behind the market’s euphoria: He states that “interest rates are still low by historical standards” and “remain just below” what they would consider neutral for the economy. The phrasing “remain just below” is the key line from the speech as it was only a month ago, on October 3rd, when he said they were a “long way” from neutral. In no uncertain terms, this abrupt change in posture is a clear signal to the market that the Fed may be close to ending their hiking cycle.
This morning jobless claims came in at 234k versus estimates of 220k. While still a historically low number, it has risen over the past two months from a low of 202k. This is not yet a concern, but a trend that bears watching.
Also on the slate this morning is the PCE price index. This inflation measure, and not CPI, is the Fed’s preferred indicator of inflation. The index came in at 2 percent yoy versus expectations of 2.1 percent yoy.
The bottom line from both reports is that employment is weakening slightly and inflationary pressures are subdued. Given the data dependency of the Fed, these reports support a more dovish tone from the Fed. Keep in mind these are only 2 reports and we must be careful not to read too much into them.
November 28, 2018
The market is once again opening strong on optimism a trade deal will be struck with China.
Fed Chairman Powell speaks today at noon at the Economic Club of New York. Like Clarida’s speech yesterday, we believe there is growing importance to deciphering Fed speeches for signs that the Fed is turning to a more dovish stance. Interestingly, Trump had more disparaging words about Powell last night and rumor has it that Treasury Secretary Mnuchin paid a personal visit to the Chairman to lobby for a more dovish posture. If Powell discusses monetary policy, as the market is expecting, we will provide a summary as we did yesterday with Clarida’s speech.
On Friday the G-20 will meet. While much will be discussed, the market will likely focus on China-US trade relations. There is a lot of “chatter” from Chinese President Jingping Xi and President Trump, much of which is posturing and bluffing ahead of negotiations. As we have seen the market looks very kindly upon rumors that a trade deal is nearing with China. Conversely, if it looks like a deal is not possible the market will decline. The rumors and associated volatility will make trading precarious until the meeting is over.
November 27, 2018
Update- Please see our latest RIA Pro article which reviews Clarida’s speech from this morning.
Over the next few weeks the Fed has the opportunity to back down from their hawkish narrative. As we have discussed, rumors are cropping up that come springtime, the Fed could halt rate hikes and/or balance sheet reduction. If this is the case, we are on the lookout for important clues from Vice Chairman Clarida, speaking this morning and from Chairman Powell tomorrow. Here are a few things that we are looking for:
A discussion of lower oil prices and how that may relieve inflationary pressures
Any signs of slowing economic growth in the US.
With Germany and Japan printing negative GDP in the last quarter, is there a broader concern slowing global growth will harm US growth.
Do they mention the recent decline in stock prices
China and trade war
Apple is trading down another 2% as the most recent round of tariff threats were aimed directly at Apple. The stock is currently trading around 171, down over 50 points from its October 3rd high.
November 26, 2018
After an ugly week where stocks could not seem to gain any ground, the markets are opening up strong. Led by optimism over a BREXIT deal and potential Italian budget compromise, European stocks are stronger. As mentioned last week, the rumor mill is reporting that the Fed may take a pause in their hiking of rates in the spring. This week Jerome Powell and a host of other Fed members will speak. These speeches are important to follow for signs that the rumors are true.
If the rumors are true a bullish and bearish case can easily be made. On the bearish side, we should consider what the Fed seeing that is so bad that they feel they have to halt rate increases? On the bullish side, Fed dovishness has been associated with strong gains. We will keep updating on this topic and provide our analysis as it is very important.
November 23, 2018
Wednesday’s gain on rumors that the Fed may be suspending their rate hike cycle do not seem to be believed by the markets. Stocks are looking to open down about ten which would erase Wednesday’s gains.
Crude oil is down sharply to 52/barrel as Saudi Arabia has claimed to increase production. While many economists will tell you that lower gas prices are good for the economy, they fail to discuss other economic implications. We will have more on this on Monday.
Europe is also struggling as recent manufacturing surveys point to economic weakness. Stocks will close at 1pm and bonds at 2pm today due to the Thanksgiving Holiday.
November 21, 2018
As noted in the Portfolio Commentary section, we did some tax loss harvesting yesterday as multiple positions were stopped out.
With the market extremely oversold on a short-term basis, and given the market is only open for one-half of the normal trading session, an oversold bounce is likely. However, with multiple “sell signals” in place the downside risk still outweighs the upside reward on a near-term basis.
As we wrap up the Thanksgiving holiday, we will move into the end of the year and all eyes will turn their focus to two things – the Fed and the economic data.
This morning, a “trial balloon” was floated, and futures are up, as Market News International reported that the Federal Reserve is starting to consider at least a pause to its gradual monetary tightening and could end its cycle of interest rate hikes as early as the spring, citing senior people at the Fed they didn’t identify.
While a Dec. rate hike is all but assured, the debate will become more lively beginning at the central bank’s March meeting and certainly by June. The issue, of course, remains a Jerome Powell who is intent on continuing to lift rates into 2019 and the Fed’s own dot plot suggests there will be at least 3 hikes in 2019. So, this “trial balloon” to stabilize the markets is likely just that and will provide an opportunity to reduce risk further in the weeks ahead.
It also suggests that for one or more Fed presidents to engage in such an ECB-esque trial balloon in defiance of Chairman Powell means disagreements within the FOMC over the future of monetary policy are beginning to boil over.
November 20, 2018
Quiet and calm as we expected for pre-Thanksgiving trading is not what the market is serving us. Target shares are looking to open nearly 10% lower on weaker than expected earnings and a downgrade of Q4 estimates. Target, following on the heels of Amazon, is clearly a strong warning that consumer spending is weakening. Recently, Target CEO Cornell said this is the “best consumer environment ever.” Either the environment is rapidly deteriorating or Cornell is out of touch with broader economic trends. We remind you that much of the fiscal stimulus driving economic growth is wearing off. The following graph helps illustrate this.
Treasury bond yields continue to grind lower with the ten-year now at 3.05 percent or about 20 basis points lower than its recent 3.25 high. Corporate bonds, both investment grade and junk, are rising in yield and therefore spread to US Treasuries. For more information about Corporate bond trends see our latest monthly commentary. A deeper dive into the junk bond sector can be found here – https://simplevisorins.wpengine.com/high-risk-in-high-yield/
November 19, 2018
This should be a quiet week due to the Thanksgiving holiday. We suspect that volatility will calm down this week but given the price action of the last month and the lack of liquidity we must be on guard for bigger moves. If you share our increasingly concerning outlook, as noted in the portfolio commentary, the next few days may provide outsized bounces allowing you to shed some risk.
Fed Governor John Williams speaks on three occasions today. We will focus on whether he believes the Fed will maintain their hawkish posture or the recent decline in oil and slowing growth abroad may alter their outlook.
Also of note Apple slashed production orders on iPhones, BREXIT negotiations remain elusive, and China trade talks appear to be growing more confrontational. The latter two have the ability to roil the global markets if they continue.
November 16, 2018
Markets look to open weaker this morning, giving back a good portion of yesterdays gains. One growing concern appears to be based on fears that terms for a “clean” BREXIT are diminished. Following trading on the British pound provides indications of market sentiment revolving around BREXIT.
Also of note Nvidia (NVDA) is trading down along with the semi-conductor sector on poor earnings and a lower revenue outlook. Despite the market being higher by almost 1 percent yesterday, Walmart (WMT) traded lower on weaker revenues and concerns about future revenue growth. Such concerns aren’t limited to those two companies. Apple and Amazon offered similar warnings a few weeks ago. Corporations have the best real-time data on sales trends. Based on many fourth quarter forecasts we have increased concerns that the consumer may hamper economic growth. Personal consumption accounts for nearly 70 percent of GDP.
November 15, 2018
Bond yields have quietly declined over the past week. Currently the ten-year U.S. Treasury yield stands at 3.09, down from recent highs of 3.25 percent. The sharp decline in the price of oil is likely the culprit. Oil is a key component in many products and involved in the manufacturing and shipping of the products. Given the 30% decline of crude oil as highlighted in yesterdays commentary, the Fed’s inflationary concerns should be lessened. We need to keep an ear out for Fed speakers and any discussion of oil and inflation. Any signs that the Fed will adapt a more dovish stance should bode well for bonds.
November 14, 2018
Update- SWN– Natural gas has risen significantly over the prior month on increasing signs of a cold winter. If you bought shares of SWN based on our article we recommend taking advantage of this opportunity and selling a fraction of your position. Today’s 10% gain in natural gas is likely based on short covering and not fundamental expectations, therefore natural gas and SWN will likely become extremely volatilite in the coming days.
On the economic calendar Fed Chairman Jerome Powell speaks at 5pm ET and CPI is released at 8:30et. Consensus is for a year over year rate of 2.5 percent. Given the recent drop in the price of oil that will not be entirely picked up by this release, this number may be considered less important than it otherwise would have been.
Overnight, Germany and Japan both released negative quarterly GDP data, confirming that global growth is slowing. Please see the Chart of The Day.
Yesterday crude oil had it biggest daily loss (7.1%) in over three years. Since early October Crude oil has dropped over 35 percent, from 77/barrel to 55/barrel. Having broken through all pertinent moving averages and the two year trend line (orange), the range highlighted by the yellow bar (55-42.5) should provide support. Further the RSI now stands at its lowest level in decades, another sign we should see support soon, even if it is only temporary. From Bespoke Investments: This is the fastest that crude oil has gone from a 52-week high to a 52-week low (30 trading days) since at least 1984.
From a macroeconomic perspective oil is sending us a strong message about economic weakness in the global economy. Might the decline in oil also be signalling emerging weakness in the US economy?
November 13, 2018
Update: After rising 25 points this morning, the S&P is now red on the day. The half-life of China trade rumors is becoming markedly shorter and shorter. Further concerning, oil is down 7% on the day.
In what appears to be a recurring theme, a “phone call” and renewed hopes for a trade deal with China occurred last night after a large market sell-off. Not surprisingly overnight investors took the bait and the S&P is currently up about 15 points. Like the boy crying wolf, either a wolf in the form of a trade deal occurs or the market will simply ignore the false hope.
It is worth reminding you that the Fed is reducing their balance sheet at a rate of 50 billion a month. The current pace is the equivalent of raising interest rates by 6 basis points a month or nearly 20 basis points per quarter. The Fed is also increasing the Fed Funds rate by about 25 basis points a quarter. The takeaway is that the Fed is removing more liquidity from the markets than most investors realize. This will apply a constant source of downward pressure to the markets.
November 12, 2018
Stocks have been gyrating since futures opened up last night. Currently the S&P looks to open down about 8 points. The dollar remains strong on concerns over a failure for a BREXIT deal and the inability of Italy and the EU to come to an agreement on Italy’s budget. Couple those concerns with general weakness in Europe’s economy and the recipe for a stronger dollar versus the pound and the euro could continue.
Bond markets are closed for Veterans day but stocks will be open. We expect light volume although the lessened liquidity may drive volatility. There is little on the economic docket until Thursday when Retail Sales is released. Fed Chairman Jerome Powell will be speaking on Wednesday afternoon.
November 9, 2018
Stocks are looking to open weaker as the dollar resumed it assent. The move last night is based on weak China economic data. Also of note, crude oil slipped below 60/barrel, having been above 75 less than a month ago. We believe that global growth is slowing at a rapid pace and having a big effect on the demand for oil. Over 40 percent of S&P 500 earnings come from abroad so signs of global weakness should be followed closely.
The FOMC left rates unchanged yesterday and for the most part left their statement intact from the prior meeting. While seemingly meaningless there are two important takeaways:
The Fed and Chairman Powell appear to not be backing down from Trump’s direct statements to Mr. Powell about raising rates. This tells us Powell holds the independence of the Fed in a strong light.
Despite a nearly 10% decline in stock prices, the Fed didn’t mention the market. Might we finally have a Fed that understands their congressional mandate is for stable prices and full employment? The so called third mandate of strong asset markets and the follow through wealth effect do not appear to be part of Powell’s agenda- at least not yet.
November 8, 2018
Yesterday’s stock market rally, on the heels of the election, was breathtaking, however we remain very concerned this is still a bounce within a lower trend. One hint is volume. Despite the bullish tone emanating from the media volume has weakened on each consecutive day of this rally. From a fundamental and market perspective we think the cons of a split house outweigh the positives. For instance trade tariffs and trade wars will still occur as those actions are primarily left to executive order. Trade agreements must be agreed upon by Congress. Fiscal stimulus in the form of further tax cuts is not going to happen. While an infrastructure bill is still possible it will probably come with concessions such as rescinding part of the corporate tax cut. Lastly, as we have already seen, expect the non-constructive political war of words to heat up.
At 2pm this afternoon the Fed will most likely keep the Fed Funds rate on hold. The market has expectations for a hike at the next meeting in December. While largely unexpected, a hike today would be a strong signal to the market that the Fed is concerned about inflationary pressures rising.
November 7, 2018
Stocks are surging and the dollar is weaker on the Democrats taking the house. At first blush it appears investors are cheering gridlock and its implications. As we discussed yesterday a split means “additional fiscal stimulus is less likely.” Our only guess at this point is the market now believes the Fed might take on a less hawkish tone. On the flip side, it was Trump’s pro-growth policies that drove the market higher over the last two years.
Currently, we are questioning the markets first reaction. Over the next few days we will have to see if the gains can hold and if they change the technical outlook to a more bullish one. Until then be very careful of a market head-fake, similar to what we saw on two years ago when the market was down significantly in the first Hours of Trump’s victory.
November 6, 2018
“Vote for the man who promises least; he’ll be the least disappointing.” – Bernard Baruch
Update 2: Please see our election night Election Night Cheat Sheet in the Articles and Videos section.
Update 1: Crude oil is down by well over 1.50 today and off 16 from it highs in early October. Supply side sanctions on Iran are certainly playing a role in the drop, but we must also consider that demand might be lessening significantly given slowing global growth. While oils weakness is not a definitive sign US growth is slowing, it bears watching closely.
With two big events on the horizon we suspect the market will be relatively quiet today. Election results should start streaming in by 7pm et, but it could be a while before it is known which party controls the house and senate. Later today we will be putting out a cheat sheet with our expectations on the short and long term market implications of the various leadership options.
On Wednesday the FOMC begins their two day meeting. Currently the market is implying a 15 percent chance that the Fed raises rates. Consensus is for a rate hike in December, therefore a move on Thursday would come as a shock to the market. While the economic impact of a November rate hike, as compared to December is minimal, the messaging effect is massive. If that does indeed occur the stock market would likely trade lower, possibly significantly lower. We remind you though the chances of that occurring are small.
November 5, 2018
After trading lower throughout the night the market rallied back and looks to open flat to slightly higher. The election will take center stage with many traders trying to re-position before the results are announced Tuesday night. It is unclear to us how the results might affect the markets. We simply remind you that a Trump victory in 2016 was supposed to cost the markets dearly. It did for a few hours and has done nothing but go upwards since.
November 2, 2018
The market traded off after the close on lackluster forward guidance from Apple. Apple said it expects its midpoint revenue to be 91billion versus the prior estimate of 92.74billion. The sell-off did not last long as rumors circulated once again that a trade deal with China is possible in the weeks ahead. The S&P Futures were up about 25 at their highs before the employment number. Half of that gain has since eroded.
As shown below the jobs data for October were strong with 250k new jobs, rising participation rate and a bump up in the year over year hourly earnings. While cause for celebration this also means the Fed will likely not back down from future rate hikes. Of note, and we should pay close attention, the market is beginning to put 20% odds on a hike in November. Prior to today, implied market levels pointed to December as the next hike.
November 1, 2018
The market is looking to open up stronger again. Yesterdays gains were partially erased in the afternoon and interestingly small-caps stocks (IJR) ended the day flat to slightly lower. Might this be a sign the bounce is nearing its conclusion? We are looking to take action on market strength to reduce our exposure as noted in the portfolio commentary.
Challenger Job Cuts jumped this morning surged from 55k to 75k. The jump is largely blamed on Verizon and Sears. This is the second large monthly jump in a row. It bears watching to see if this is a trend or just one-off large cuts from specific employers.
Market bellwether Apple (AAPL) will release earnings after the close. The current expectation is for earnings of 2.79 per share. AAPL has held up much better in this recent downturn then its compatriots in FAANG (FB, AMZN, NFLX, and GOOG) making today’s release that much more interesting.
October 31, 2018
Happy Halloween!!
The S&P is looking to open up by about 25 points, following the impressive gains yesterday. As we have said in our technical updates the market is/was greatly oversold. We believe this is a time to exhibit some discipline and if you are looking to reduce risk, pinpoint those levels and take action. We think this rally could run to as high 2750 or even 2800. We will likely reduce risk further on market gains.
The ADP Jobs report this morning came in at 227,000 vs expectations of 189,000. The full economic calendar for the US and other major economies can be found on the Dashboard page beneath the currency rates. The current expectation for the Friday report is a gain of 190,000 jobs.
Below are a couple quotes that are worth consideration. For the record we agree with Kevin.
“US stocks fell off a cliff after Oct 3. Today the 30 year Treasury yield closed at 3.364. On Oct 3 it closed at 3.336“. – Jeff Gundlach
“Until the bond guys get worried and the bond lady sings, this correction isn’t over” -Kevin O’Leary
October 30, 2018
The S&P 500 was up overnight on renewed hopes for a China trade deal. While we have no doubts that Trump would love a trade victory before next week’s mid-term election, we believe both sides remain pretty far apart. Currently, the S&P 500 is up 8 points, but given the extreme volatility of the last few weeks, this could evaporate or multiply in minutes.
Europe’s GDP grew .02% (0.8% annualized) in the last quarter providing further evidence that the global economy is slowing.
October 29, 2018
Update: The market, after being up nearly 50 points, has completely erased the gains and is down over 35 points. The following graph provides a range where support should come in. If we fall through those levels the decline could intensify.
This will be a quiet week as far as economic data goes. On Thursday the PMI and ISM manufacturing indexes will be released. While survey’s and not actual data, they tend to be of the more forward looking data. On Friday the BLS will release the employment report.
Equities are opening up stronger this morning despite little news to warrant the jump. Conditions are oversold and corporations are ending their buyback blackout periods which should help demand on he margin. Please keep an eye on Portfolio Alerts for information on our latest actions and thoughts regards our portfolios.
October 26, 2018
Update 1: GDP came in at 3.5 vs 3.3 as expected. The graph below shows the two main culprits accounting for the deceleration of growth from Q2 were related to trade and tariffs. Per Ernie Tedeschi “You can tell an easy tariffs story here: firms were pining to get inventory out the door in Q2 to beat the tariffs, now exports have decelerated but firms are building up inventory again, and a bit more hesitant to invest thanks to trade uncertainty.”
The S&P has given up yesterday’s impressive rally on the heels of poor, after hours earnings data from Amazon (AMZN) and Google (GOOG). Both companies announced larger than expected gains in earnings but disappointing revenue numbers. Revenue tends to be more indicative of a company’s future earnings potential as they represent true sales. Earnings can fluctuate based on a large number of factors such as recent changes in the tax code. Investors in AMZN and GOOG are clearly concerned as both stocks opened the after hours sessions down over 5%. For those that do not own either slowing sales should be noted. AMZN also lowered their Q4 guidance by 5-6%. Given their prominence in the retail sector, this may be an omen worth following in regards to holiday related retail sales.
While the media will certainly blame AMZN and GOOG for any sort of sell-off today, the truth of the matter, and as we have alluded, something is breaking. The next two important technical levels to watch for are the intra-day low (2532) and closing low (2581) of the first quarter. On the upside, a rally up to 2750 would present an opportune time to reduce risk.
Please see our Chart of the Day and commentary beneath it for guidance on what lies beneath the lows mentioned above.
October 25, 2018
The market is opening up stronger this morning after yesterday’s sell-off. Despite the 3% drop in the S&P and 4.6% fall in the NASDAQ the volatility index (VIX) is not surging as much as we would expect. Currently it stands at 25 as compared to nearly 50 during the January decline. While only one tool, we must remain cautious as this is telling us the market may not have exhausted itself to downside for this current wave.
Deutsche Bank (DB), a large German bank, continues to fall from grace. As shown below, its stock price stands at its lowest levels since it was listed on the NYSE. While DB may only have a market cap equal to Twitter, it is a major counterparty to all large banks and, as such, has the ability to disrupt the global financial system. Think Lehman Brothers…
October 24, 2018
Update 1: Housing data and revisions to old data continue to weaken.
“Volatility begets volatility”
The famous Wall Street saying is very appropriate today. As the saying states, periods of volatility frequently induce greater levels of volatility. Increasing periods of heightened volatility are frequently a signal, like earthquake tremors, that a larger move is needed to relieve the pressure.
We have not seen any signs that this bout of volatility is ready to cool off. Yesterday, for example, a 60 point morning stumble was nearly fully recovered by 3pm and last night a 1% decline was reversed entirely by 8am. While the buy-the-dip is working in both instances the market is still moving lower net-net and further away from critical support.
Please read yesterday’s portfolio commentary and our article “Dissecting This Selloff” for our technical thoughts and trading actions regarding the equity markets.
The market may be simply consolidating but importantly it may be signalling that a topping process is in motion. If the latter, investors should be thinking about opportune times to reduce risk.
October 23, 2018
*We are aware of the problem of viewing the Dashboard page on some mobile devices and working to fix it as soon as possible.
Update 1: 2690-2700 is proving to be temporary support for the market. We are working on a short article showing why this recent decline is different from that which occurred earlier in the year and what that may portend. It will be out this afternoon.
The S&P 500 has been bouncing off of 2755/2760 for the better of the last week. Last night it gave up that support, and has traded poorly ever since. Stocks around the world are lower with China giving up its gains discussed yesterday.
This morning CAT and MMM announced disappointing earnings which is applying further pressure to the markets. These global conglomerates are feeling the pressure of slowing global growth and the stronger dollar. Both factors are likely to play a bigger role in large caps earnings and less so in the small caps.
We advise you to stay nimble. The lows of January/February are key technical levels that bulls do not want to see broken. The S&P is still about 150 points above them.
Today’s Chart of the Day may provide a little guidance as to which sectors may perform better when respective corporate buyback blackout periods end in the coming week or two.
October 22, 2018
Update 1- After a promising opening the market has reversed on concerns that Italy and the EU are coming to loggerheads over Italy’s budget deficit. Currently the S&P 500 is down 11 points and nearly 25 points off this morning’s highs.
Italy, the world’s third largest issuer of debt was downgraded late Friday afternoon to BAA3, equivalent to BBB-, and the last step before being downgraded to junk status. If they are relegated to junk status, many institutional fixed income managers will be forced to sell Italian bonds to adhere to their funds investment policies. As such, it is likely more sellers will emerge in the days and weeks to come as these funds try to sell on their terms versus being forced into the trade.
China’s stock markets are up 3-4% this morning on support from President Xi Jinping to support the economy. Year to date China stocks are down about 30%.
On the economic front it will be relatively quiet until later in the week when Durable Goods and Third Quarter GDP are released. The consensus GDP estimate is +3.3%.
October 19, 2018
Update 1: Canada just reported inflation at -0.4% vs expected of +0.1% and retail sales of -0.1% vs +0.3% expectations. Given the close economic relationship of Canada and the U.S. we need to keep a closer eye on Canada to see if these are one-off issues or if their economic is truly slowing.
Consider the following: “the S&P 500 fell -1.42% yesterday, the 41st day of the year with a move of +/-1%, after only eight such days in 2017” – Deutsche Bank
While a good portion of those declines came in the first quarter we have certainly been adding to the list recently. The market through the better part of this year is clearly exhibiting different behaviors than in 2017 and prior years. This is one of a few things that alerts us to the fact that we might be in a topping pattern. For now it is technically a consolidation and we must treat it as such. If we break below the lows of the first quarter (2575) our concern will heighten significantly.
Existing home sales will be released at 10am et. We suspect it will continue to point to weakness in the interest rate sensitive housing sector.
On Friday morning we will formally launch RIA Pro. At this time your BETA membership will end and you will be asked to register and create a subscription. If you elect to do so, you may choose from the following plans (monthly and annual plans include a free 14-day trial period):
29.95 monthly
329.45 Annual (1-Month Free)
2999.00 / Lifetime (Only 100 available) *Please contact us for more information
10/18/2018
The equity market roller coaster continues. Yesterday the S&P was down more than half a percent early, but sharply rallied back to close relatively flat. Today it is opening down 11 points. We expect to continue to see significant daily and intra-day volatility as the bulls and bears battle. For the rally to continue we would like to see the market set a series of higher-highs and higher-lows and ultimately take out all-time highs. Conversely, we are looking for a break below October 11th lows if the market is to continue lower.
Please note the chart of the day showing that China’s stock market has grossly under performed global equity indexes. While a telling indicator, keep in mind that their stock market is not nearly as big or important to the wealth of the people of China as the U.S. markets are to our population.
October 17, 2018
Update 1: more weak housing data was just released
The average 30 year mortgage rate is now 5.10% up about 1.50% from the lows of the last few years. The housing sector is rate sensitive and as such we have seen home-builders (XHB) down nearly 25% from the highs of early January. See “Chart of the Day” for a graph. Housing also accounts for about 15-20% of economic growth.
On a weekly basis the Mortgage Bankers Association (MBA) releases mortgage data. The data below comes from this mornings report. While one week is not telling on its own, the trend in these numbers has been negative as you might expect given higher rates.
October 16, 2018
Equity futures are currently slated to open up 16 points which would erase yesterday’s loss. While volatility continues to be high, the daily ranges are shrinking which is hopefully a sign that the market is stabilizing. As long as the S&P does not break the lows of last week (2712) we continue to treat this as consolidation. For those that are uncomfortable with the volatility we suggest paring back positions on strength.
Retail sales were weak yesterday (0.1% versus 0.6% consensus) led lower by gasoline station sales and restaurant sales. We will keep an eye out to see if these are the effects of the hurricane which devastated parts of the Carolina’s or a general slowing of consumption.
October 15, 2018
Equity futures sold off aggressively overnight but have been slowly coming back. The S&P hit a low of 2735 before climbing back to its current level of 2760. There are a few concerns facing investors this morning including:
Disappearance of Jamal Khashoggi and what that might mean for Saudi-US relationships and oil prices
Concern over faltering Brexit discussions
Italy’s coming budget deadline and continued anti-Euro rhetoric
Trump brought up additional tariffs on China
Keep an eye on retail sales announced at 8:30
October 12, 2018
As we noted in yesterday’s Technical Updatethe market failed to hold support at the 200-dma. This opens up a real probability that the current decline is not over.
“The vertical red and green lines were very short-term buy/sell signals which show when price momentum is favorable for increasing or reducing equity-related risk. That signal is currently triggering a “sell” and suggests reducing risks in portfolios currently.
Given the short-term OVERSOLD condition of the market, we want to use rallies to rebalance risks in portfolios.”
Look for a rally over the next day or two to rebalance portfolio risk, execute stop losses (see portfolio commentary), and raise some cash.
Like we saw if February of this year, any rally from current levels will most likely fail and it will be where the market settles next that will determine whether this is a “buyable” bottom or not.
We must reiterate we are not suggesting blowing out of portfolios and moving to cash. What we are suggesting is that we are taking actions to:
Manage our exposure levels,
Readjusting trailing stop-loss levels; and
Reducing risk and raising some cash until “the smoke clears.”
October 11, 2018
Keep an eye on 2750 on S&P futures. If that level breaks the downside might open up.
CPI was tame coming in 0.1% below expectations. This might help alleviate pressures in the bond market and hopefully translate to some stabilization in the stock market.
Over the weekend we posed the question “Did something just break” in our newsletter (see article section in dashboard) It appears it has. For the last week or longer we have discussed rising yields. The equity markets took notice earlier in the week as witnessed by the roller coaster in prices. On Wednesday, something broke, and equity markets were down 3-5%. There was little news, which is a sign this is more about macro type concerns over the Fed, debt and recent downward revisions in corporate earnings estimates. We must also remember that equity valuations stand at levels that have only been witnessed at the peak of the great depression and the tech bubble.
To officially say the market has topped we would like to see the market fall below the lows established in the January/February sell-off. That said, we urge caution and remind you that markets fall a lot quicker than they rise. Yesterday’s slump erased almost 3 months of gains.
PPI was tame yesterday. CPI is released in an hour. We reiterate, that any signs of stronger than expected inflation will be troubling for bonds and as we are now finally seeing troubling for stocks.
October 10, 2018
This headline sums up the market for the last week or so – “Global Stocks Spooked As US Treasury Yields Resume Their Ascent”
Speaking of interest rates, mortgage rates just hit 5% up almost 1.50% from the lows of the last few days. It is important to keep an eye on weekly MBA mortgage data as shown below.
October 9, 2018
The roller coaster continue throughout the day. After being down nearly 20 points prior to the open, the market rallied back to positive territory shortly after the open. After spending three hours in the green it is once again headed lower. We urge caution as this behavior is akin to a topping pattern versus a market set to hit new all-time highs.
Yesterday’s roller coaster market in which it was down nearly 2/3rds of a percent before rallying back in the afternoon to close flat is followed up this morning with another dip. Currently the S&P 500 is down 17 in futures trading. The culprits are the same ones that we have repeatedly seen over the last few weeks; stronger dollar and higher yields globally.
Tomorrow PPI is released and on Thursday CPI will be released. While expectations are for 0.2% increases m/m for both inflation indicators, we harbor a concern that they come in stronger. Inflationary fears would likely cause yields to spike and put more pressure on the stock market.
October 8, 2018
Interest rates are the headline again. Yields around the world are rising and with them stocks falling. U.S. bonds are closed today for Columbus Day, but yields in Italy rose another .20% on budget concerns. Chinese stocks also fell as the central bank was forced to add liquidity to markets. S&P futures are slated to open down 7 points.
The markets seem shaky as if something is getting ready to break. For more on this please read Lance Roberts excellent newsletter posted in the latest articles and video section below.
October 5, 2018
Employment data will be released by the BLS at 8.30ET. Of chief concern to us is a spike in payrolls or signs of strong wage growth. While both are positive they would likely result in higher bond yields, and as we have seen, the stock market is not happy with higher yields. The following are the current estimates for the jobs data:
October 4, 2018
As mentioned in yesterday’s note, bond yields domestically, and now globally, are waking the stock markets up. Fed Chairman Powell indicated that the Fed could “turn more aggressive when it comes to the extent of hikes or the pace of tightening.” Interestingly, Japanese 10yr notes rose past 0.15%. This was the level that prompted the Bank of Japan to take action in early August. They were silent last night.
We leave you with a question – might the central bankers be comfortable with higher interest rates? If the answer is yes, how will that affect asset prices that are largely based on low rates, easy money and rampant leveraged speculation?
October 3, 2018
The 10-Year U.S. Treasury note has risen to 3.13% today which is the high water market since 2011. Yields across the curve are rising in unison.
A precursor to Friday’s employment data, ADP, reported 230,000 new payrolls boding well for Friday’s BLS report which is only expecting 180,000 new jobs.
October 2, 2018
Once again Italy is causing concern in the global markets. Anti-Euro comments from a party official are causing yields to rise and European stocks to fall. US stocks have given up most of yesterdays gains, but we caution we have seen this movie before and suspect Italy’s problems will ignored for the time being. While that may serve investors today or tomorrow, continued unrest will cause contagion to all markets. Keep an eye on Italy!
October 1, 2018
Quick Reminder- Beginning in October the Fed will allow their portfolio to shrink at a rate of $50bn/month, an increase of $10bn from the prior quarter.
Equities are flying high this morning on the late night modified NAFTA deal including Canada. This morning two big manufacturing survey’s will be released (ISM/PMI) and after that the economic calendar will be quiet until Friday. On Friday, the BLS will release the September employment report. More details will follow later in the week.
August 29, 2018
Today’s Chart of the Day shows how volumes this week are nearly the lowest of the year. While the market may look strong, one must remain on guard as the gains are not backed by much activity.
Again, keep an eye on the Turkish lira which continues to slip lower. 7 lira to the dollar is considered to the level, that if sustained, will cause major economic troubles and banking concerns.
August 28, 2018
“Out of sight, out of mind” seems to be the approach the market is taking with Turkey. While we have seen little written on Turkey since their currency stabilized, the lira has recently been heading back towards levels last deemed as crisis conditions.
For the last two days the market has climbed higher on lackluster volume. The market is set to open slightly higher today with the S&P 500 likely eclipsing 2900. While it may appear like the market wants to run higher we have been watching the VIX volatility index as it has nudged higher with the market. This is similar activity to what we saw in January before the market fell about 10%. We will keep our eyes on this and inform you if it continues.
August 27, 2018
We are expecting light volume in the markets this entire week as many investors will take the last week off before Labor Day. With little economic data on the calendar, all eyes will be on the political arena and emerging markets. The markets are opening strong this morning on continued strength on what was perceived as slightly more dovish comments from Chairman Powell.
August 24, 2018
The initial take from Chairman Powell’s speech is being perceived as slightly more dovish than prior statements. In particular he appears less concerned with inflation risks. Gold is up over $15/oz as the dollar is off about .60%. Stocks are higher and bond yields are flat.
Last night China’s central bank (PBOC) announced it would resume the use of “counter-cyclical factors.” More bluntly they will intervene actively in the currency markets when the yuan moves more than they would like. This is clearly a sign to Washington that they are willing to negotiate on trade issues. The yuan rallied from 6.90 to 6.83 versus the dollar on the news (graph below). This should be dollar negative on the margin and good for commodities and precious metals.
The caveat however, is that if 25% tariffs on 40% of China’s exports are implemented on September 5th as planned, the PBOC may be forced to let the yuan depreciate to help offset the tariff.
August 23, 2018
Tomorrow’s speech by Fed Chairman Jerome Powell has the potential to create fireworks in the markets. Trump has recently criticized him for taking liquidity away from the market. Powell, with no uncertainty thus far, has been intent on raising rates and draining liquidity via QT. Will Powell’s speech continue down the same path or will the President’s recent words change Powell’s stance? If the former, expect the market will not be happy, conversely the latter would be cause for much celebration and new highs would be all but certain.
August 22, 2018
The market is opening slightly weaker on late day news of Michael Cohen’s plea deal and Paul Manafort’s guilty findings. Regardless of your politics, you should invest cautiously as political turmoil is not a positive bedfellow for asset prices.
The S&P 500 hit a slightly higher high yesterday. Technically we ask does that record signal a double top or a run much higher. Time will tell…
August 21, 2018
Per Bloomberg (below) President Trump does not appear to like the Fed’s plans to continue raising rates. While history is strewn with President’s pressuring the Fed Chairman to make financial conditions easier, it is a noteworthy event. with Trump’s comments, Chairman Powell’s speech on Friday will be even more important. We will keep a close eye out for signs that he might fall in line with Trump’s expectations. If he takes the opposite tack, the markets could be in for a shock.
(Bloomberg) — President Donald Trump said he expected
Jerome Powell to be a cheap-money Fed chairman and lamented to
wealthy Republican donors at a Hamptons fundraiser on Friday
that his nominee instead raised interest rates, according to
three people present.
August 20,2018
We suspect the summer doldrums in the markets could continue through the first half of this week. On Thursday the Fed will convene at their annual Jackson Hole summit. In the past there are have been market moving comments made at this summit. Chairman Jerome Powell will speak on Friday and the market will be listening for any clues about the pace of future rate hikes and QT.
August 17, 2018
It is shaping up to be a quiet summer day. With Wall Street heading to the Hamptons as summer winds down, the next two weeks might be similar. That said China and Turkey could certainly upset vacation plans on a moments notice. The markets are opening up slightly lower and the Turkish Lira is weakening again. Consumer sentiment is the only relevant piece of economic data to be released today.
August 16, 2018
There is an old market saying “volatility begets volatility.” Lets see if the large loss yesterday and big gain today are precursors to greater volatility ahead or simply a one-off overreaction in a low-liquid summer trading environment.
The market is opening up firmer this morning, recouping a good amount of yesterdays loss. The driving factor appears to be China’s willingness to send a trade envoy to the US to negotiate trade. Sound familiar? This back and forth has gone on for months and we are reluctant to believe that trade will be resolved anytime soon. While the technical outlook remains bullish, we urge caution as the poor liquidity of summer coupled with potential headlines from China, Turkey and other emerging market nations raises the possibility of violent swings up and down.
August 15, 2018
Stock markets have weakened further this morning as dollar and emerging market concerns take the front and center. Are the stock markets finally relenting to dollar strength? If so will the Fed and/or the Administration try to talk the dollar back down? These are important questions that you should keep asking yourself.
US Dollar strength is causing financial problems for the emerging markets and commodities. We suspect that if the trend continues, US equities will start to feel the brunt of a strong dollar as well. Dollar appreciation is a headwind for corporate profits on the aggregate. Further it weakens the trade deficit which might cause Trump to consider more tariffs. S&P futures are currently down 18 this morning on what appears to be weakness in China’s equity markets and another surge in the dollar. Currently the dollar stands at over 1 year highs.
August 14, 2018
With today’s 1.5% decline, Copper is down almost 20% since late May. While US economic growth appears healthy, Dr. Copper tells a different story about global growth.
Click here to read Lance’s latest weekly Technically Speaking article.
The economic data release front is also slow. That said, retail sales will be released tomorrow. Current expectation is for a .1% gain. Last month retail sales gained .5%.
Global markets recovered some of yesterday’s losses last night as the Turkish Lira rebounded. Light summer volume contributed to weak markets as traders continue to focus on Turkey and importantly the repercussions to other developed and emerging nations if they are to have more serious problems.
August 13, 2018
Last night the South African Rand depreciated over 10% versus the U.S. dollar but has regained much of those losses since that time. A strong dollar is painful for countries that borrow in dollars. Not only must borrowers pay interest, but importantly the amount of principal they owe on the loan is tied to the currency exchange rate.
August 12, 2018
Sunday Update- The Turkish Lira opened up sharply lower, eclipsing 7 Lira per dollar. Much has been written about significant problems that occur when that level is eclipsed. BBVA (Spanish bank) and BNP (French bank) have a lot of exposure to Turkey. The bigger question is how much exposure do they have to Deutsche Bank. If the situation gets out of hand we must focus on the next set of dominoes.
August 10, 2018
Trukish President Erdogan is asking citizens again to take their dollars and euros and convert them to Liras. A visit to bank branches in Istanbul today indicated that the opposite is happening https://bloom.bg/2KImIIj
Markets are opening weaker this morning as the Turkish currency crisis is worsening. Over the last few years Turkey used extremely low interest rates and printed money to aid economic growth. As a result of the central bank’s actions debt rose and the Lira depreciated. This was encouraged and supported by their President Erdogan.
The Lira has depreciated over 20% this week and its value has been halved versus the dollar since the beginning of the year. Turkey is not an isolated case. They have taken on a good amount of dollar denominated debt (30% of GDP) which is becoming very costly to repay due to the currency depreciation. Banks such as Spain’s BBVA and France’s BNP have a lot of this exposure on their books. For more on this please read Daniel LaCalle’s take.
August 9, 2018
On Wednesday we published Whatever it Takes . The follow graph from the article is 10-year Japanese bond yields. As the yield rises past 0.10% the pressure on the Bank of japan increases.
PPI was weaker than expectations at 0% monthly and 3.3% year over year. Bond yields have dropped initially on the release.
Producer Prices (PPI) will be released shortly. Expectations are for an increase of .3% monthly and 3.4% year over year. The market will watch this and CPI (tomorrow) for any signs that inflation is creeping up into the economy. Expect bond volatility if the number is significantly larger or smaller than expectations.
Portfolio Alerts
NEWSLETTER IS OUT – SIMPLEVISOR.COM
Currently, you will find the weekly newsletter under the BLOG section at SIMPLEVISOR.COM (Just log in with your current credentials.)
As we finish fixing a few bugs, we will have a site update in the next few days and the newsletter will have its own section under COMMENTARY.
Portfolio Trade Alert For 12-16-21
Trade Alert For Equity & ETF Models Only
With the Fed meeting now behind us, and just options expiration left on Friday, we are using the weakness from the last couple of trading days to fill out the rest of our portfolio for the Santa Claus rally into year-end.
As such we are making 2-key adjustments. First, we are adding slightly to our equity holdings mostly by adding to our S&P 500 index trading position. Secondly, we are rebalancing our bond portfolio to lower volatility and increase yield as we head into 2022.
Equity Portfolio
Sell 100% of GSY (Short-Duration Bond Portfolio)
Add 6% of TFLO (Floating Treasury Bonds)
Increase IEF (Intermediate Treasury Bonds) to 4% of the portfolio.
Increase Preferred ETF (PFF) to 10% of the portfolio
Reduce Apple (AAPL) by 0.5% to take profits.
Add 0.5% to Adobe (ADBE) on earnings-related weakness this morning.
Add 1% of Asana (ASAN) to the portfolio following its recent correction.
Add 2% of the portfolio to the S&P 500 Index ETF (SPY) bringing the trading position to 7%.
ETF Portfolio
Sell 100% of GSY (Short-Duration Bond Portfolio)
Add 10% of TFLO (Floating Treasury Bonds)
Increase IEF (Intermediate Treasury Bonds) to 4% of the portfolio.
Increase Preferred ETF (PFF) to 10% of the portfolio
Add 1% to Technology Select ETF (XLK) bringing total weight to 14%
Add 2% of the portfolio the S&P 500 Index ETF (SPY) bringing the trading position to 7%.
Risk/Reward Range Suggests Short-Term Correction Possible.
Portfolio Trade Alert For 12-10-21
NOTE: Trading alerts are moving to SimpleVisor.com entirely starting January 1st, 2022.
Trade Alert For Both Equity & ETF Models
As noted previously, we will continue to use weakness in the market to add additional exposure to the portfolio in preparation for the year-end rally. Today, we are adding 3% of the portfolio into the equity allocation sleeve.
With the exception of the addition of 1% to our SPY trading position, we are adding to our existing core holdings in both models after recent corrective action. We do expect we could see some additional market weakness next week heading into December options expiration. We will continue using dips to add exposure accordingly.
Equity Model
Increase Netflix (NFLX) by 0.5% of the total portfolio. Model weight is now 2.5%
Add 0.5% to Adobe (ADBE) bringing total portfolio weight to 2.5%.
Ford (F) gets increased by 0.5% to a total weight of 3%.
Costco (COST) also gets increased by 0.5% to a total weight of 3%.
Add 1% to the SPY trading position bringing the total weight to 5%.
ETF Model
Add 1% to LIT (Lithium ETF) bringing portfolio weight back to 3%.
Increase XLK (Technology ETF) by 1% bringing total portfolio weight to 13.5%
Add 1% to the SPY trading position bringing the total weight to 5%
Portfolio Trade Alert For 12-07-21
*** Portfolio Trading Alert *** – Equity Model Only
As noted in this past weekend’s newsletter, we started adding to our equity exposure in the portfolio due to the short-term oversold condition in the market. Furthermore, our “money flow” indicator is about to flip to positive registering a buy signal for the market. (This indicator is in the last stages of development and will be deployed soon for your use.)
After previously taking profits when the “weak sell” signaled was triggered, we are now adding back to those positions now that they have suffered sizable corrections. We are also maintaining our SPY trading position for now as well, which increases our equity exposure to target model weights.
Equity Portfolio
Increase Nvidia (NVDA) to 2% of the portfolio
Same also for AMD (AMD), increase to 2% of the portfolio
Add 1% to Microsoft (MSFT) increasing portfolio weight to 3.5%
Also, add 1% to Marathon OIl (MRO) bring total portfolio weight to 2%.
Increase Raytheon Technologies (RTX) to 2% of the portfolio.
Lastly, add 1% to Albamarle (ALB) bringing the total weight back to 4% of the portfolio.
We added 2% of SPY to the sector and equity models late this afternoon. We are taking advantage of today’s sell-off to add to our position. The market is holding support at the 100-dma and is deeply oversold. We suspect we will see a tradeable rally into next week.
Add 2% of the portfolio in SPY to the current holdings. (Position size increases to 4%)
Over the last couple of weeks, we discussed the potential for some corrective action in the first two weeks of December as mutual funds distribute their annual gains. That selling came a bit sooner than expected, but our previous reduction in equity exposure and hedging reduced our overall volatility. With the deeply oversold condition now present, and the seasonal tendency for a year-end rally, we are now starting to increase our risk exposure accordingly.
We are nibbling at some beaten-up oil stocks, adding a broad market trading position, and continuing to clean up laggards. Over the next week or so, we will look to increase allocations in Healthcare, Technology, Energy, and Financials primarily. Although we will pick up opportunities wherever we find them.
Equity Model
Sell 100% of Johnson and Johnson (JNJ)
Increase XOM to target a weight of 2% of the portfolio.
Initiate a 1% position in MRO (Marathon Petroleum)
Add a 2% trading position in SPY in the portfolio.
ETF Model
Add 1% to XLE bringing the total position weight to 3% of the portfolio.
Add a 2% trading position in SPY in the portfolio.
*** Portfolio Trading Alert *** – Equity Model Only
We sold Verizon (VZ) in the equity model this morning for tax-loss harvesting. We have a lot of gains to offset this year from profit-taking. While we like Verizon fundamentally, particularly the 4% yield, we think it could continue to trade weaker over the next couple of weeks as mutual funds and professional managers do the same. We will likely buy it back in a month as it should benefit from the infrastructure bill and a potential shift to value next year.
We previously put on a small volatility hedge in light of the record number of call options outstanding. At that time we said we would close out that hedge when those options expired. This more we sold the entire hedge of VXX at a small loss. Given that next week is Thanksgiving, and trading volumes will be exceptionally light, we are leaving the portfolios with a heavier weighting of cash to offset risk.
Equity & ETF Models
Sell 100% of the Volatility Index (VXX)
November 17, 2021
*** Portfolio Trade Alert *** Equity Model
This morning news hit that Amazon (AMZN) would not be accepting Visa (V) credit cards issued in the U.K. That news sent the stock immediately lower this morning violating all of our stop-loss levels. While we still have a small gain in the stock, we are selling the remaining shares in our portfolio. We are looking for a replacement in the space and are evaluating some candidates to add.
*** Portfolio Trade Alert *** Equity and ETF Models
Over the last week, we have discussed reducing equity risk slightly by raising cash and adding hedges. As we head into options expiration week, the Thanksgiving holiday, and mutual fund distribution season, we are looking to become a little more defensive by raising cash levels.
Currently, our bonds have gotten extremely overbought short term, so we are trimming our duration back a bit by reducing TLT. We are still fully in the camp that rates will fall next year as the economy slows, so we will use a pullback in bond prices to increase our exposure.
On the equity side of the allocation, we are just reducing our position sizes in some stocks or sectors that are more extremely overbought and triggering short-term sell signals.
Equity Model
Trim TLT from 8% to 6%
Reduce PFF from 10% to 7.5%
Reduce MSFT from 2.5% to 2% of the portfolio.
Taking profits in AMD from 2.5% to 1.75%
Trimming ABBV from 4% to 3.5%
Reducing ABT from 2% to 1.5%
For a second time, we are reducing NVDA from 2% to 1.75%
As noted earlier this week, with the market back to extreme overbought and extended levels, and individual names making outsized moves, we are taking some small profits out of our most egregiously extended positions.
In the equity model, we are reducing CVS Health (CVS) from 3.5% of the portfolio to 3%.
Equity Model
Reduce CVS from 3.5% to 3.0% of the portfolio.
November 2, 2021
*** Portfolio Trade Alert *** Equity & ETF Models
The market is now back to extreme overbought and extended levels. As such, we are now taking some small profits out of our most egregiously extended positions.
In the equity model, we are taking some profits in F, NVDA, ALB, and NFLX back to model weights. We are also selling all of SBUX after it violated our stop levels.
In the sector model, we are reducing LIT by 0.5% as it is overbought like ALB. We remain decently overweight in the basic materials sector.
With the market entering a “melt-up” phase on earnings exuberance, we are adding to our VXX position today to hedge against the currently overbought conditions. With the Fed meeting next week, there is a risk of a short-term sell-off if the Fed appears more hawkish than expected.
Both Models
Add 1% of the portfolio to VXX increasing size to 3% of the portfolio.
October 27, 2021
*** Portfolio Trade Alert *** Equity & ETF Models
This morning we trimmed back on both of our energy exposures (XOM and XLE) back to model weights. The recent run took the positions out of tolerance relative to the portfolio.
We also added a 2% position in VXX (Volatility Index) which has become very suppressed lately. Given the overbought condition of the market, we are looking for a small risk hedge heading into the Fed meeting next week.
This morning we sold 100% of SHY which is under pressure as the market gets more aggressive about pricing in future interest rate hikes. As shown, there is currently a 100% chance the Fed will hike rates twice in 2022, and a 70% chance of three rate hikes.
When the Fed gets more aggressive about rate hikes, the long end of the curve will fall. Therefore, as the 10-year moves toward 1.8-2%, we will become more aggressive buyers of duration. For the meantime, we will leave the money in cash and over the next week or so decide how to deploy it within the fixed income sector.
Fear / Greed Model Rising But Not Yet Back To Greed
Risk / Reward Ranges Show Market Back To Short-Term Overbought
October 14, 2021
*** Portfolio Trade Alert *** Equity & ETF Models
As we kick off earnings season in earnest we are increasing our technology exposure where we have been underweight previously. In the equity model, we are adding 1% to our current holdings of ADBE and initiating a 2% position in AMD due to its breakout above its recent downtrend.
We added 1% of XLP to the sector model. It is turning up on a buy signal from a very oversold condition. The inflationary impulse is likely to fade or at least take a break, arguing for sectors like staples, technology, and healthcare should begin to perform better.
ETF Model
Add 1% of the portfolio to XLP increasing weight to 5% of the portfolio.
October 7, 2021
*** Portfolio Trade Alert *** Equity Model Only
This morning we added 1% to COST and PG. We also bought a new 1% position in WM. All three have nice technical setups. COST and PG are staples and we were underweight staples in the equity model. WM allows us to increase exposure to industrials without taking on China’s risk, as many industrials have.
Equity Model
Add 1% to COST bringing the total weight to 2.5% of the portfolio.
Adding 1% to PG bringing the total weight to 2% of the portfolio.
Initiating a 1% position in WM.
October 6, 2021
*** Portfolio Trade Alert *** Equity & ETF Models
We just reduced our exposure in both portfolios slightly in part because of recent volatility and what we view as a poor risk/reward skew.
In the Equity model, we sold the entire position in UPS. It broke through key technical support and is trading poorly. FDX recently had poor earnings and UPS will likely follow suit when they report on October 26th. We also sold the entire stake of IYT in the ETF model as well.
We also cut JNJ to 1.5% from 2.5%. It has also broken through key technical support, but we like the fundamental story longer-term. We will look for an opportunity to add back into the position once it strengthens technically.
Technical Gauge Drops Into “Buy Territory” For A Bull Trend
Allocation Model Also Moves Into “Buy Zone” For A Bull Market.
Risk / Reward Ranges Reset For New Month – Most Excesses Reversed
September 29, 2021
*** Portfolio Trading Alert *** Equity and ETF Models
As noted in this morning’s Daily Commentary, the recent spike in interest rates has given us a decent opportunity to add to our longer-duration bond portfolios. We have an article coming out on Friday discussing the history of “debt ceiling” debates and the outcome for bonds. With bonds bouncing off support at the 200-dma and oversold, such has historically provided a decent entry point to add exposure.
Equity & ETF Models
Add 1% to both IEF and TLT respectively.
September 27, 2021
*** Portfolio Trading Alert *** Equity and ETF Models
As noted in this morning’s Daily Commentary, with the market triggering its “money-flow” buy signal, we are continuing to increase our exposure in both models. This morning we added a bit more to our Utility exposure which increases our overall portfolio dividend yield and gives us a bit of defensive positioning. We also increased our stakes in energy and financials.
Equity Model
Add 1% to DUK, XOM and JPM bringing total portfolio weight to 2% each.
ETF Model
Add 1% to the current holdings of XLE, XLU, and XLF
The Federal Reserve did exactly as expected yesterday and threaded the needle well on putting “taper on the table” and assuring markets the “punch bowl” wasn’t being taken away just yet.
“There has been a great deal of handwringing by some market participants over the potential market implications of the Fed’s eventual tapering of asset purchases, and a great deal of ink spilled on the topic too. But at the risk of merely contributing to the latter, we hope to assuage those who worry about the former.
In sum, we think that the tapering of Fed asset purchases (likely a $10 billion reduction in U.S. Treasury purchases and a $5 billion reduction in agency mortgages per month) is likely to have minimal market impact at this stage. This is partly because the Fed has done a decent job of telegraphing when tapering is likely to begin (most market participants believe the announcement will come this year), but more importantly it’s because the asset purchase reductions are likely to be trivial when seen in the context of how large the fixed income markets are today, and how overwhelming the demand for income has become.” – Rick Rieder, BlackRock’s CIO of Global Fixed Income
With stocks deeply oversold on a short-term basis, as noted yesterday, and the threat of “taper” largely baked into the recent decline, there is a decent entry point for traders to add exposure near term. As noted, the 50-dma is the only real challenge ahead but will likely be resolved today.
Equity Model:
Add 1% to GS and MSFT bring exposure to 2% each.
Add 1% to GOOG bring model exposure to 3%. (It is 4% in equity portfolio due to price of shares.)
ETF Model
Add 1% to XLF bringing exposure to 3%
Add 2% to XLK bringing exposure to 10.5%.
September 21, 2021
After finally getting a bit of a sell-off to work off the overbought condition, we are beginning to look for opportunities to increase equity exposures in portfolios as we head into year-end.
As Sentiment Trader noted today:
“The broad market is in an environment known as ‘No Man’s Land.’ That means we have a few oversold short-term indicators with several intermediate to long-term indicators that are deteriorating but above a level that creates a fat pitch situation.
Remember the following:
“The markets do whatever they have to do to frustrate the most people.”
There are many more reasons to be bullish than bearish at the moment.
Global liquidity flows remain extremely strong.
October through November are historically strong especially when markets are up 15% or more in the first half of the year.
Interest rates remain low, and even if the Fed does announce taper, it will be minimal by year-end.
Volatility has spiked up recently providing the bulls some fresh “fuel”
Sentiment is negative and AAII sentiment is bearish.
With this backdrop we are beginning to add exposure to portfolios starting with defensive positioning first, to hedge against short-term volatility, and then we will move into more momentum names as markets improve.
Risk / Reward Ranges (Reset For Beginning Of Month)
Technical Gauge Pushing Higher
Fear / Greed Index Rising
September 2, 2021
*** Portfolio Trade Update *** Equity & ETF Model
We added 1% to TLT bringing it to 7% in both models. Technically it looks ready to break higher and has good support directly below with the 50/200 dma’s.
We added 1% ABBV to the equity model. The sharp decline yesterday seems overdone and provides us an opportunity to add.
In the equity model, we took profits on WOOF, selling the entire position. We may revisit it in the future as we like its fundamentals but currently, price action remains very weak.
We also sold our 1% of FANG and replaced it with 1% of XOM. We did this to reduce volatility and align the beta of our energy holdings with the beta of XLE. FANG was a great buy but much more volatile than the sector and market. Also, XOM carries a 3+% yield which increases our dividend payout for the portfolio.
We remain wary of this market. Internals continue to deteriorate, volume remains weak, and technicals are stretched. Therefore, we continue to keep “tweaking” the portfolio to give us relative but reduce our overall risk exposure as well.
This morning we added 1% TLT and 2.5% IEF to both models. We sold GSY down to 2.5% to make room. Our WAVG duration is now 4.5 versus 5.9 for our benchmark. Such is due to today’s commentary:
“The graph below is 30-year UST yields with its 50 and 200 dma’s. The vertical lines highlight the last five times, 30 year yields have witnessed its 50 dma falling below its 200 dma, also known as a “death cross.” In 3 of the last 4 death cross instances yields fell appreciably and reached record lows. The only time they didn’t was in 2017 (red vertical line). At that time yields consolidated to negate the death cross. As shown, on Monday 30-year yields witnessed a death cross.”
Risk / Reward Ranges Show Overbought In Technology
Technical Gauge Remains Elevated
Allocation Levels Remain Greedy
August 13, 2021
*** Portfolio Trading Alert *** – Equity Model Only
This morning we added 1% of AAPL and 2% WOOF (Petco) to the equity model. AAPL looks strong from a technical perspective despite the overall market showing signs of technical weakness. WOOF is also strong technically and relatively cheap fundamentally. They report earnings next week on August 19th.(Hopefully, it’s not a dog!!)
Equity Model
Add 1% of the portfolio to AAPL increasing position size to 3.5%
Deviations from long-term means are getting extreme again. Suggests a correction in leading sectors likely.
Fear / Greed Allocation Increased
August 5, 2021
*** Portfolio Trading Update *** Equity & ETF Model
This morning we reduced our exposure slightly as our indicators are starting to turn back down. We also think, with the Fed constantly yammering about tapering QE, the market struggle to move much higher limiting upside. It’s also worth reminding you we are now in the weakest 3-months of the year. We are reducing our financial sector exposure slightly as the yield curve continues to flatten which will hurt their profit margins.
Equity Model
Sell 100% AMLP
Reduce JPM and GS by 1% of the portfolio each.
ETF Model
Sell 100% of AMLP
Reduce XLF by 1% of the portfolio
This morning DUK reported GAAP EPS of $0.96, which missed expectations of $1.08. However, adjusted EPS of $1.15 beat expectations of $1.11. Revenue for the second quarter was $5.76B, which fell just short of the consensus of $6.26B. Management confirmed guidance for FY21 adjusted EPS of $5.00-$5.30 and an adjusted EPS growth rate of 5%-7% through 2025. The adjusted EPS guidance, at the midpoint, falls slightly below the consensus of $5.19. Regarding the future of DUK, the CEO Lynn Good commented, “Moving forward, we’re leading the most ambitious clean energy transition in North America while providing safe, reliable and affordable energy solutions to our customers and communities across the Southeast and Midwest, enabled by our scope and scale”. We hold a 1% position in the Equity Model.
ALB reported earnings for the second quarter yesterday after the close. GAAP EPS of $3.62 demolished the consensus estimate of $0.85. Revenue came in at $773.9M, which disappointed in comparison to expectations of $787.7M. Although aggregate sales growth was lackluster, lithium sales increased 13% YoY in connection to increased order volume under long-term agreements. Pointing to a positive outlook for lithium sales, management raised guidance for FY21 adjusted EPS to $3.35-$3.70, bringing the midpoint in line with analyst expectations. Guidance for FY21 sales was set at $3.2B-$3.3B, with the midpoint again measuring in line with estimates. The stock is up roughly 5.5% this morning following the earnings results and upbeat guidance. We hold a 2.5% position in the Equity Model.
August 4, 2021
This morning CVS reported GAAP EPS of $2.10, which smashed expectations of $1.71. Revenue was $72.6B in the second quarter versus the consensus of $70.3B. The earnings beat was driven by a combination of sales growth and QoQ operating margin improvement. In addition to the strong results, management raised guidance for FY21 GAAP EPS to $6.35-$6.45 from $6.24-$6.36 previously. Adjusted EPS guidance was also revised upward to $7.70-$7.80, which tops the current consensus of $7.67. We hold a 3.5% position in the Equity Model.
Yesterday after the close, PSA reported core FFO per share for the second quarter of $3.15, which beat the consensus of $2.94. Revenue was $829.3M compared to expectations of $805M. Same store net operating income increased by 20.8% during the quarter, driven an increase of 10.8% in same store revenues and a 15.9% decrease in same store operating costs. Management raised guidance for full-year 2021 core FFO per share to $11.90-$12.30 from $11.35-$11.75 previously, which is about 2% above consensus at the midpoint. Guidance was also raised for FY21 same-store net operating growth to 9.4%-11.9% from 4.8%-7.3% previously. We hold a 1% position in the Equity Model.
August 3, 2021
Yesterday FANG reported GAAP EPS of $1.71, which missed expectations of $2.19. Revenue topped expectations however, coming in at $1.68B versus the consensus of $1.33B. FANG increased its annual dividend by 12.5% to $1.80 per share and continued right sizing its balance sheet by paying down debt during the quarter. Management slightly raised guidance for full-year 2021 production to 363-370 MBOE/d, an increase of 3.2% at the midpoint. Citing an artificial lack of supply in the global oil market, FANG believes maintaining operational discipline is the right strategy moving forward. As CEO Travis Stice put it, “We still believe the best path to long term value creation for stockholders today is achieved through flat oil production, lower costs and return of Free Cash Flow”. We hold a 1% position in the Equity Model.
Technical Guage Remains Elevated Suggesting More Correction Is Possible
Risk / Reward Ranges Show Some Extreme Elevations.
Fear / Greed Allocation Gauge Remains High As Retail Investors Pile In.
PG reported GAAP EPS of $1.13 versus expectations of $1.07. Revenue of $18.96B (+3.9% YoY) beat the consensus of $18.38B. Organic sales growth was 4% while total sales growth was 7% for PG’s FY21. Management guided to FY22 sales growth of 2%-4% YoY, all of which is expected to be organic. Management guided to FY22 GAAP EPS growth of 6%-9%, while core EPS growth is expected to be 3%-6%.
The market is showing a positive reaction to the earnings release and detailed FY22 guidance. The stock is up roughly 3% this morning. We hold a 1% position in the Equity Model.
ABBV reported GAAP EPS of $0.42, far short of expectations of $1.65 for the second quarter. With such a large miss on a GAAP basis it’s worth noting that adjusted EPS of $3.11 beat the estimate of $3.03. Revenue of $13.96B beat expectations of $13.64B. Management lowered FY21 guidance for GAAP EPS by 17% at the midpoint to a range of $6.04-$6.14. However, management raised FY21 guidance for adjusted EPS to a range of $12.52-$12.62. The midpoint is essential inline with the consensus of $12.58. ABBV is down roughly 1.5% this morning following the less than desirable results and guidance. We hold a 3% position in the Equity Model.
July 29, 2021
AMZN reported GAAP EPS of $15.12, easily topping the consensus of $12.32. Revenue missed estimates however, coming in at $113.1B compared to expectations of $115.1B. Operating income similarly disappointed at $7.7B vs. expectations of $7.8B. AMZN expects net sales in Q3 between $106-112B, roughly 8% below the current consensus. Management guided to Q3 operating income between $2.5B-$6B, in contrast with the $6.2B seen in Q3 of 2020. The stock is down 5% in after-hours trading following the disappointing results and guidance. We hold a 3% position in the Equity Model.
We are continuing to increase the duration of our bond portfolio in increments when we get pullbacks to support on 10-year Treasury Rates. This morning we added 1.5% to our position in TLT in both models, bringing it to 5%. We reduced our position in SHY to 7.5% to make room for the additional exposure in the fixed income sleeve.
We also initiated a 2% position in NVDA in the Equity Model. Both models are now around 50% equity exposure.
Equity Model
Initiate at 2% position in NVDA
Add 1.5% of the portfolio into TLT
ETF Model
Add 1.5% of the portfolio into TLT
July 28, 2021
F reported GAAP EPS of $0.14, which smashed expectations of $0.09. Automotive revenue also surprised to the upside at $24.1B versus the consensus of $22.8B. The strong results come after F previously commented on the likelihood of the global chip shortage impacting production during the quarter. F took advantage of strong demand by decreasing incentives and prioritizing a favorable mix of vehicles, which ultimately helped the company beat expectations. Management boosted its FY21 guidance for adjusted operating earnings by roughly $3.5B to the range of $9B-$10B. We hold a 3% position in the Equity Model.
*** Portfolio Trading Alert *** – AeonViZion
After an upbeat earnings report from Alphabet, GOOG was added to the AeonViZion to comprise 27.7% of the model. GOOG continues to create sustained growth in cloud space with a revenue of 4.6 billion, an increase of 54.4% year-over-year. In addition, Alphabet continued to dominate the digital ad space and racked up $50.4 billion in revenue, an increase of 69% year-over-year.
AeonViZion Model
Initiate at 27.7% position in GOOG
July 27, 2021
MSFT reported non-GAAP EPS of $2.17, which beat expectations of $1.92 for the quarter. Similarly, revenue of $46.2B beat expectations of $44.3B. Weaker than expected growth in Azure revenue and a decline in Xbox sales appear to be weighing on the stock despite having beat revenue and earnings estimates. MSFT is trading 2.7% lower in the after-hours session. We hold a 1.5% position in the Equity Model.
V reported GAAP EPS of $1.18 versus the consensus estimate of $1.35. Revenue of $6.1B topped expectations of $5.86B. Payments volume grew 34% versus the year-ago quarter, which was significantly higher than the consensus of 26.2%. We hold a 1% position in the Equity Model.
GOOG reported GAAP EPS of $27.26 compared to expectations of $19.27. Revenue for the second quarter was $61.9B, which smashed expectations of $56.1B. According to the CEO, Sundar Pichai, the strong quarterly revenue was driven by increased online activity from consumers and strength in advertising spend. Assisted by revenue growth, GOOG’s operating margin improved to 31% from 17% in the second quarter of 2021. We hold a 1.5% position in the Equity Model.
AAPL reported GAAP EPS of $1.30, which easily beat expectations of $1.01. This came on the back of revenue of $81.4B versus the consensus of $73.5B. AAPL saw record quarterly revenue in each of its geographic segments and double-digit growth in each product category. iPhone sales surprised the most within the product categories, coming in 14.5% above market expectations. We hold a 2.5% position in the Equity Model.
SBUX reported GAAP EPS of $0.97 versus the consensus of $0.77. Revenue of $7.5B also beat expectations of $7.3B on comparable sales growth of 73%. Management raised its guidance for full year 2021 GAAP EPS to $2.97-$3.02 from the previous range of $2.65-$2.75. SBUX is trading down 3.3% post market despite reporting strong results and lifting guidance. We hold a 1% position in the Equity Model.
UPS reported GAAP EPS of $3.05, which beat the consensus estimate of $2.80. Revenue of $23.4B was slightly above expectations of $23.2B during the quarter. The results are positive, however, management offered guidance for FY21 operating margin of 12.7% which was below market expectations of 14%. UPS is currently trading down roughly 8.5% this morning as a result. We hold a 2% position in the Equity Model.
RTX reported GAAP EPS of $0.69 versus expectations of $0.79 for the second quarter. Revenue came in at $15.9B for the quarter, which beat the consensus of $15.4B. RTX achieved $185M of incremental cost synergies resulting from the 2020 merger. Citing a strong focus on integration execution, management raised its guidance for merger related cost synergies by $200M to $1.5B. Management also raised full-year 2021 guidance for adjusted EPS to $3.85-$4.00, which represents an increase of 9.2% at the midpoint. RTX is trading roughly 3.7% higher this morning after the release. We hold a 1.5% position in the Equity Model.
This morning we added 1% DUK to the equity model bringing the exposure to Utilities to 2%. This action aligns the Equity Model with the ETF Model in terms of Utility exposures.
Buy 1% of the portfolio in DUK
ABT reported Q2 GAAP EPS in line with expectations of $0.66. Quarterly revenue was $10.2B, which beat the consensus of $9.7B. Excluding COVID-19 testing, organic sales grew 11.3% versus the second quarter of 2019. ABT maintained its guidance for full-year 2021 GAAP EPS of $2.75-$2.95. Despite the positive results, the stock is down 2.3% this morning. We hold a 2% position in ABT in the Equity Model.
We are adding to our existing TLT (20-year Treasury Bond) holding today to increase our exposure on this recent pullback in rates. With economic growth likely to have peaked, we feel there is more downside pressure on yields to come by year-end. Given we are very underweight our benchmark in bonds, the minor addition of duration moves us in the right direction.
Equity & ETF Models
Increase TLT from 2.5% of the portfolio to 3.5%.
Netflix (NFLX) missed on earnings ($2.97 vs $3.16) last night but beat slightly on revenues. They also reported mixed news on subscriber growth. Paid subscribers increased by 1.54m versus expectations for 1.12m. However, third-quarter expectations for the change in paid subscribers was +3.5m versus expectations for +5.86m. NFLX is trading down a little more than 1% in pre-market trading. We own NFLX in our Equity Model.
This morning we are reducing exposure slightly in portfolios particularly in the Nasdaq-related areas which is extremely overbought relative to the S&P 500 index. As has been the case with our actions as of late, we continue to tweak exposures to reduce overall risk while still maintaining our core positions.
Equity Model
Reduce ADBE by 1% of the portfolio
Sell 1% of AAPL as it has run well ahead of earnings.
Reduce UPS by 1% of the portfolio
Sell down AMLP from 3.5% to 2% of the portfolio.
ETF Model
Reduce XLV by 1% of the portfolio.
Reduce XLK by 1% of the portfolio.
*** Portfolio Trading Alert *** – AeonViZion
This morning BABA was added to AeonViZion to compromise 12.8% of the model. Although BABA currently has bearish signs in technicals and negative Chinese sentiment. The market continues to discount the stock and is currently trading at a Forward P/E ratio of 22.82 while the rest of the industry trades on average Forward P/E ratio of 60.16. In addition, the Chinese tech conglomerate posted 64% year-over-year in Q4.
AeonViZion Model
Initiate at 12.8% position in BABA
July 19, 2021
***Portfolio Trading Update *** AeonViZion
NEW MODEL – The AeonViZion model is tailored toward aggressive or young investors willing and able to take on more risk. The model reflects a Gen-Z viewpoint that looks for high growth opportunities with a long-term perspective. Disruptive innovation, emerging sectors, and new technologies are the focal points of the model, while maintaining exposure to established companies.
Risk Reward Ranges – Real Estate and Utilities Very Overbought
Fear Greed Gauge Mostly Unchanged For The Week – Still Elevated
Technical Gauge Declines A Bit As Market Advance Slows
July 13, 2021
JPM and GS both released earnings results for the 2nd quarter this morning. We hold a 2% position in each stock in the Equity Model.
JPM reported GAAP EPS of $3.78, which easily beat expectations of $3.18. These results came on revenue of $30.5B, which topped expectations of $29.7B. The EPS was boosted by $0.75 from a net credit benefit of $2.3B due to the release of loan loss reserves, which accumulated earlier in the pandemic but have since been largely unnecessary. This compares to a net credit benefit of $4.2B in the first quarter of 2021. Finally, JPM reduced its FY21 guidance for Net Interest Income to $52.5B from its previous outlook of $55B.
GS reported GAAP EPS of $15.02 versus expectations of $9.95. Revenue of $15.4B, which beat expectations of $12.2B, was driven by record Asset Management revenue and the 2nd highest quarterly Investment Banking revenue to date for GS. Furthermore, the Investment Banking backlog ended the 2nd quarter at a record level. Prior to the strong results, the Board announced on July 12th that it is increasing the quarterly dividend by 60% to $2.00 per share, payable September 29, 2021.
July 12, 2021
*** Portfolio Trading Alert *** – ETF Model
This morning we took some profits in LIT in the sector model as it is overbought and replaced it with XLB which is oversold. Both trades were for .5%. The trade will slightly reduce net exposure as LIT was overallocated and XLB slightly under-allocated versus the model.
In the equity model, we sold NXPI as it performed poorly versus the tech sector and its weakening from a technical perspective. As we discussed this morning the tech sector is overbought as well.
In the sector model, we reduced XLY and XLV by 1% each to reduce exposure to overweight sectors that are overbought.
Given the plunge in yields, there is something not “quite right” with the market. We are taking our DIA trading position off for now at a very small loss to reduce our overall equity exposure. If the current sell off begins to gain some traction we will take further risk reduction actions.
Equity & ETF Model
Sell 100% of DIA
July 7, 2021
*** Portfolio Trading Alert *** – Dynamic Model (Beta Test Termination)
This morning we are liquidating the entire Dynamic Model portfolio. The portfolio algorithm we have been testing has not been operating to the degree that we are searching for. Some of the performance issues are derived from the current “breadth problem” of the market, the other has been the rather rapid rotations with the internals. The algorithm did not compensate adequately for the current environment.
Therefore, we are liquidating the entire model portfolio and will rebuild and relaunch the model by the end of the summer. If you have been tracking the Dynamic model, switch over to the Equity model for now as holdings are not too dissimilar.
We are reducing ADBE back to its original portfolio weight of 2% after a nice run lately that took the holding back to more extreme overbought conditions.
We are increasing AMLP to 2% of the portfolio in the ETF Sector model on the dip this morning to balance our Energy exposure and increase portfolio yield.
Equity Model
Reduce ADBE to 2% of the portfolio.
ETF Model
Increase AMLP to 2% of the portfolio.
*** Portfolio Trading Alert *** Dynamic Models (Beta Test Model)
This morning we are making a couple of changes to the portfolio model at the open.
We are reducing CVS by 50% due to the technical failure at the 50-dma. We like the position going forward but the failure suggests we could see some lower prices to rebuild the position into.
KNX just has not performed well. We took profits previously at higher prices, but we are going to sell the rest of the position today and remove a laggard from the portfolio.
We are light on industrial exposure so we are adding a 3% position in Raytheon Technologies (RTX) which is about to trigger a fairly oversold money-flow buy signal.
With the Biden Administration potentially passing an infrastructure bill in the next couple of months that will fund 5g expansion, we are adding a 3% weight in VZ. Like RTX, it too is in an oversold position and on support and close to a buy signal with a 4% yield.
Dynamic Models
Initiate a 3% position of the portfolio in VZ and RTX.
This morning we sold 1.5% of XOM and replaced it with 1.5% of AMLP in the equity model. We are picking up extra dividends and the technical backdrop looks better on AMLP than XOM.
We added 7.5% of GSY to both portfolios this morning. The purpose is to sop up extra cash and improve our yield in the fixed income portfolio until we decide to increase our duration.
Equity & ETF Models
Initiate a 7.5% position in GSY
June 28, 2021
*** Portfolio Trading Alert *** All Models
This morning we added a 5% trading position in DIA (Dow ETF) in all models. Our cash flow indicators signal an upward trend and historically the first two weeks of July are good for the markets. Beyond mid-July the market tends to consolidate or dip into the fall months, so we added a trading position now versus adding to individual holdings as it may likely be a short-term position.
In our beta testing model (Dynamic) we are adding some financials given the clearance of the stress test last week, and the recent sell-off.
With the markets holding the 50-dma and firming up a bit, we are increasing equity exposure in areas where money flow “buy signals” are triggering. We were underweight discretionary holdings in the Equity and ETF models so those weights were brought up.
In the Dynamic Model we added the same holdings is in the Equity model but also increased exposure to UPS for the transport sector.
Overall, the money flow “sell” signal for the overall market remains in place with a confirming MACD sell signal. While the market is hitting an all-time high, such is not unusual given past cycles. A correction is still possible while the sell signal is in place, so we continue to maintain a slightly higher level of cash currently.
*** Portfolio Trading Update *** Dynamic Model (Beta Portfolio)
The Dynamic Model, that we launched in January has had a bumpy start with the model algorithm getting whipsawed a good bit by the Nasdaq selloff in February and March, and then the rotational trade over the last month or so. However, we are honing in on the model allocation and should have a functional model in place by the end of the year.
Trades
Initiate a 3% position of the portfolio in KHC, ADSK, and UNH.
*** Portfolio Trade Alert *** Dynamic Model (Beta Test Portfolio)
We continue working on getting this model balanced correctly, and are making some additional rebalancing changes this morning. We also got stopped out of our GOLD and SLV trades.
Initiate a 1.5% position in AVGO
Sell 100% of SLV
Sell 100% of JPM
Sell 100% of GOLD
Initiate a 1.5% position in AMAT
Sell 100% of MCHP
Add 1.5% to OSTK
Add 1.5% to QRVO
Reduce FANG, XOM, MRO, and KMI by 50% each.
Add 1.5% to CVS
Sell 100% of TPR
Note: There was an error in the transaction report on FANG. On 6/10/21 we sold 18 shares of FANG at $87.245 but the system did not report the transaction. We caught the error in today’s rebalance.
*** Portfolio Trade Alert *** Equity & ETF Models
We are rebalancing exposures in the Equity and ETF models slightly this morning.
This morning we adjusted our models to reduce commodity risk. in the Equity model, we sold all of KMI (1.5%), and we were stopped out of GOLD (2%). We added 1% of CVS which is turning on a nice buy signal and in a sector we like. In the Sector model, we sold 1% each of AMLP and XLE. Our equity exposure is just north of 50%.
As discussed over the last few weeks in our weekly newsletter, we are coming upon the confluence of daily and weekly signals turning negative for a wide swath of sectors, stocks, and broad indexes. As such, we are reducing our net exposure by 3.5% to 53% in both models. At the same time, we are adding to a few sectors/stocks that have positive technical outlooks.
Equity Model:
AAPL – reduce position by 1/2% of the portfolio.
ABBV – increase the position by 1% of the portfolio.
ADBE – reduce position by 1/2% of the portfolio.
ALB – reduce position by 1 and 1/2% of the portfolio.
FANG – reduce position by 1/2% of the portfolio.
CVS – increase the position by 1/2% of the portfolio.
GOLD – increase by +1 of the portfolio.
JNJ – increase the position by 1/2% of the portfolio.
MSFT – reduce the position by 1/2% of the portfolio.
PSA – reduce the position by 1/2% of the portfolio.
RTX – reduce the position by 1/2% of the portfolio.
UNP – sell 100% of the position.
UPS – increase the position by 1% of the portfolio.
V – reduce the position by 1/2% of the portfolio
Sector Model:
XLV – increase the position by 2% of the portfolio.
XLK – reduce the position by 2.5% of the portfolio
LIT – reduce the position by 1% of the portfolio
IYT – reduce the position by 1/2% of the portfolio
XLB – reduce the position by 1/2% of the portfolio
XLE – reduce the position by 1/2% of the portfolio
XLF – reduce the position by 1% of the portfolio
XLI – reduce the position by 1/2% of the portfolio
XLU – increase the position by 1% of the portfolio
Dynamic Model
JPM – reduce the position by 1/2% of the portfolio.
XOM – reduce the position by 1/2% of the portfolio.
MRO – reduce the position by 1/2% of the portfolio.
SLV – initiate a 2% position of the portfolio.
KNX – sell 50% of the position.
JNJ – increase position by 1/2% of the portfolio.
ALB – reduce by 1% of the portfolio.
GOLD – initiate a 2% position of the portfolio.
Money Flow Signal
I have been getting many emails lately about how to gain access to our proprietary money flow indicator that Mike and I use to manage our client portfolios.
We hear you and it is coming.
We have 2-huge projects underway currently with our programmers.
A complete website redesign to improve the look, feel speed, and efficiency of the site.
Integration with Interactive Brokers so that you can have access to multiple models on the site and have them automatically traded for you. OR, you can manage your own portfolio and have full reporting on the site.
We have many more features we are adding to the site as well from curated stock lists, to portfolio model management and model backtesting.
AND YES….We are currently working on the RIA PRO Money Flow indicator that you will have access to once we get all the bugs worked out of the coding. Here is a snapshot of where we are currently.
Click to enlarge
Thank you for your patience and for using our service. We are constantly working to improve the site into a “must-have” tool for investors.
Your comments, criticisms, and suggestions are ALWAYS welcome.
We closed out the remainder of our QQQ position as our indicators are now aligning for the next sell signal. We should begin to see technology underperform relative to the broad index over the next couple of weeks.
With our “money flow” buy signal now getting fairly elevated we trimmed off another 1% of our QQQ position this morning in both models. We will likely exit the entire position by the end of the week.
In the Equity model, we also reduce Ford (F) by 1.5% (down to 2% of the portfolio) to take profits after a strong price surge last week.
*** Portfolio Trade Update *** – Dynamic Model (Beta Test) Only
We recently added exposure for the “money flow” buy signal which worked well. However, that signal is now beginning to get extended in some stocks and oversold in others. Therefore, we are rebalancing the model by selling/trimming overbought stocks and adding to oversold positions.
(NOTE: I had a trade error and bought SWKS rather than selling. I have corrected that error.)
Full Portfolio Rebalance
FANG – Add 1% to the position
MRO – Add 1% to the position
AMZN – Sell 50% of the position
NEE – Sell 50% of the position
QRVO – Reduce portfolio position by 50%
GOOG – Reduce portfolio position by 50%
SWKS – Sell 100% of the position
MCHP – Sell 50% of the position
AAPL – Reduce by 50%
MSFT – Reduce by 50%
ETSY – Sell 100% of the position
ALB – Add 1% of the portfolio to the position
SQ – Sell 100% of the position
ABBV – Add 1% of the portfolio to the position
BRK.B – Add 1.5% of the portfolio to the position
WMT – Sell 100% of the position
CRM – Sell 100% of the position
TPR – Add 1.5 % of the portfolio to the position
KNX – Add 1% of the portfolio to the position
KMI – Add 1.5% of the portfolio to the position
XOM – Add 1.5% of the portfolio to the position
NFLX – Sell 50% of the position
ADBE – Sell 50% of the position
PG – Sell 50% of the position
JPM – Add 1% of the portfolio to the position
OSTK – Sell 50% of the position
May 27, 2021
COST reported GAAP EPS of $2.75, which topped the consensus estimate of $2.34. Revenue of $45.3B beat expectations of $43.8B, while membership fees increased 11% YoY, coming in 3.1% above the consensus estimate. We currently hold a 1.5% position in COST in our equity model.
This morning we reduced our 4% QQQ position in both models by 1% to 3% of portfolio. The technical signals that led us to buy are getting extended, so we are just taking some profits. When our signals begin to suggest a “sell signal” is approaching we will remove the rest of the position.
We are also adding 2% AMLP in both models as it technically looks strong and we think inflationary stocks will have decent relative outperformance in the coming days. This is a trade for a near-term bump in inflationary pressures and picking up an 8% dividend yield at the same time.
The buy signals on the Dow and S&P are not as extended as the NASDAQ.
Equity & ETF Models
Reduce the 4% position in QQQ to 3% of the portfolio.
Click the link above to add TPA Daily Reports and Long/Short trading ideas to your subscription.
REASONS TO BE CAUTIOUS. MITIGATING FACTORS. SIGNALS TO WATCH FOR REAL PROBLEMS.
Since March 23, 2020, the U.S. stock market has enjoyed a consistent rally. The S&P500 is up 87% since the Covid-19 March 2020 panic low. Many investors, money managers, strategists and analysts are rightfully concerned about the rally’s longevity and the levels of equity prices. Examining the measures TPA has used for over a decade, TPA is also concerned. At the same time, TPA is mindful that many mitigating factors are supporting the current rally. Some of these factors are historic. In this report, TPA will examine why clients are justified to be cautious, while acknowledging the factors that have and do support stock prices. Finally, TPA will provide signposts that clients should monitor to determine when the likelihood of a sell-off will increase.
Caution
Historically high valuations
Bubble characteristics
The level of margin used by stock investors is at a historic high
Mitigating factors
Reduced number of shares for investors to buy
FED activities
Fiscal stimulus
Low rates
What to watch for that things are changing
FED tapering or tightening
House price declines
Sustained weakening in consumer demand
Technicals.
Sustained risk-off signals
50 DMA’s of the major indexes starting to decline
Earnings announcement show negative price bias
Junk Bond Risk premium widening
May 26, 2021
Amazon (AMZN) has reached an agreement to acquire MGM for $8.45B. The move will strengthen the positioning of Prime Video versus competitors in the ongoing “streaming wars.” AMZN will receive a catalog of more than 4,000 movies and 17,000 TV shows from the acquisition.
Ford (F) is trading higher this morning as they reaffirmed their commitment to electric vehicles (EV). Further, they intend to hit long-term operating margin goals, despite the ramped-up EV production and R&D expenses.
“The company said during an investor day on Tuesday it will spend $30 billion on electric vehicle development — including battery development — by 2025. Previously, the auto giant said it would spend $22 billion on its EV ambitions by 2023. The company anticipates that 40% of its global vehicle volume will be fully electric by 2030 fueled by new models of the electric Mustang Mach-E and F-150“- Yahoo Finance
May 24, 2021
Feature Upgrade – Reminder
In case you missed it, we have now put a full technical overview under the RESEARCH / CHARTS tab. The new charting system now allows you to save your technical setups and has a wide range of indicators to choose from – so customize your layouts the way you like them. Then click the TECHNICAL TAB to see a full technical review of the stock you are looking at.
Technical Gauge (Now live under the Macro/Market Internals Link)
Fear/Greed Gauge (Also Live)
Risk / Reward Ranges – XLK, XLC, and XLY now in buy territory.
May 20, 2021
*** Portfolio Trading Update *** Equity Model (Updated)
We added 1% to Ford (F) increasing our total position to 3%. The stock broke out of its previous downtrend and pushed above the 50-dma. We expect that at some point, the company will re-establish its dividend which will help total returns in the future. For now, it is a trading position until that transition occurs.
Equity & ETF Models
Add 1% of the portfolio into F increasing total weighting to 3%.
May 19, 2021
*** Portfolio Trading Update *** Equity & ETF Model
In both models we added 2.5% of TLT and 1% QQQ, bringing QQQ up to 4%. We are adding TLT in part for technical reasons as it’s very close to its 200 dma and getting ready to turn up on a money signal. Further, it may provide a little insurance if the recent downtrend in equities continues.
Equity & ETF Models
Initiate a 2.5% position in TLT
Add 1% of the portfolio into QQQ increasing total weighting to 4%.
May 18, 2021
*** Portfolio Trading Update *** Equity Model Only
We trimmed back CVS to model weight into the market close today (2% of the portfolio) after a big move higher. We still like the position longer-term on a fundamental basis but it needs a correction to add to the position.
Note: The full history of the Technical Gauge and Fear Greed Gauge is now under Macro/Market Internals. We are working to have them overlaid against the S&P 500 index.
Technical Gauge Is Still High But Has Declined
Fear/Greed Gauge Is Back Into The “Neutral Zone”
Risk/Range Analysis Shows Technology & Discretionary As Opportunistic
May 14, 2021
*** Portfolio Trading Update *** Dynamic Model (Beta Test)
The Dynamic Model, launched in January, is still in beta testing.
We are closing out the rest of our position in LEN after a huge run and starting to see relative weakness in pricing.
Dynamic Model
Sell 100% of LEN
May 13, 2021
*** Portfolio Trading Update *** Equity & ETF Model
We are continuing to build a trading position in QQQ for an approaching “buy signal” on our “money flow” indicator. After our initial add of 2% of the portfolio, we are increasing the position by another 1% bringing the total portfolio weight to 3%.
Equity & ETF Models
Add 1% of the portfolio to the existing position in QQQ
May 12, 2021
*** NEW FEATURE UPDATE ***
Every week in the newsletter we publish the FEAR / GREED Gauge and our TECHNICAL GAUGE
We have gotten a lot of requests for the history of gauges. We have now published them under the MACRO tab along with our other market indicators.
We will be adding a comparison to the S&P here soon, but we wanted to let you know these two charts are now available.
Click to enlarge images
Menu
Guages
*** Portfolio Trading Update *** Dynamic Model (Beta)
Reminder note:
The Dynamic Model, launched in January, is still in beta testing. We are working through the modeling of the portfolio methodology. We should have the model finished by the end of this year as we work through various market dynamics and weightings.
Currently, the performance of the model is not working as expected due to the shift in inflation, and economic, expectations. As such, we are tweaking the model to compensate. However, it will take a few months before that alignment to the benchmark is complete.
Dynamic Model
Taking profits in CVS and reducing the position from 3% to 2% of the portfolio.
In today’s 3 Minutes on Markets & Money we discussed that the NASDAQ is relatively oversold versus the S&P and DJIA.
The graph below helps provide some risk levels on the NASDAQ (QQQ). Since the market rout last March, QQQ has fallen below its 50-day moving average three times. The second graph shows its deviation from the 200-day ma. It is still about 10% above the average. As discussed, the NASDAQ is over-sold on a short-term basis but not a long-term basis. There is a potential opportunity here but it entails a good eye on risk management.
We are going to build into a position of QQQ over the next several trading days looking for a relative pickup in performance relative to the S&P 500. We are starting with a 2% position in QQQ and will add to it if we get further weakness.
Equity & ETF Model
Initiate a 2% trading position in QQQ
May 10, 2021
*** Portfolio Trading Update *** All Models
We are taking some profits in the Equity and ETF Models in more grossly extended positions. In the Equity model, we are paring back to model weights of 2% in UPS and ALB back to 4% of the portfolio. In the ETF model, we reduced IYT (Transportation) back to model weight as well.
In the Dynamic model, we added to FANG and initiated a new position in MRO as we continue to rebalance that portfolio as well.
Fear/Greed Gauge Still Elevated But Off Of Recent Highs
Risk/Reward Ranges Not Optimal – But Technology Has Worked Off Extremes
May 7, 2021
*** Portfolio Trade Update *** Dynamic Model
With our “money flows” on some of the technology names getting very oversold, we are adding some exposure back to holdings that we previously sold at higher levels. We are also adding a bit more to basic materials with an addition of Linde (LIN).
*** Portfolio Trade Update *** All Models (Update)
In the Equity and ETF models we are adding to our “inflation” plays by adding a starter position to Barrick Gold (GOLD) in the equity portfolio and adding to Industrials (XLI) in the ETF Model.
In the Dynamic Model, after a selling half our stake in SQ at higher prices, we are adding back to our holdings. We are also adding back to ALB with the recent selloff taking our position size back to 3%.
Equity Model
Initiate a 1% “Starting” position in GOLD
ETF Model
Increase XLI from 2% to 3% of the portfolio.
Dynamic Model
Increase SQ from 1.5% to 3% of the portfolio.
Increase ALB to 3% of the portfolio.
May 5, 2021
ALB reported GAAP EPS of $0.84 compared to the consensus estimate of $0.80 per share. Revenue came in above consensus at $829.3M versus expectations of $757.1M. Despite beating top and bottom-line estimates, the stock is currently trading 2.5% lower post-market. Management’s decision to leave fiscal year 2021 guidance unchanged appears to be weighing on the stock.
May 4, 2021
CVS reported GAAP EPS of $1.68, which beat expectations of $1.33. Revenue also beat expectations, coming in at $69.1B versus the consensus of $68.35B. In addition to the positive figures, CVS raised full-year guidance for GAAP EPS to $6.24 to $6.36 from $6.06 to $6.22. This represents an increase of 2.6% at the midpoint as well as a tightening in the range of guidance. The stock is currently up 2.8% pre-market.
Yesterday we reported FANG fell short on EPS estimates but beat revenue expectations. The paragraphs below from Bank of America provide a nice summary of FANG’s earnings report and their rationale for slightly increasing the price target to $104 from $100 per share.
May 3, 2021
FANG reported GAAP EPS of $1.33, which missed the consensus estimate of $1.89. Conversely, revenue of $1.2B beat expectations of $1.02B. Today FANG announced the divestiture of three of its non-core operating assets for total consideration of $832M, which will help the company accelerate its debt reduction program and continue strengthening its balance sheet.
*** Portfolio Trade Update *** Dynamic Model
Diamond Back Energy (FANG) is going to report earnings this week and we expect a substantial beat of earnings. With a fairly close stop-loss, and the MACD about to register a buy signal, the risk-reward is favorable.
We were stopped out of PINS and PLTR after selling 50% of the positions a couple of weeks ago.
With the breakout of the consolidation of ABBV, we are adding a 3% weight to the portfolio. The same for WMT which just broke out of a downtrend from previous all-time highs.
After taking profits previously in CVS, JNJ and PG, we are increasing those positions back to size for the next “buy signal.”
Buy 1.5% of FANG with a stop-loss at $73.50
Selling 100% of PINS and PLTR – violations of stop-loss after previous 50% sells.
Initiate a 3% position in ABBV
Initiate a 3% position in WMT
Increase JNJ, CVS, and PG from 1.5% of the portfolio to 3%.
Risk / Reward Ranges Reset For May – Long-Term Deviations Unsustainable.
*** Portfolio Trade Update *** All Models
In the Equity and ETF Models, we are reducing Real Estate just a “smidge” to take profits in a sector that has gotten extremely overbought. In the Dynamic Model, we sharply reduced equity exposure with the previous sell signal. With the next “buy signal” approaching, we are looking to add to fundamentally strong stocks that got hit recently during earnings announcements, and are holding near support levels.
We are also initiating two new positions in the Dynamic of KNX (Knight Transportation) and OSTK (Overstock.com). With the demand for freight very high, we like the transportation sector and have no previous exposure. Overstock is an interesting play because if they sell off their “retail” business, we can acquire their “blockchain” business essentially for free. We are starting with 1/2 positions and will add to accordingly.
Equity Model
Reduce PSA from 2% to 1.5% of the portfolio.
ETF Model
Reduce XLRE from 3% to 2%.
Dynamic Model
Initiate a 1.5% position in OSTK
Initiate a 1.5% position in KNX
Increase NFLX from 1.5 to 3% of the portfolio.
Increase JPM from 1.5% to 3% of the portfolio.
ABBV reported GAAP EPS of $1.99, which easily beat expectations of $1.47. Revenue of $13B came in slightly above the consensus estimate of $12.8B. Management has raised guidance for full-year 2021 EPS to $7.27-$7.47 from $6.69-$6.89, an increase of 8.5% at the midpoint.
XOM reported GAAP EPS of $0.64 for the first quarter of 2021, which beat expectations of $0.57. Revenue also beat expectations, coming in at $59.2B versus the consensus of $56.5B. The positive results were driven by a combination of higher commodity prices and XOM’s focus on structural cost reduction.
April 30, 2021
*** Portfolio Trade Update *** All Models
In the Equity and ETF Models, we are reducing Real Estate just a “smidge” to take profits in a sector that has gotten extremely overbought. In the Dynamic Model, we sharply reduced equity exposure with the previous sell signal. With the next “buy signal” approaching, we are looking to add to fundamentally strong stocks that got hit recently during earnings announcements, and are holding near support levels.
We are also initiating two new positions in the Dynamic of KNX (Knight Transportation) and OSTK (Overstock.com). With the demand for freight very high, we like the transportation sector and have no previous exposure. Overstock is an interesting play because if they sell off their “retail” business, we can acquire their “blockchain” business essentially for free. We are starting with 1/2 positions and will add to accordingly.
Equity Model
Reduce PSA from 2% to 1.5% of the portfolio.
ETF Model
Reduce XLRE from 3% to 2%.
Dynamic Model
Initiate a 1.5% position in OSTK
Initiate a 1.5% position in KNX
Increase NFLX from 1.5 to 3% of the portfolio.
Increase JPM from 1.5% to 3% of the portfolio.
ABBV reported GAAP EPS of $1.99, which easily beat expectations of $1.47. Revenue of $13B came in slightly above the consensus estimate of $12.8B. Management has raised guidance for full-year 2021 EPS to $7.27-$7.47 from $6.69-$6.89, an increase of 8.5% at the midpoint.
XOM reported GAAP EPS of $0.64 for the first quarter of 2021, which beat expectations of $0.57. Revenue also beat expectations, coming in at $59.2B versus the consensus of $56.5B. The positive results were driven by a combination of higher commodity prices and XOM’s focus on structural cost reduction.
April 29, 2021
AMZN reported first quarter GAAP EPS of $15.79 as compared to the consensus estimate of $9.61. Revenue of $108.5B (+43.7% YoY) came in well above expectations of $104.6B. For the second quarter of 2021, AMZN has set guidance for revenue of $110-$116B, or 24-30% growth YoY. The stock is currently trading 4.7% higher in the post-market session based on the strong results.
April 28, 2021
PSA reported core FFO of $2.82 per diluted common share, which beat expectations of $2.71 per share. Revenue of $647.8M missed the consensus estimate of $759.3M. PSA saw same-store revenue growth of 3.4% YoY. The company acquired ezStorage for $1.8B during the quarter, which the CEO- Joe Russell, referred to as “one of the highest quality self-storage portfolios in the United States”.
AAPL reported GAAP EPS of $1.40, which easily beat the consensus estimate of $0.98. Revenue of $89.6B beat the consensus estimate of $77.3B. Further, revenue beat expectations in each major product category. In addition to the positive top and bottom-line data, AAPL raised its dividend to $0.22 per share (+7%).
F reported GAAP EPS of $0.81 for the first quarter of 2021, which smashed the consensus estimate of $0.18. Automotive revenue also came in above expectations, measuring $33.6B versus expectations of $32.2B.
Despite the strong results, the stock is down 2.9% in the post-market session. John Lawler, CFO, commented that the semiconductor shortage facing the auto maker will likely get worse before it gets better- due to a fire that occurred in March at supplier plant in Japan. The company expects the shortage to bottom out in the second quarter and improve throughout the rest of the year, but now expects to lose up to 50% of its planned second quarter production.
April 27, 2021
V reported GAAP EPS of $1.38, which beat the consensus estimate of $1.28. Revenue came in at $5.7B (-2.6% YoY), finishing slightly above expectations of $5.56B. Payments volume increased 11% YoY, while total processed transactions increased 8% YoY. Conversely, cross-border total volume decreased 11% YoY.
MSFT reported GAAP EPS of $2.03 versus expectations of $1.77. Revenue of $41.7B (+19.1% YoY) beat the consensus estimate of $40.85B.
GOOG reported GAAP EPS of $26.29, which beat the consensus estimate of $15.67. Revenue of $55.3B (+34.4% YoY) came in well above expectations of $51.7B.
RTX reported GAAP EPS of $0.51, which missed the mark by $0.30. Revenue of $15.3B was slightly below expectations of $15.4B. With first quarter sales and adjusted EPS coming in above management’s expectations, RTX has boosted the low end of its 2021 guidance for sales and adjusted EPS.
UPS reported impressive first quarter results this morning. GAAP EPS of $5.47 beat expectations of $1.68, while revenue of $22.9B similarly beat expectations of $20.7B. Average daily volume increased by 14.3% YoY. Of note, $2.70 of the EPS was driven by a reduction in the pension liability arising from re-measurement required under the ARPA. The stock is currently up 7.2% in pre-market trading.
April 26, 2021
NXPI reported first quarter GAAP EPS of $1.25, which beat expectations of $1.21. Revenue also beat expectations, coming in at $2.6B versus the consensus of $2.5B.
*** Portfolio Trade Alert ***
Both Equity and ETF Models
We are selling 100% of our gold position in IAU. We bought it for a trade and it looks as if that move has been completed. Taking the small gain and will re-evaluate the position for another opportunity.
KMI released its earnings data yesterday after the market close. GAAP EPS of $0.62 smashed market expectations of $0.23, and revenue of $5.2B ended up much higher than expectations of $3B. A driving factor behind the stellar results was the winter storm that hit Texas in February. Even though KMI recognized that benefit as temporary, the firm raised its quarterly dividend by 2.9% to $0.27 per share.
April 21, 2021
NEE reported earnings for the first quarter of 2021 this morning. GAAP EPS of $0.84 beat expectations of $0.55 per share, while revenue of $3.7B missed expectations of $4.9B. Management has guided to adjusted EPS between $2.40 and $2.54 for fiscal year 2021 with 6% to 8% growth in adjusted EPS in 2022 and 2023.
VZ reported GAAP EPS of $1.27 compared to expectations of $1.28, a slight miss. Revenue for the first quarter was $32.9B (+4.0% YoY), which beat estimates by $440M. VZ saw wireless post-paid net adds of -170k versus expectations of +82k for the quarter.
April 20, 2021
NFLX reported GAAP EPS of $3.75, which beat expectations by $0.78. The firm reported revenue of $7.2B for the first quarter of 2021, which came in $20M above the average estimate. Looking beyond the positive top and bottom-line figures, paid net additions for the quarter were 4M versus Management’s guidance of 6M. NFLX is currently trading almost 10% lower in the post-market session.
*** New Feature ***
(You may need to log out and log back in to see the new Technical Analysis)
We have added a new Technical Overview under RESEARCH/CHARTS which provides buy/sell analysis based on a range of technical indicators.
Click Image To Enlarge
ABT reported GAAP EPS of $1.00, which beat the average estimate by $0.09. However, revenue of $10.5B missed analyst estimates by $170M. Organic revenue growth was 32.9% YoY including COVID-19 testing related effects, and 5.7% YoY excluding COVID-19 testing related effects.
JNJ reported GAAP EPS of $2.32, which beat the average estimate by $0.22. Similarly, revenue of $22.3B beat analyst estimates by $280M. The positive results were led by above market growth of the Pharmaceutical business and continued recovery in Medical Devices, according to the CEO, Alex Gorsky.
PG reported GAAP EPS of $1.26, which beat by $0.07. Revenue also beat estimates, coming in at $18.1B versus the expectation of $17.95B. Organic sales growth increased 4% YoY; 2% of this was driven by increased prices and 2% by positive product mix.
April 19, 2021
*** Portfolio Trade Update ***
As noted in this past weekend’s newsletter, our “money flow” buy signal is very extended and is starting to roll over. As such we are now beginning to cut exposure in portfolios and raise cash levels. We are preparing to add a short-S&P 500 index position once the “sell signal” engages.
We removed half of our 5% SPY position in both models this afternoon, bringing them both down to 2.5%. Our money flow models will turn bearish over the next day or two and we decided to take some profits.
April 14, 2021
*** Trading Update – Dynamic Model ***
Taking some profits in LEN and SQ which have had big runs lately and are extremely overbought. Adding a position of MSTR with a stop at $675 to potentially trade against the Coinbase IPO. Technically signals are oversold and turning up so there is some upside to about $900 as long as current uptrend support holds.
Take Profits – reduce LEN to 1% of the portfolio.
Take Profits – reduce SQ to 3% of the portfolio.
Initiate 5% of MSTR with a stop at $675
JPM reported GAAP EPS of $4.50, which beat analyst estimates by $1.38 or 44%. Revenue came in at $32.3B, 6.6% above the average estimate of $30.3B. The results were driven by a large decrease in loan loss reserves of $5.2B (contributing $1.28 to EPS).
GS reported GAAP EPS of $18.60, which came in 86% above analyst estimates. Revenue for the first quarter was $17.7B compared to estimates of $12.7B, a 39% surprise.
In both cases the strong results were driven by record Investment Banking, Trading, Asset Management revenues and a significant increase in Global Markets revenues. We hold 2% of each stock in our Equity Model.
Just prior to the initiation of the “money flow buy signal,” we added two leveraged index positions to the Dynamic Model. With the sharp rally, and with markets back to more extreme overbought conditions, we are taking those profits and reducing equity risk a bit.
Dynamic Model
Selling 100% of QLD and SSO
PORTFOLIO TRADING UPDATE – 04-06-21
We added 2.5% of IAU this morning in both models. Gold is setting up nicely on a technical and money flow basis with reliable stop-loss levels not far below. The trade also aligns with the thought that the market is looking beyond the next few months of strong economic data and questioning whether the reflation trade will still have legs come later summer and fall.
EQUITY & ETF MODELS
Initiate a 2.5% position in IAU / Stop-Loss is $16
NOTICE – SITE DATA ISSUE!
We are having a data issue this morning on numerous pages.
Please bear with us as we fix the problem.
PORTFOLIO TRADING UPDATE – 04-05-21
We sold TLT this morning in both portfolios. We had TLT on a tight leash and given strong economic data and money flows were rolling back over on TLT, we thought it best shorten-duration in portfolios back to previous levels. We are significantly underweight our benchmark weight in terms of bond duration at the current time.
Wishing you a very “Good Friday” and a Happy Easter.
As noted yesterday, we added to individual positions yesterday within portfolio models, and today we added our “trading index” positions to all models. As noted, with the quarter-end rebalancing behind us, and with April being one of the strongest performance months of the year within the seasonally strong cycle, we are upping exposure short-term to participate with a breakout to new highs.
Equity Model:
Reduced SHY to 10% of the portfolio
Added a 5% position in SPY
ETF Model
Reduced SHY to 10% of the portfolio
Added a 5% position in SPY
Dynamic Model
Added 3% TSLA
Added 1/2 position (3%) of SSO to the portfolio.
Added 1/2 position (3%) of QLD to the portfolio.
March 31, 2021
*** Portfolio Trading Update – All Models***
With our S&P 500 “money flow” models turning positive, along with money flows, we are adding exposure to portfolios for what tends to be a historically strong April period. We are doing this in two phases – adding individual positions today, and shortly, we will add trading index positions in SPY and QQQ.
Equity Model:
Increased ALB to 4% of the portfolio.
Initiated a 2% in NXPI
Initiated a 2% in F
Selling 100% of CRM
ETF Model
Added 1% to LIT increasing weight to 4%
Dynamic Model
Increased AAPL from 3% to 3.5% of the portfolio
Added to SQ increasing weight to 3.75% from 3%
Added to ALB increasing its weighting to 3.5% from 3%
While our S&P indicator is still in sell mode, energy and financials, are starting to turn up. They went into sell mode well before the broader market so are coming out sooner. As such, we added back to energy and financials.
Equity Model:
Added .5% to KMI, XOM, and FANG
Added .5% to GS and JPM
ETF Model
Added 1% to XLE and XLF
Dynamic Model
Added .5% to KMI and XOM
Added .5% to JPM
March 24, 2021
*** Portfolio Trading Update – Equity and Sector Models ***
With our models pointing to potential short-term turbulence in the equity markets and potential upside in bond prices (as discussed in Three Minutes on Markets), we increased our bond portfolio duration and equity hedge by swapping IEF for TLT. We also put extra cash to work by adding to our short-term bond position (SHY). We will redeploy SHY into stocks and or bonds when needed.
Equity and Sector Model:
Sold 6% IEF and Bought 6% TLT
Added 7% SHY
March 23, 2021
*** Portfolio Trading Update – All Models ***
With our daily “money flow” indicators very close to turning negative, with money flows negative as well, we are reducing equity risk across all models slightly.
Equity Model:
Selling 100% of MRO to reduce our overweight energy holdings.
Selling 100% of ZM reducing our exposure to communications and a sector laggard.
Initiating a 1% position in PG to add to our Consumer Staples (defensive) holdings.
Fear / Greed Gauge Remains Very Elevated Despite Recent Volatility
Technical Gauge Remains Overbought Currently
Risk/Ranges Suggest Market Still Not A Good Buy
March 18, 2021
*** Portfolio Trade Update – Dynamic Model ***
Portfolio Managers: Nick Lane/Lance Roberts
We are selling our entire stake of TSLA this morning. We bought it previously at support which failed. The recent rally ran back into our previous support and failed again. We simply had bad timing on this trade. We are closely evaluating all of our positions now and continue to raise cash.
Sell 100% of TSLA
March 16, 2021
*** Portfolio Trade Update – Equity, Sector and Dynamic Model ***
Portfolio Managers: Michael Lebowitz/Lance Roberts
After a nice run-up in the banks/financials, we are taking some profits.
Equity model- reduce GS and JPM from 2% to 1.5%
Sector model- reduce XLF from 4% to 3%
Dynamic model- reduce JPM from 3.5% to 2.5%
*** Portfolio Trade Update – Dynamic Model ***
Portfolio Managers: Nick Lane/Lance Roberts
We are initiating a 3% position in Tapestry (TPR) which is a high-end retailer of luxury goods. With stimulus checks coming in and the economy reopening there is potential upside for TPR.
Initiate a 3% position of TPR with a stop-loss at $40.
With our short-term money flow indicator turning positive yesterday we are adding exposure to all of our portfolios. Primarily, we are just bringing positions that recently sold-off back up to model weights but we are increasing sizing in APPL and MSFT to 3.5% of the portfolio and bringing ABT, ABBV, JNJ and CVS up to 2% each after reducing those positions previously. In the Dynamic Model which is very technology-heavy, we are adding a bit of industrial and healthcare exposure as well to broaden out the allocation model.
Equity Model
Increase allocation to AAPL and MSFT to 3.5% of the portfolio.
Bring NFLX and ZM up to 2% of the portfolio.
Add 0.5% weight to ABBV, ABT, JNJ, and CVS increasing total exposure to 2% each.
ETF Model
Increase XLV to 8% of the portfolio.
Increase XLK to 12.5% of the portfolio.
Dynamic Model(Still in beta testing)
Reduce BGSF from 5% to 3% of the portfolio.
Initiate a 3% position in JNJ, CSV, and BRK.B each in the portfolio.
March 9, 2021
We recently added NextEra Energy (NEE) to our equity model to increase exposure to utilities and the burgeoning green energy business. NEE is not only the nation’s largest utility company but is heavily investing in green initiatives. We ran across the following Bloomberg article which discusses their latest purchase of Mainspring Energy. Mainspring has invented a non-combustible linear generator that can run on natural gas, bio-gas, or hydrogen.
March 8, 2021
*** Portfolio Trade Update ***
We are using the early morning rally to rebalance portfolios once again as the “energy” trade has gotten way ahead of itself. We also got stopped out of two positions in the Dynamic Model which we are raising some cash to add back into current holdings on the upcoming money flow buy signal.
Equity Model
Reducing all energy holdings back to the model weight of 1% each. – MRO, KMI, XOM, FANG
ETF Model
Reduce XLE back to portfolio model weight of 3% – taking profits.
Reduce XLC back to portfolio model weight of 5% – taking profits.
Dynamic Model
Stopped out of SNOW – sold 100% of the position
Stopped out of ZS – sold 100% of the position.
March 8, 2021
Market Update – Is The Selling Over Yet?
As we have discussed over the last couple of weeks, the weekly money flow sell signals have continued to suggest downward pressures on prices. This past week, the total momentum/green energy trade was taken out behind the “woodshed” and thoroughly beaten. The Dynamic Model, which is a high beta, momentum, allocation (which is still in the testing phase),felt the rotation’s brunt as would be expected.
The question now is whether the selling is over, or is there more to come. For that answer, we need to look at both the daily and weekly charts for the S&P 500 and Nasdaq.
Daily Indicators Getting Extremely Oversold
On a short-term basis, the S&P held important support through last week at the 50-dma. While the correction on the surface looks relatively mild, the turmoil below the surface was somewhat extreme. The previous “go-go” names have experienced a pretty severe bear market decline, while “inflation trades” have been in a “raging bull” market. I don’t recall seeing a market rotation this vicious previously.
As shown below, the “money flow” index (middle panel) is now back to more extreme oversold conditions suggesting a reflexive rally is likely this week. As we will discuss momentarily, we still recommend using this rally to execute portfolio rebalancing actions:
Trim Winning Positions back to their original portfolio weightings. (ie. Take profits)
Sell Those Positions That Aren’t Working. If they don’t rally with the market during a bounce, they will decline more when the market sells off again.
Move Trailing Stop Losses Up to new levels.
Review Your Portfolio Allocation Relative To Your Risk Tolerance. If you have an aggressive allocation to equities at this point of the market cycle, you may want to try and recall how you felt during 2008. Raise cash levels and increase fixed income accordingly to reduce relative market exposure.”
The Nasdaq 100 is even more extremely oversold and holding critical support. We will likely see a counter-trend rally this week in some of the previous “mo-mo” names. As with the S&P 500, we will be using that rally to clean up laggards and add to winners.
Weekly Indicators Suggest We Still May Have Another Round Of Selling
On a longer-term basis, the money-flow indicators on both the S&P 500 and Nasdaq have more room to go before signaling an all-clear. Such is why we are suggesting using a counter-trend rally to lighten exposures and rebalance risk. While money flows have been positive, they are deteriorating rather quickly.
However, it is essential to note that larger market declines generally align with negative money flows, and “consolidations” occur during positive flows.
As shown, the money flows on the S&P remain positive, but are weakening, suggesting more volatility in the short-term as “selling pressure” remains.
The Nasdaq is a little more worrisome at this juncture. The weekly sell signals are entrenched but have not reversed as much as the S&P at this point. Furthermore, the money flows are very close to going negative, so a short-term rally is needed to keep that from happening.
Again, as noted above, this all suggests using rallies to rebalance risk short-term.
The Dollar Rally
As we discussed over the last couple of months, the one thing we were worried about that could disrupt the “reopening” rally was a reversal in the “weak dollar.” More robust employment, economic growth, and inflation pressures are all “fuel” for a stronger dollar. That rally occurred.
The dollar is very overbought short-term. A reversal would provide some support for a counter-trend rally in equities and bonds.
Again, if the economy will improve, particularly with more stimulus, then the dollar rally is likely not complete yet, which supports the idea of “selling into strength.”
As we will discuss on Monday in the market update, the markets are decently oversold on a money flow basis suggesting a short-term rally is likely. We will be using that rally to rebalance holdings.
However, we did use today’s early sell-off to continue building into recent portfolio additions of ALB and LIT.
Equity Model
Add 1% to ALB increasing portfolio exposure to 3%.
ETF Model
Add 1% to LIT increasing portfolio exposure to 3%.
March 1, 2021
*** Portfolio Trading Update – All Models ***
We are “greening up” our portfolios a bit today by adding some positions in a NEE (Nextera Energy) and LIT(Lithium & Battery Tech.) After a decent pullback to support last week that held, we are able to add a little “momentum” to the portfolio for the time being.
Equity Model
Initiate a 2% position in NEE
ETF Model
Reduce XLB from 3% to 2% in the portfolio
Initiate a 2% position in LIT
Dynamic Model
Initiate a 3% position in NEE
Market Update
We have warned for a while a correction was likely as interest rates and inflation were showing increases. That correction came with a vengeance last week. The question is where do we go from here and why some troubling chart patterns are starting to develop.
S&P 500 Index
The good news is that the S&P 500 held its 50-dma during its recent selloff. With the market getting back to more oversold levels, we are likely to see a counter-trend rally for a few days that could get us back above the 20-dma. It will be necessary for the rally to set new highs to negate the “head and shoulders” pattern. If the market rallies, fails and breaks the neckline, we could well see a deeper correction ensue.
Nasdaq Index
The “head and shoulder” pattern is defined better in the Nasdaq. Currently, the neckline support needs to hold, or we will see a more significant correction in the technology sector. With the index more oversold than the S&P 500, I suspect we will see a rally shortly in these stocks, which we will use as a “selling” opportunity to reduce exposure.
Emerging Markets
Like the Nasdaq, we see a very well-defined “head and shoulders” pattern developing here as well. Like the Nasdaq, Emerging Markets are very oversold at current levels, so a counter-trend bounce is likely. A failure at the 20-dma is likely an excellent point to reduce exposure to these cyclical sensitive areas. If economic growth weakens in the U.S., we could see a much deeper correction in Emerging Markets. Watch for a break of the neckline as a “stop-loss” for now.
International Markets
Industrialized International Markets look much the same as the S&P 500. Watch the rising neckline as a trailing “stop-loss” and a failed rally as an opportunity to reduce risk to international markets. International and emerging markets are well ahead of any expected growth in the U.S. economy, so the risk of disappointment is high.
Interest Rates Are The Key
Of course, the key to the entire market complex (including small and mid-cap markets) is interest rates and inflation. With inflationary pressures rising, input costs will have to be passed along to cash-strapped consumers or absorbed by companies with already razor-thin margins in many cases. The outcome is not good in either case. Furthermore, the spike in rates, as shown below, which corresponds with higher inflationary pressures, quickly reaches the point that something tends to break in a debt-laden economy.
Pay attention to the risks.
We will use rallies to further reduce exposure to equities in portfolios until we get better clarity and improvement in our money-flow indicators.
Just as we did with the energy sector earlier this week, the financial stocks have now gotten extremely overbought. We are taking profits in these holdings and reducing positions back to original sizing.
Equity Model:
Reduce GS and JPM back to 2% of the portfolio each.
With interest rates spiking, we are worried about the impact of higher rates on not only the economy but valuations as well.
Equity Model:
Selling 100% of LOW
ETF Model
Reducing XLK by 2% of the portfolio from 13% to 11%.
February 24, 2021
*** Portfolio Transaction Alert – Rebalancing Energy Holdings ***
After a rather significant runup in energy stocks since the beginning of the year, we are rebalancing our positions back to portfolio weightings. We are already overweight energy stocks relative to our benchmark index, so we are just reducing our holding back to their original weightings.
Equity Model:
Reducing MRO and XOM back to 1% of the portfolio each.
ETF Model
Reducing XLE back to 3% of the portfolio.
Dynamic Model
Reducing MRO to 2% and XOM to 3% of the portfolio.
February 22, 2021
Market Review & Update
Over the last two weeks, the market has made minimal advances while underlying measures show deterioration in its technical strength. However, as we have noted in our 3-minute videos, the money flow buy signals have remained intact, providing support for prices in the near term.
Importantly, base money flows continue to be exceedingly strong, which suggests that even though we are currently on a short-term “sell signal,” it is quite likely the market will continue to hold support around current levels. As shown in the chart below, previous periods where money flows have been positive during a “sell signal,” markets have most consolidated and set up for another advance.
Given we are in the seasonally strong period of the year, we suspect this will likely be the case this time as well.
Emerging and International markets continue to have powerful money flows as investors chase these areas. These indices are grossly extended, and valuations no longer justify ownership. However, for now, the bias is to the upside. As long as money flows remain positive, you can add exposure on dips that don’t violate the running moving averages. However, eventually, the reversion to the mean will be much larger than most expect. Keep stops close to your entry levels.
The Russell 2000 index, where most “zombie companies” survive, remains grossly deviated from long-term means. Eventually, this deviation will matter. For now, however, money continues to chase these smaller companies hoping for “big gains.” The evidence of ongoing speculation is clear. However, for the moment, the bullish bias remains strong along with money flows. It is okay to trade the index but keep stops tight for now.
Bonds continue to remain under pressure as rates rise in anticipation of more stimulus and higher inflation levels. As discussed in this past weekend’s newsletter, it is only a function of time until rates collide with an overbought and overvalued market.
Most likely, somewhere between 1.5% and 2.0%, the economy will start to show a negative impact on consumption, and the Fed will start talking about “yield curve control.”
The other problem with higher rates is that the bullish support of “low rates justifies high valuations” quickly reverses.
While there is nothing to worry about immediately, it is likely not a bad time to start “hedging” your portfolio a bit by raising some cash and rebalancing risk.
When the correction comes sometime over the next month or two, it will likely be a swift one.
Fear/Greed Gauge Fell Only Slightly To 91.8 (Extreme Greed)
Technical Gauge Is Still At Extreme Overbought
February 19, 2021
** Dynamic Portfolio – Trade Update ***
Portfolio Managers – Nick Lane/Lance Roberts
We are adding two trading positions to our portfolio this morning. These are strictly short-term trades based on oversold conditions. We are maintaining tight stops just in case things don’t turn out as planned.
Equity/Sector Portfolio
Buy 3% of the portfolio in TSLA / Stop-loss is set at $700
Add 1.5% to MSTR / Stop-loss remains at $800
February 18, 2021
** Equity Portfolio – Trade Update ***
Portfolio Managers – Michael Lebowitz/Lance Roberts
We sold all of our position in WMT today following not only a disappointing earnings announcement but also very lackluster guidance for the rest of the year. We will re-evaluate the position in the future if warranted.
Equity/Sector Portfolio
Sell 100% Of Walmart (WMT)
** Dynamic Portfolio – Trade Update ***
Portfolio Managers – Nick Lane/Lance Roberts
We sold our position in AMD. This is a first step in reducing our equity exposure as we are seeing signs a correction is on the horizon. AMD appears technically vulnerable as well. We are adding back to our stake in PLTR after taking profits previously. The recent correction has gotten the position back to support and extremely oversold.
Equity/Sector Portfolio
Sell 100% of AMD
Add 2% to PLTR bringing total weighting to 4%.
February 17, 2021
** Equity Portfolio – Trade Update ***
Portfolio Managers – Michael Lebowitz/Lance Roberts
We sold our position in AMD. This is a first step in reducing our equity exposure as we are seeing signs a correction is on the horizon. AMD appears technically vulnerable as well.
Equity/Sector Portfolio
Sell all AMD 31 shares 2.5%
February 16, 2021
** Equity and Sector Portfolio – Trade Update ***
Portfolio Managers – Michael Lebowitz/Lance Roberts
We reduced our fixed income exposure by selling our entire position in MBB (mortgage ETF) and buying, in its place, 10% of SHY (1-3yr Tsy). We are concerned that further selling in the fixed income markets would raise the duration of mortgages and create forced selling by leveraged institutional holders of mortgages. Given the low yield of mortgages, the risk-reward is not worth the risk.
Equity/Sector Portfolio
Sell all MBB 13%
Buy 10% SHY
Market Commentary
This past week was mostly non-eventful, with markets absorbing some of the previous week’s runup. In the short-term, the markets are indeed overbought, with almost every market pushing 2-standard deviations of the 50-dma. Such would suggest that upside is limited in the short-term, but money flows are currently favorable, supporting stock prices in the short-term.
We will review the money-flow analysis for each of the major markets.
In all graphs below, the primary indicator to observe is the middle panel. This is our money flow indicator, which combines both price and volume to determine the strength or weakness of advance or decline.
S&P 500
As noted, we had previously reduced our exposure to markets in mid-January as the money flow indicator was getting extremely extended. That worked out well given the sharp decline at the end of January. Following that decline, we began adding positions back to portfolios and are once again nearly fully allocated to equity risk.
At the moment, money flows are positive, and the market has been consolidating the recent gains. However, money flows are weaker than they were previously, and when the market turns down, we are likely going to see a bit bigger correction than we saw in January.
The money flow index is currently not back to its warning zone just yet, so we are still one to two weeks away from the next correction phase.
Mid-Cap 400
As with the S&P 500, Mid-caps are significantly extended and deviated above long-term means. When it comes, the correction will likely be reasonably substantial, given the current deviation. Profit-taking would be advisable currently.
The money-flow index is positive, but flows are weakening, so when a correction begins, it will be worth paying attention to. At the moment, there is no need for real concern, we are likely a couple of weeks away from a correction, but as stated, a little profit-taking is advised.
Small-Cap 600
As with the Mid-Cap 400 index, the same goes for the small-cap index. Small-caps are grossly extended, overbought, and deviated from long-term means. It is highly advisable to take profits and reduce exposure to this sector after the recent run.
Again, we are most likely a week or two away from a correction. While you can continue to hold positions for now, just be aware of the risk. When the market turns, it will be swift, and you likely will not have much opportunity to sell. Such is why some advance profit-taking is probably advisable.
Emerging Markets
Emerging Markets, like small caps, are grossly extended. As with the recent correction, the next will likely be just as “fast and furious.”
Again, we are likely a week or two away from a correction as money flows are positive. However, they are weakening, which suggests profit-taking is advisable.
International Markets
So goes Emerging Markets, so goes International.
Take profits and reduce risk. The coming correction, when money flows peak and turn lower, will be relatively swift.
Gold
I have had a lot of questions about Gold lately. The belief is that with the Fed, and the Administration, pumping money into the financial markets, we are about to get a strong surge of inflation. While I will not get into the dynamics of what causes real inflation here, the simple fact is that Gold is more of a “fear” trade than an “inflation” trade.
Clearly, given the mass speculation that is going on in the market from Gamestop to Marijuana stocks, there is no fear. Such is apparent in the chart below. Technically there is no reason to own gold currently. When we begin to see the technical backdrop improve, we will undoubtedly add positions back to our portfolios.
February 13, 2021
Public Service Announcement:
How Can You Lose 50% Of Your Money? By Forgetting Tomorrow Is Valentines Day!
We added a 3% position in QRVO this morning at the open. We are continuing to build out the portfolio and looking for companies with strong earnings growth profiles that have gotten recently oversold.
Dynamic Portfolio
Buy 3% of the portfolio in QRVO / Stop-loss set at $163
February 9, 2021
** Dynamic Portfolio – Trade Update ***
Portfolio Managers – Nick Lane/Lance Roberts
We are taking profits and reducing our position in MSTR after the 30% advance yesterday. The position grew from 3% to 4.75% so we are reducing the position for now. We will add back to the holding once we get a bit of correction that works off the extreme overbought. This is essentially a play on the “bitcoin mania” so we are just going to take profits along the way.
Dynamic Portfolio
Selling 1-share of MSTR to reduce position size at the open. Original holding was 5-shares.
February 8, 2021
** ETF Portfolios – Trade Update ***
Portfolio Managers – Michael Lebowitz/Lance Roberts
We are continuing to work at rebalancing the portfolio closer to the benchmark weightings. With rates pushing higher, we are reducing XLU by 4% and increasing our underweight positioning in XLK up by 4%. This adjustment is simply a swap of holdings and does not increase overall equity allocation.
As shown, the S&P index is currently overbought and trading significantly above its 200-dma. The short-term correction at the end of January did little to alleviate these conditions. However, with the Bollinger Bands narrowing, the market could trade higher over the next month.
A worrisome sign is the percentage of stocks outperforming the S&P 500 index over the last 12-months. The breadth of that outperformance has gotten extremely narrow. It is worth noting the previous dates of the lows in this indicator.
As Bob Farrell once noted:
“Markets are strongest when broad and weakest when narrow.”
Also concerning is the more extreme deviation from the 225-day moving average, somewhere between February and March, we could see a larger correction take hold. In any given year corrections of 5-10% are completely within norms. Historically, such extreme deviations have tended to align with bigger corrections.
Market Review – Weekly Chart
For investors, the outlook becomes much more troubling as we look further out.
The market is trading well into 3-standard deviation territory above its long-term mean. Furthermore, while the market is incredibly overbought on a weekly basis, there is a negative divergence in relative strength (RSI).
Since weekly charts are slower moving, such does not mean the markets will crash immediately. Long-term charts indicate that price volatility will likely be higher in the months ahead, and investors should monitor their risk accordingly. While momentum-driven markets can remain irrational much longer than logic would predict, eventually, a reversion has always occurred.
The chart below shows the price deviation from the one-year weekly moving average. Given the deviation is well above 15%, price corrections have historically always been nearby. (Such does not mean a market crash. A correction of 10-20% is well within norms.)
Long-Term View Is Bearish
The monthly chart of the S&P 500 is likewise just as problematic. Again, long-term charts predict long-term outcomes and are NOT SUITABLE for trading portfolios short-term.
As shown, the deviation from long-term monthly means and negative divergences in relative strength has previously been warning signs for more significant corrections.
We see the same problematic setup when viewing the market’s current deviation from its 2-year monthly moving average. The current deviation has only occurred 5-times since 1960 and has always led to a correction over the next several months. (Some worse than others.)
However, since 1900, using QUARTERLY analysis, the picture is bearish for returns over the next decade. The research below aligns valuation, relative strength, and deviations into one chart.
There is little to suggest investors who are currently extremely “long equity risk” in portfolios now won’t eventually suffer a more severe “mean-reverting event.”
While valuations and long-term deviations suggest problems for the markets ahead, such can remain the case for quite some time. It is this long lead time that always leads investors to believe “this time is different.”
Because of the time required for long-term data to revert, monthly and quarterly data is more useful as a guide to managing expectations, allocations, and long-term exposures. In other words, this data is not as valuable as a short-term market-timing tool.
What Could Cause A Correction In 2021?
Lots of things.
The market is currently priced for perfection betting on explosive economic growth, a falling dollar, interest rates remaining low, consumer spending surging sharply, and inflation remaining muted. The reality is that none of those things will likely turn out to be the case.
The one thing that always trips of the market is the one thing that no one is paying attention to. For me, that risk lies with the US Dollar. As noted previously, everyone expects the dollar to continue to decline, and the falling dollar has been the tailwind for the emerging market, commodity, and equity “risk-on” trade. Whatever causes the dollar to reverse will likely bring the equity market down with it.
That is the risk we are paying attention to right now.
RISK IS ELEVATED – look for profit taking next week.
February 5, 2021
*** Equity / ETF Portfolios – Trade Update ***
Portfolio Managers – Michael Lebowitz/Lance Roberts
As noted in the trading update below, we also added ALB to the equity portfolio. Given that we already have 5% of industrial exposure in the equity model, we also added 1% to XLI and 1% to XLB to keep our allocations in line.
“Albermarle is the world’s largest producer of lithium so it plays into Biden’s green theme. The stock is down almost 20% from early January highs and back to the 50-day moving average which is what we were targeting. Money flows are also turning positive. ” – Michael Lebowitz, CFA
Equity Portfolio
Initiate a 2% position in ALB / Stop-loss set at $146
ETF Portfolio
Add 1% to XLI bringing total portfolio weight to 2%
Add 1% to XLB bringing total portfolio weight to 3%
*** Dynamic Portfolio – Trade Update ***
Portfolio Managers – Nick Lane/Lance Roberts
After decent consolidations, we are adding two stocks this morning on expectations of “better than expected” earnings coming on the 17th. ALB is the worlds leading producer of lithium for batteries, and ZS is a software infrastructure technology play.
Dynamic Portfolio
Initiate a 3% position in ZS / Stop-loss set at $193
Initiate a 3% position in ALB / Stop-loss set at $146
February 4, 2021
*** Equity & ETF Portfolio – Trade Update ***
Portfolio Managers – Michael Lebowitz/Lance Roberts
We are continuing to rebalance our portfolio to more closely align with our benchmark follow the correction last week. After adding JPM to portfolios to capture the impact of a flatter yield curve, and more liquidity from stimulus, we added GS to portfolios today. We were also considering adding a position in short-duration high yield bonds, but after comparing performance and volatility over the last couple of years, we opted for increasing our exposure to Preferred stocks instead which have less risk of default.
Equity Portfolio
Initiate a 2% position in GS / Stop-loss set at $270
Increase PFF from 5% to 10% of portfolio / Stop-loss remains at $37.50
ETF Portfolio
Increase XLF from 2% to 4% of portfolio / Stop-loss set at $29
Increase PFF from 5% to 10% of portfolio / Stop-loss remains at $37.50
February 3, 2021
*** Equity Portfolio – Trade Update ***
Portfolio Managers – Michael Lebowitz/Lance Roberts
We sold 100% of KHC this morning as input costs are rising and they are unable to pass those along to the consumer. Such will press margins in the future. We are going to remain slightly underweight staples in our models for now.
Sell 100% KHC
February 2, 2021
*** Equity and ETF Portfolios – Trade Update ***
Portfolio Managers – Michael Lebowitz/Lance Roberts
As noted with the trades in the Dynamic Model earlier this morning. We have now executed the same trades in the Equity and ETF Portfolios.
Equity Model:
Initiate a 1% position in XOM / Stop-loss set at $42.00
Initiate a 1% position in MRO / Stop-loss set at $7.00
Initiate a 2% position in JPM / Stop-loss set at $128.00
Sell 100% of TLT – removing portfolio hedge.
ETF Model:
Add 1% to existing XLE position increasing position to 3%
Initiate a 2% position in XLF
Sell 100% of TLT – removing portfolio hedge.
*** Dynamic Portfolio – Trade Update ***
Portfolio Managers – Nick Lane/Lance Roberts
After the sell-off at the end of January, some areas of the market got hit harder than others. We are using the price weakness to add to our energy positions and increase our exposure to financials.
Increase XOM back to 3% of the portfolio (after the previous profit-taking) / Stop-loss set at $42.00
Increase MRO to 2% of the portfolio up from 1% originally. / Stop-loss set at $7.00
Initiate new 3% position in JPM / Stop-loss set at $128.00
Sell 100% of TLT – removing portfolio hedge.
February 1, 2021
*** Equity Portfolio – Trade Update ***
Portfolio Managers – Michael Lebowitz/Lance Roberts
Like JNJ, ABT is getting well overbought, trading at 3 standard deviations above its 20-day ma. As shown below, after spikes higher to the 3rd Bollinger Band, ABT tends to fall back. We sold ABT from 2% down to 1.5%- we still like the company’s fundamentals and sector.
Reduce ABT from 2% to 1.5% of the portfolio
Portfolio Earnings Announcements this week:
Tuesday (February 2nd)
AMZN – After Close
GOOG – After Close
UPS – After Close
Wednesday (February 3rd)
ABBV – Before Open
Market Review And Update
Last week was, in a word, “interesting.” While the headlines were all about Gamestop (GME), this was the “unexpected, exogenous event” that triggered the market’s sell-off. Last Friday, we discussed reducing our equity exposure because our money-flow signals were sending warnings. To wit:
The sell-off last week was enough to reverse some of the overbought conditions. However, with money flows still negative, we suggest moving cautiously in increasing equity exposure until those reverse.
At least for now, the good news is that the market did hold support at the 50-dma on Friday. With the market oversold, we would expect at least a short-term bounce. However, until the money flows provide a “buy signal,” I would suspect any rally to be a “sellable one,” at least for now.
The same goes for the entire “reflation” trade from emerging markets to small-caps. All of these sectors were grossly extended, and the correction was inevitable. As we head into the seasonally weak month of February, the only question is the selling over? Given that these markets are still grossly extended from long-term means, it is reasonable to suspect there could be more downside risk present.
The biggest clue to a further correction will the $USD. We have discussed previously the rather massive short-position against the dollar. Such provides the “fuel” for a counter-trend rally given the right catalyst. Given the negative correlation between the markets and the dollar, an expanded “risk-off” move from stocks could certainly spark the dollar rally, thereby feeding a more significant decline in stocks.
However, we aren’t there just yet, but we are watching closely.
In the meantime, we are preparing a list of candidates to add back to our portfolios. Specifically, we focus on areas that have had a decent correction, are oversold, and are maintaining good relative strength.
You can screen for ideas that fit these requirements using our scanning tool or by viewing the list of Strongest S&P 500 Relative Strength stocks under Active Trader.
Once we get into the trading day, we can determine where markets are likely heading next. Keep watching this space for portfolio changes as needed.
Market Fear/Greed Index (Investor Allocations To Risk) Dropped To 77.5
Click To Enlarge
Technical Guage has reduced some of the more extreme overbought.
Risk/Ranges have dropped back to levels which suggests a reflexive bounce is likely next week.
January 29, 2021
*** Dynamic Portfolio – Trade Update ***
Portfolio Managers: Nick Lane/Lance Roberts
Took profits in Palantir (PLTR) by reducing the position back to 3% of the total portfolio. PLTR had a big move since we added it. We will look for a pullback to add to the position again.
January 27, 2021
*** Equity Portfolio – Trade Update ***
Portfolio Managers: Michael Lebowitz/Lance Roberts
We reduced JNJ from 2% to 1.50% as the stock is grossly overbought. (This is our second reduction in recent weeks from 3% originally.) The graph below shows that it is well above its 200dma 3 standard deviation Bollinger band, a feat it hasn’t accomplished in at least 20 years.
Click To Enlarge
Reduce JNJ from 2% to 1.5% of portfolio.
January 26, 2021
*** Dynamic Portfolio – Trade Update ***
Portfolio Managers: Nick Lane/Lance Roberts
We are reducing our LEN position to 1.5% as the stock has become very overbought alongside US homebuilder indices. We intend to increase our holdings again, providing a pull-back provides some relief to overbought conditions.
We also added a 3% position in PG to gain some exposure to staples as we continue to build out the portfolio. PG is oversold and coming up off its 200-day moving average, providing a nice entry point.
Reduce LEN to 1.5% weight in the portfolio from 3%.
Initiate a 3% portfolio weighting in PG / Stop-loss is $128
Portfolio Managers: Michael Lebowitz/Lance Roberts
As we head into earnings season we previously added exposure to our major technology companies (i.e. AAPL, MSFT) in anticipation of a reflation “risk-off” trade. After reducing equity by 20% on Friday, we are adding 3% of that cash into three of our existing technology holdings to bring our technology weight up to our benchmark.
Add 1% to CRM
Add 1% to AMD
Add 1% to ADBE
*** Dynamic Portfolio – Trade Update ***
Portfolio Managers: Nick Lane/Lance Roberts
For the same reasons that we added technology to our Equity portfolio, we made some of the same additions to the Dynamic model.
Initiated a 3% weight in ADBE
Initiated a 3% weight in CRM
Initiated a 3% weight in AMD
Earnings Calendar for RIA Pro Portfolio Holdings:
Tuesday (January 26th)
AMD – After Close
JNJ – Before Open
MSFT – After Close
NSC – Before Open
RTX – Before Open
VZ – Before Open
Wednesday (January 27th)
AAPL – After Close
ABT – Before Open
Thursday (January 28th)
CMCSA – Before Open
V – After Close
Market Review – Why We Reduced Exposure On Friday
On Friday, we discussed reducing our trading index exposures (SPY and RSP) to raise cash and reduce risk as our money flow indicators are getting close to turning over. Such was a point we discussed in more detail on Thursday’s 3-minutes video (Subscribe to our YouTube feed for notifications)
In today’s market review, I want to dig into these two charts a little further. As shown, the money-flow indicator is very elevated (above the 90% line), which is usually where this indicator peaks and turns lower.
There is an important distinction that needs to be made. A “sell signal” does not necessarily mean the market will enter into a correction process where prices decline. Corrections can take on two forms: 1) a price decline that reverses the previous overbought conditions or b) a consolidation in price, which allows for a reversal of the overbought condition.
It doesn’t matter to us which one it is. When the overbought, overly exuberant, and deviated price structures are resolved to some degree, we will add exposure to our portfolios. In the short-term, history suggests the risks outweigh the reward currently.
In the very short-term, we are not heavily focused on the daily swings in the money-flow indicator. However, they become much more relevant when they align with a weekly change in the indicator from buy to sell. While the weekly signal suggests we still have some room to the upside, there isn’t likely much. Any unexpected, exogenous event could start a reasonably sharp correction in prices.
For now, we are opting to reduce our risk exposure.
As stated, we are likely early and will suffer some relative underperformance in the short-term. However, when the market turns, we will likely make up that differential fairly quickly. Such will also allow us to add to our current positions at better prices.
There are two other areas to keep a close eye on Bonds and Gold.
The money flows into bonds and gold have been accumulating despite prices not doing much. However, I suspect that positioning could be a precursor to a corrective pullback in the market where the flight to safety will likely manifest itself in these areas.
We have taken a small position early in TLT but will get more aggressive in these areas once we see the rotation.
For now, we are remaining vigilant and allowing our remaining equity exposure to continue working for us.
Portfolio Managers: Michael Lebowitz/Lance Roberts
This morning’s sell-off has now triggered our money flow indicator requiring us to take our two index trading positions off of the table. We are also selling CVX in response to Biden’s executive order to ban drilling on Federal lands and in offshore waters. We are holding our other drillers which should benefit from the eventually reduced supply caused by this order resulting in higher oil prices.
We are reducing risk now heading into February which tends to be a weaker month historically particularly following positive January months.
Sell 100% RSP
Sell 100% SPY
Sell 100% CVX
January 21, 2021
*** Equity Portfolio – Trade Update ***
Portfolio Managers: Michael Lebowitz/Lance Roberts
We sold the entirety of our position in UNH this morning. While we like the company very much it really came down to the fact that we were overweight healthcare, relative to the equal weight S&P 500 benchmark, and needed to reduce our weighting slightly. We have healthcare exposure to Aetna through CVS and with the Biden Administration potentially focusing on boosting the Affordable Care Act again, we are opting to reduce exposure to companies that may have the most impact.
We are maintaining our holdings in JNJ (which will increase to 3% of the portfolio on a pullback), ABBV, ABT and CVS.
Sell 100% of UNH (United Healthcare)
January 20, 2021
*** Dynamic Equity Portfolio – Trade Update ***
Portfolio Managers: Nick Lane/Lance Roberts
This morning we took profits in our energy holdings which are extremely overbought and added GOOG in advance of earnings. We are still building out the portfolio and have several other positions on our radar but we need a short-term market correction to trigger buy points.
Reduce XOM from 3% to 1.5%
Reduce KMI from 3% to 1.5%
Initiate a new position in GOOG at 3% of portfolio / Stop-loss is $1750
January 19, 2021
*** Equity & ETF Portfolio – Trade Update ***
Portfolio Managers: Michael Lebowitz/Lance Roberts
We are slowly making changes to the portfolio allocation model to move it closer to the benchmark weightings. Given we were underweight technology and discretionary, and overweight communications, we are modifying holdings to correct those imbalances.
Sell 100% of CMCSA (Comcast) – Communications
Buy 2% of portfolio value in LOW (Lowe’s) – Discretionary / Stop-loss is $160
Add 1% of portfolio value to AAPL (Apple) increasing weight to 3% / Stop-loss is $120
Add 1% of portfolio value to MSFT (Microsoft) increasing weight to 3% / Stop-loss is $210
Add 1.5% of portfolio value to AMZN (Amazon) increasing weight to 3% / Stop-loss is $3000
Portfolio Earnings Alert for the week.
Tuesday (January 19th)
NFLX – After Close
Wednesday (January 20th)
KMI – After Close
UNH – Before Open
Thursday (January 21st)
UNP – Before Open
Market Update
The market perspective didn’t change much last week as all major markets remain overbought, extended, deviated, and extremely bullish. That is good news for traders in the short-term as prices will try to extend higher. However, we are getting very close to the point of getting a reasonable correction of 5-10% within the next 4-weeks.
As shown, the S&P 500 struggled a bit this past week as the overbought condition was reduced very slightly. The TRIX indicator is close to turning down, but money flows remain positive at the moment. We will push more into “risk-off” mode if we see both the TRIX and money flow turn negative.
Elsewhere, every other market is pushing much more extreme levels, suggesting that investors’ risk/reward setup is not great. (Short-term traders still have an upward bias) For longer-term investors, now is the time to rebalance risk and reduce exposure.
Emerging and International Markets remain grossly extended and deviated from long-term means. While the price runup has been based on expectations of a global economic recovery, such is unlikely to come to fruition to the scale needed to support current prices. Much of the runup has been due to a weaker dollar, which, as we have been discussing over the last several weeks, is likely close to bottoming, at least in the short-term.
Small and Mid-Cap Markets, very much like International and Emerging markets, Small and Mid-caps are also extremely overpriced, deviated, and extended. As noted above, these markets are more extremely overbought than at any other period in the last decade. Furthermore, even if the economy does recover to some degree in 2021, it has likely already been priced in and then some. The risk of disappointment is high. Continue to rebalance risk and sizing in portfolios for now.
The dollar remains the key to the whole market. The sharp decline in the dollar over the last 9-months has been the tailwind for the equity rally. With the dollar extremely oversold and a massive net short against the dollar currently, any change in sentiment could lead to a sharp counter-trend rally. Continue to watch the dollar, and bonds, for clues to a turn. If such a turn begins, reduce equity holdings and hedge with long-dollar and bond positions.
(Note: We added a position in TLT on Thursday as an early hedge for a reversal.)
Sell 100% of BBBY (Bed, Bath & Beyond). This was a technical trade for a short-squeeze that occurred. Booking the gain.
January 14, 2021
*** Equity & ETF Portfolio – Trade Update ***
Portfolio Managers: Michael Lebowitz/Lance Roberts
The market is getting egregiously overbought, and exuberant, which suggests that we will likely move into a corrective mode sooner than later. We are currently VERY underhedged at the moment and carrying greater than 60% equity exposure. With bonds extremely oversold we are adding a 5% position of TLT to portfolios for a short-term hedge. This move has less risk than trying to short the market directly at this point.
Click Chart To Enlarge
Initiate a 5% position of TLT at the open / Stop-loss is $150
*** Dynamic Portfolio – Trade Update ***
Portfolio Managers: Nick Lane/Lance Roberts
See note above on TLT.
We are also adding starter positions in both MRO (Marathon Oil) and MSTR (Microstrategy, Inc.) We are expecting both of these positions to pull back and give us an opportunity to add the second half of the position. We are also carrying tight stops on both positions. MSTR is a play on the “bitcoin” mania as the potential for another $2 Trillion in stimulus will likely exacerbate that trade. We are carrying a running trailing stop on MSTR at the 20-dma.
Buy 5% of TLT / Stop-loss is $150
Buy 1.0% of the portfolio in MRO / Stop-loss is $6.35
Buy 2.5% of the portfolio in MSTR / Stop-loss is $425.00
January 13, 2021
*** Equity Portfolio – Trade Update ***
Portfolio Managers: Michael Lebowitz/Lance Roberts
We are adding a 2% position of ZM (Zoom Video) to the portfolio. As shown in the chart below, the stock has had a large retracement, is oversold, and the short-term MACD has triggered a “buy signal.” We will add to our position if the longer-term MACD also turns positive. This is a purely technical based trade so we are carrying a fairly tight stop for now, but if the position migrates into a stronger technical position by breaking above the recent downtrend at $400, then we will consider it a longer-term hold.
(Click To Enlarge)
Buy 3% of the portfolio in ZM / Stop-loss is $330
Rebalanced FANG (Diamond Back Energy) back to original position weight 1%.
*** Dynamic Portfolio – Trade Update ***
Portfolio Managers: Nick Lane/Lance Roberts
As noted above we also bought ZM (Zoom Video) into the portfolio after a large correction back to long-term support. Given that even with a vaccine it doesn’t look like we are returning to normal any time soon, the stock price should be a setup for a decent bounce if earnings come in better than expected.
We also bought BBBY (Bed, Bath & Beyond) which is in the process of buying back 15% of their outstanding shares. Such sets the company up for a short-term “short-squeeze” as BBBY carries a large net-short positioning currently. This is a short-term trade and not an investment.
We added a position in both AMZN and NFLX which have been basing along support and have turned up. These are technical trades only with tight stops.
Buy 3% of the portfolio in ZM / Stop-loss is $330
Buy 3% of the portfolio in BBBY / Stop-loss is $18.05
Buy 3.1% of the portfolio in AMZN / Stop-loss is $3122.00
Buy 3% of the portfolio in NFLX / Stop-loss is $493
January 12, 2021
*** Equity Portfolio – Trade Update ***
Portfolio Managers: Michael Lebowitz/Lance Roberts
As we have discussed in recent missives, the Utility sector is extremely oversold. However, with rates pushing higher on expectations of more deficits, stimulus spending, and higher inflation, the “Utes” remain under pressure. While we like the sector defensively, we were stopped out of both of our positions this week:
We initiated a 5% position in BGSF. The stock is currently forming a bullish technical trading pattern with support near $12.50 per share. Additionally, the price remains roughly 34% below its level one-year-ago, leaving plenty of room for price appreciation as the economy recovers.
Buy 5% of the portfolio into BGSF. Stop-loss is set at $12.50
The following CNBC article reports on JNJ ‘s COVID vaccine that could significantly speed up the vaccination process. Unlike the Moderna and Pfizer vaccines, theirs requires only one shot and can be stored in a traditional refrigerator, not in specialized refrigeration systems at sub-zero temperatures.
We own 2% of JNJ in the equity model.
So Goes The First 5-Days Of January
** Click Charts To Enlarge **
For the week, the market churned out a 1.97% rate of return. As the old Wall Street axiom goes “So goes the first 5-days of the year, so goes the month. So goes the month, so goes the year.”
While you may be tempted to just “shut off the lights” and come back next January, while the year may indeed turn out positive, it likely won’t do so without some significant volatility along the way.
We got a few questions like week why we were adding broad index position weightings to our portfolios. As shown in the chart below, while the market is overbought short-term, the money flows, and the MACD is turning positive. With the market close to the top of its Bollinger Bands, upside may be more limited, but the setup is similar to what we saw in July which could give us a month or two of upside before we get a much-needed correction.
The current exuberance in the markets is extreme particularly in the small/mid and international/emerging market space. As shown below, IWM and EEM are trading at extremes and when a correction comes it will likely have a large impact on these two areas.
The one thing that derails this particular train is a reversal in the U.S. Dollar. We have opined on it previously, but continue to watch the dollar closely as money flows have turned positive and a buy signal has now been triggered.
It is still very early, and we have seen failed rally attempts previously over the last year. However, the negative sentiment, along with the net short positioning, is now at extremes. Such has usually been an ideal setup for a counter-trend rally.
Current Positions
We recommend currently holding your positions for now. But keep an eye on some of the more extreme levels of markets. We are now at a point where reversals happen, and they happen for the most unexpected reasons. With the current technical backdrop of the markets positive, I suspect that markets will continue to rise through January. However, sometime between February and early April, we suspect there will be a decent corrective action we can buy into.
Keep stops tight and maintain your risk controls for now.
Market Fear Greed Gauge at 97.50 / 100 for the week ending 1/8/21
Technical Gauge at 91.07 for the week ending 1/8/21
January 8, 2021
*** EQUITY / ETF MODEL ***
Portfolio Manager: Michael Lebowitz/Lance Roberts
This morning we added 5% of SPY and 2% PFF, we sold all of IAU and GDX as they are breaking below support this morning. Given that GDX and IAU were in the equity portfolio our equity exposure is largely unchanged.
Sell 100% of GDX from portfolios.
Sell 100% of IAU from portfolios.
Buy 5% of portfolio value in SPY
Buy 2% of portfolio value in PFF
*** Dynamic Equity Portfolio Model Update ***
NOTE: There is a pricing error on SNOW. We are aware of it and are fixing it.
Portfolio Manager: Nick Lane/Lance Roberts
We initiated 3% positions in each of the following to start building out the “new economy” side of the portfolio.
SNOW – Entry $314.9 / Stop Loss $260
PLTR – Entry 25.92 / Stop Loss $22.50
SQ – Entry 242.97 / Stop Loss $215
PINS – Entry $72.96 / Stop Loss $65
ETSY – Entry $177.00 / Stop Loss $166
AAPL – Entry $131.20 / Stop Loss $126
MSFT – Entry $219.14 / Stop Loss $210
January 7, 2021
*** Dynamic Equity Portfolio Model Update ***
Portfolio Manager: Nick Lane
We initiated 2.5% positions in each of Kinder Morgan and Exxon Mobil in order to gain exposure to the reflation trade. Both stocks are also setting up a nice technical picture.
KMI – KMI just triggered a money-flow buy signal. Additionally, the stock recently held support at the 50-dma and is setting up to form a “golden cross”, a bullish signal where the 50-dma crosses above the 200-dma. The close proximity of these moving averages also provides strong support for the stock near the $13.75 range.
XOM – Similarly to KMI, XOM recently triggered a money-flow buy signal. The stock is also setting up for a “golden cross”, so long as the current trend continues. The close proximity of these moving averages provides fairly strong support near $40 per share.
January 6, 2021
*** Portfolio Model Update ***
We are rebalancing the equity model. We reduced the following stocks below (tech, communication, and healthcare) and added 5% of RSP as a placeholder for now.
While this is a net reduction of equity exposure, it is only temporary as we look for short-term corrections to add to current holdings or add new holdings.
Currently, the equity model has 64% equity and the sector model has 66%. Both figures include gold and gold miners.
This morning we opened up a new trading account and have launched a new equity portfolio managed by Nick Lane with RIA Advisors. The portfolio has no boundaries or set allocation structure and can invest in any asset class, ETF, equity, or mutual fund seen as an opportunity.
NOTE: This is an aggressive portfolio model and will trade as needed. Therefore, it is not recommended for those seeking lower volatility, safer returns over time, and income.
This morning we initiated two new 3% positions in both Lennar (LEN) and Microchip Technology (MCHP).
LEN – We like the stock based on favorable fundamentals and a technically oversold level that may begin to reverse soon. We expect an extended period of accommodative economic policy and housing shortages to bode well for the stock heading into the spring and summer of 2021. LEN’s status as the largest homebuilder in the nation (measured by revenues) should help it stave off increases in input prices over this period as compared to industry peers.
MCHP– We initiated a position in the stock based on favorable future growth prospects in the industry as well an improving picture based on technical analysis.
A Technical Review Of The S&P 500
Welcome to 2021. As we kick off a new year, it is important to have some perspective in order to set reasonable expectations for returns. Currently, Wall Street analysts are wildly exuberant on expectations of explosive economic growth, rising interest rates, and inflation. The problem with those expectations is that in an economy that is $85 Trillion in debt, higher rates and inflation are a “death knell” to economic growth.
Yes, while the Fed may come to the rescue with more QE, with markets already trading at 36x times earnings it is becoming much more difficult to justify continuing to overpay for earnings. Eventually, corporate earnings are going to have to markedly improve, or prices will revert.
In the short-term, the S&P is currently overbought and trading significantly above its 200-dma. With the Bollinger bands narrowing the next move of the market will likely be either sharply higher or lower.
We currently expect the bullish trade to continue into January. However, somewhere between February and March, we could see a correction take hold. Much the same as we saw in Q1 of both 2018 and 2019.
Where it becomes much more troubling is when we look at the markets from a longer-term perspective.
On a weekly basis, the market is trading 3-standard deviations above its long-term mean and is incredibly overbought. At the same time, there is a negative divergence in relative strength (RSI) which is cause for concern. However, since weekly charts are longer-term, such does not mean the markets will crash immediately. Momentum driven markets can remain irrational much longer than logic would predict.
The monthly chart of the S&P 500 is likewise just as worrisome. Again, long-term charts predict long-term outcomes and are NOT SUITABLE for trading portfolios short-term. As shown the deviation from long-term monthly means and negative divergences in relative strength have previously been warning signs for more significant corrections.
What could cause a correction in 2021?
Lots of things. The market is currently priced for perfection betting on explosive economic growth, a falling dollar, interest rates remaining low, consumer spending surging sharply, and inflation remaining muted. The reality is that none of those things will likely turn out to be the case.
The one thing that always trips of the market is the one thing that no one is paying attention to. For me, that risk lies with the US Dollar. As noted previously, everyone expects the dollar to continue to decline, and the falling dollar has been the tailwind for the emerging market, commodity, and equity-risk trade. Whatever causes the dollar to reverse, will likely bring the equity market down with it.
That is the risk we are paying attention to right now.
“Maybe this time is different. Those words, supposedly the most dangerous to utter in the investing realm, came to mind amid the frenzied pops in the highly anticipated IPO’s. We discuss why the current market mania reminds us of the “Shades of 1999.”
“A recent article from Institutional investor decode ‘fund manager speak’ when you see them on financial media. Here are the 10-Investing Rules to improve you investing and avoid the noise.”
December 28, 2020
2020 will go down in the record books for a year when “anything that could happen, happens.”
It is also a year that led to many frustrations for portfolio management as the level of “risk-taking” by market participants derailed both technical and fundamental metrics. While this was initially driven by the Federal Reserve’s massive monetary liquidity programs, it was exacerbated by sports gamblers turning to the stock market to “get their fix.”
Is this going to end badly? Definitely.
When? We don’t have a clue.
Markets can, and do, remain irrational longer than logic (or fundamentals or technicals) would predict.
As such, we are making a change to our portfolio models to allow us more flexibility to participate in market trends while still employing a level of risk management.
Importantly, this change is driven by three primary factors:
Bonds, at below 1% yields, no longer offer the “hedging” ability they previously did. Over the last several years, a significant portion of our returns came from our bond portfolio. Going forward that is no longer a possibility.
Hedging provides a drag on a portfolio’s performance. While this is what it is supposed to do, with bonds also likely to underperform, hedging is becoming more challenging.
The exposure we have to equity risk needs to perform with the market when the market advances.
Currently, our portfolio models are 60% equities and 40% fixed income.
However, in the equity “sleeve,” we have positions that are more non-equity and provide some form of risk control. These can range from preferred issues to gold, gold miners, short-market positions, etc.
In order to reduce the potential future drag of the bond holdings, along with our non-equity risk management positions, we are adjusting our portfolio as follows going into 2021.
As such, the new model will allow us to maintain more equity exposure as markets are advancing to increase returns while still being able to risk-adjust the total model. The “hedge” sleeve can hold anything from short-market positions to currency, gold, or any other asset we see an opportunity to create returns from.
With rates currently below 1%, we are going to become more focused on trading duration in the years ahead. When yields rise substantially, we will reduce the duration. Conversely, when yields fall we will increase duration.
2021 will likely be a challenging year to create returns in markets that are currently “priced for perfection.” In other words, there is likely far more that could wrong in 2021, than what could go right.
We will have to trade accordingly.
December 23, 2020
On Monday we initiated a position in Diamondback Energy (FANG). We were eyeing FANG for a few weeks but held off as it was technically overbought on a short term basis. Prior to Monday, the stock had fallen about 10% and its level of overboughtness was greatly alleviated. Over the weekend they purchased QEP Resources, which further weighed on FANGs stock price. We took advantage of the lower price and quite frankly a beneficial purchase for FANG. On Monday, Grants provided their thoughts on the takeover as follows:
While the AT&T c-suite works through buyer’s remorse, one shale player laments the deal that got away. Today, Diamondback Energy announced it will buy driller QEP Resources, Inc. in a $555 million, all-stock deal equal to roughly $2.22 per share, based on current trading levels. That price represents a discount to QEP’s $560 million market cap as of Friday, spurring a selloff of as much as 11% in the target company’s shares today as frustrated investors headed for the exits.
For QEP, missed opportunities color today’s transaction. Last year, minority shareholder Elliott Management Corp. bid $8.75 a share to acquire the remaining 95% of the company it did not own, valuing the equity at some $2 billion. That approach was followed by an “intense” 90 day negotiation that broke down after the parties “couldn’t come together on price,” Bloomberg reported in August of last year. After deal talks fizzled, QEP CEO Tim Cutt explained management’s rationale: “As we evaluated opportunities, it was apparent that none of the potential transactions recognize the intrinsic value of our assets.”
December 22, 2020
Sector Review
As we noted in yesterday’s “Major Market Review” (scroll down):
“No matter how you want to cut it, the markets are exceedingly overbought on every front. Extensions from long-term means are historically wide, investor confidence is exuberant, and the markets are priced for perfection as we enter into 2021. The risk of ‘disappointment’ has rarely been greater.”
The sector charts, unsurprisingly, tell much of the same story. Such is always the case when you have investors chasing assets without regard to the underlying risk. However, as John Maynard Keynes once quipped, “the market can remain irrational longer than you can remain solvent.”
I want to highlight a couple of sectors we are watching closely for a potential “risk-off” rotation in the markets after passing into the New Year.
The sector rotation table below shows the most “out of favor” sectors of the market currently. We have discussed recently, below, that if I were a “betting man,” I would be considering adding long bonds and USD trades to portfolios. (We are doing that work now to identify the correct timing.)
The rotation model also suggests that Real Estate, Utilities, and Staples (and we still like Healthcare here for demographic reasons) will lead the market during a more “risk-averse” environment.
Real Estate
There is more downside to XLRE in the short-term as eviction moratoriums continue. However, much of the risk has already gotten priced into the sector. While you can play the industry as a whole, we like REITs involved in storage, healthcare services, and communications the most. These sectors tend to be more economically agnostic.
Look at add to, XLRE between $34.50-35.50 with a stop at $33.50.
Utilities
As with Real Estate, the Utility sector is also positioning for a counter-rotation trade. Utilities have been grossly underperforming the market over the past year. Better performance returns over the next year would be of no surprise.
Buy XLU between $60-61 with a stop at $58.
Staples
Lockdowns, or a return to economic recovery, staples will continue to play a vital role as people have to eat and continue life basics. While Staples is short-term overbought, the sector has been underperforming the market since the pandemic started. A correction to reduce the overbought condition will set up Staples for a better trading opportunity into 2021.
Look for a correction between $62-64 to add to holdings. Move stops on current holdings up to $60.
Healthcare
Due to the aging demographic, healthcare will continue to generate revenue regardless of what politics try to get enacted in Washington. While Healthcare is short-term overbought, like Staples, the rather severe underperformance puts the sector in a position for better future performance.
Look to add to current holdings between $102.50-105. Move stops on existing holdings up to $100.
December 21, 2020
PORTFOLIO UPDATE – TRADE ALERT
With TSLA entering the S&P 500 index today, the rebalancing of sectors put downward pressure on energy stocks. We have been looking for a pullback in a couple of stocks to their support levels to start adding positions to the portfolios. We are using this opportunity today to start that process.
EQUITY Model
Reducing CLX from 3% to 2% (Tax loss selling)
Initiating a 1% position in KMI
Initiating a 1% position in FANG
ETF Model
Reducing CLX from 3% to 2% (Tax loss selling)
Initiating a 2% position in XLE
Major Market Update
No matter how you want to cut it, the markets are exceedingly overbought on every front. Extensions from long-term means are historically wide, investor confidence is exuberant, and the markets are priced for perfection as we enter into 2021. The risk of “disappointment” has rarely been greater.
The charts below are MONTHLY charts overlaid against a 4-YEAR moving average. These charts are NOT SUITABLE for short-term trading BUT they do provide a much better observation about some of the most extreme overbought conditions we have seen over the last couple of decades.
In each of the cases below, the deviations from long-term means suggest that an eventual mean reverting event will be costly to investors. While it does NOT mean you should sell everything and go to cash immediately, it does suggest at least planning for an eventual correction by not turning a blind eye to the risk.
“The chart below shows the combined average of institutional and individual investor valuation confidence subtracted from future returns confidence. When the reading is positive, it means the confidence the market will be higher one year from now is more elevated than the confidence in the market’s valuation. The opposite is the case when the reading is in negative territory.
The key takeaway is that investors think simultaneously, the market is over-valued but likely to keep climbing.”
“Such is the same phenomenon famously described by former Fed Chair Alan Greenspan in a December 1996 speech on “Irrational Exuberance.”
Trade carefully, there is very little room for “disappointment” in 2021.
4-Week Average Of Fear/Greed is at 94.5 out of 100.
Technical Gauge is very overbought at 88.48
December 18, 2020
Adding a bit of exposure to portfolios as some sectors and positions have consolidated recent gains and/or are starting to trigger money flow “buy signals.”
EQUITY Portfolio
Initiate a 2% position in UNP (Union Pacific) into the portfolio.
Add 1.5% to RTX (Ratheon Technologies) to bring the exposure up to 2%. (We had reduced previously to take profits)
ETF Portfolio
Add 1% to XLU to increase to 5% of the portfolio.
Add 1% to IYT to increase to 2% of the portfolio
December 17, 2020
Dominion Energy (D) recently received analyst upgrades at Credit Suisse and Bank of America. The basis for the upgrades centers around strategic actions taken in 2020 to reduce risks as well as positive guidance from Management. We currently hold a 1% position in Dominion in our Equity Portfolio.
December 15, 2020
Portfolio Update – Trade Alert
Adding 5% of SPY to Equity and ETF portfolios for the end-of-year strength. As noted in both posts below, there is a 76% win ratio for the S&P between the 15th of December and the first week of January.
There are a few setups in the market that are hard to ignore particularly when it comes to very “out of favor” trades. Two such trades are the Dollar and 10-Year Treasury Yields.
Let’s start with the dollar. The dollar is so extremely oversold, with a very large net-short position against it, that any event which causes a flight to safety is going to lead to a sharp counter-trend rotation in the dollar. While there is not a tremendous move in the dollar to the upside, the ramifications of that move would ripple through the current “reflation bets” of emerging markets, international, energy, and commodity stocks.
Of course, if money rotates into the dollar for safety, foreign governments storing their reserves in the US Dollar would buy Treasuries which has a higher yield than most bonds globally. TLT is currently sitting on very important support and extremely oversold. Like the dollar, the negativity on bonds has once again reached the point that any event which disrupts the “bullish mantra,” is going to lead to a sharp drop in rates and a rise in bond prices.
So, if I was a “betting man,” the current setup to hedge portfolios against an unexpected risk is currently very tempting. What risk could that be? As noted in this past weekend’s newsletter,it will be the one thing that no one is currently paying attention to. Such can also be seen in BofA’s list which has a “Less than 5% chance” it is none of risks on the list.
As I stated:
“What exactly will that catalyst be? No one knows, just as no one expected the ‘pandemic’ in March. Whatever the catalyst eventually is, the media’s excuse will be: ‘No one could have seen it coming.’”
However, bonds and the U.S. dollar will likely both forecast, and protect, portfolios against whatever event it turns out to be.
December 14, 2020
MAJOR MARKET REVIEW
Last week, the market began a very mild corrective process as the “bullish bias” provided enough support to offset mutual funds’ distributions. However, with the markets still overbought and money flows currently slipping, there remains some downside pressure to stock prices heading into the Christmas break. The good news is that if we get some further weakness this week, such will likely provide a decent opportunity to add exposure for a post-Christmas “Santa Claus” rally as portfolio managers allocate money for year-end “window dressing.”
S&P 500 Index
As shown, the S&P 500 is finally coming off its more extreme extension; however, there is definitely a downside risk to the 50-dma in the short-term. Whether such a correction happens before Christmas or after the New Year is unknown, but a deeper correction will occur before the next leg higher can begin.
Use weakness to add exposure for trading positions, but maintain stop-loss levels to protect capital in the near-term.
Emerging Markets & International
Both of these markets are grossly extended and overbought. A correction will likely be somewhat painful and sharp when it happens and will likely coincide with a rally in the US Dollar. (More on that in a moment).
The deviation between the current price levels on both indices and the 50-dma is extreme. With the “buy signal” extremely elevated, and markets very overbought, the downside risk outweighs the reward.
Take profits and reduce risk accordingly for now, and look for a correction to add back exposure opportunistically.
Mid And Small Caps
As with international and emerging markets, the small and mid-cap markets have been on “fire” as of late as portfolio managers play the “catch-up” trade into year-end. While the “theme” is that there will be explosive economic growth next year, such is unlikely to be the case. The market has already front-tun most, if not all, of that growth.
The risk is very elevated. Take profits and reduce risk accordingly. Look for pullbacks to add exposure opportunistically.
Dollar And Rates
The “Pin that pricks the bubble” in the commodity, energy, small- and mid-cap, international, and emerging market trade is the dollar.
The dollar is extremely depressed, the opposite of the market, and has a huge net-short positioning against it by traders. Such is the perfect combination for a very sharp reflexive bounce in the dollar. When that occurs, two things happen:
Foreign reserves shift into the dollar to protect purchasing power against rising commodity prices, and;
Those foreign inflows buy US Treasuries to store reserves pushing Treasury bond prices up and “yields” down.
Investors should consider building hedges in both the dollar and Treasury bonds to reduce portfolio risk as needed.
This potential counter-trend rally in the dollar will likely also negatively impact the energy trade, which has also gotten way ahead of itself currently.
We have been discussing that distributions heading into Christmas could weigh on asset prices short-term which is why we raised cash recently. (We were a little early.) However, if we get a further correction over the next week heading into year-end options expiration, such would set us up for the traditional “Santa Claus” rally.
We would look to add exposure opportunistically if our thesis plays out accordingly. But the risk is to the downside currently.
The basic premise is that despite the collapse in oil prices, the supply of oil available has not dropped much at all. With global demand weakening, and OPEC+ now talking about increasing production, the supply gut is likely going to continue to impact companies going forward.
As we have discussed recently the rally in energy is now way ahead of both the economic recovery and fundamentals. With such exceeding dislocations and deviations, from the underlying averages, it is likely wise to be looking to take profits in the short-term and use corrections to continue to build exposures near term.
The Rest Of The Story
The rest of the market remains extremely overbought and speculative activity is at a record. Consider using this rally to raise cash levels, and reduce portfolio risk, currently. These speculative phases can last longer than you would expect, but the correction will come quickly, and when you least expect it.
This note from SentimenTrader sums it up well.
“It’s worth noting this again. While options traders have been picking up their speculative activity since getting slapped in September, by some measures it’s back to record levels. Last week, speculative call buying-to-open among the smallest of traders, those buying 10 or fewer contracts at a time, reached a record high relative to all opening transactions.”
Again, such doesn’t mean the market will correct immediately. What it does mean is this “excess speculative attitude” provides the “fuel” for a reversion when it occurs.
Caution is advised.
December 7, 2020
2:00 pm EST
GOLD
Over the last 6 trading days, gold has had an impressive run, gaining almost 6%. It is now hitting formidable resistance in both the top of the recent channel and the 50-day moving average. If gold can break through both barriers and take out the early November highs, it may likely make a run for all-time highs. If it fails here, we will look for the 200-day moving average and then the lower channel band for support.
MAJOR MARKET REVIEW
The markets are pushing extremes rarely seen in history. The downside risk currently outweighs the reward from excessive bullishness from investors, extensions, and deviations from long-term trends.
S&P 500 Index – Take Profits
The commentary for the S&P 500 holds through all the charts below.
As shown, the S&P is now 3-standard deviations above its moving average, and more importantly, extremely deviated from its 200-dma. This is a situation that has historically not ended well for investors.
We recommend taking profits, reducing risk, and being patient for an opportunity to deploy capital. While we were a bit early in our actions, we expect to be rewarded sooner than later.
Small and Mid Cap – Take Profits
The same applies to Small and Mid-Cap exposure. While the recent rally has been based on a rebounding economy as the vaccine is distributed, there is little “value” left in the small and mid-cap trade.
As above, take profits and reduce the risk for now. The deviation from the long-term means is so great that a reversion will be quite nasty. All you need is the right catalyst, which will likely come rather unexpectedly.
Emerging Market and International – Take Profits
Again same story as above. Take profits and reduce risk. Extreme deviations from the long-term means suggest a reversion will be larger than normal. Also, whatever “value” that existed based on economic recovery has been fully priced-in and then some.
USD and Bonds – Build A Position
The biggest risk to the Small, Mid, Emerging Market, and International trade is the US Dollar.
The dollar is so deeply oversold and extended below the long-term that a reversion is exceedingly likely. The counter-trend bounce will get “fuel” from the large net-short positioning that has piled into the Dollar. If you want to hedge your portfolio, now is a good time to start building or adding to your long-dollar hedges.
Of course, if the dollar does rally, that means foreign inflows will have to go into U.S. Treasuries, which will drop rates back towards the recent lows. The run-up in rates towards 1% is approaching the “danger zone,” where it will begin to impact current economic activity and valuations.
We removed our TLT position last week as we begin to restructure our bond portfolios, BUT there is a good trade set up for TLT or EDV that we may look to take advantage of short-term.
The first week of December continued the bullish run as exuberance exploded higher in anticipation of more stimulus and a vaccine. If there was only a sign that told us that risk outweighs the current reward.
December 3, 2020
PORTFOLIO UPDATE – EQUITY PORTFOLIOS
We are increasing our holding in PSA (Public Storage) from 1% to 2% in portfolios.
After adding our position initially, PSA advanced strongly. We have been waiting for an opportunity to bring the position up to normal portfolio weight. With the pullback to the bottom of the Keltner Channel, and the MACD looking to turn positive, with the Williams %R turning up, we are adding to the position.
December 2, 2020
PORTFOLIO UPDATE – EQUITY / ETF PORTFOLIOS
As we continue to adjust our portfolio exposure, we added positions that have gotten oversold as of late and may provide a bit of hedge against a potential risk-off rotation. We are also taking profits in a couple of extremely overbought positions.
EQUITY
AMD – reduce by 0.5% from 2% to 1.5%
CMCSA – reduce by 0.5% from 2% to 1.5%
GOOG – reduce by 0.5% from 2% to 1.5% (See note below)
CRM – increase by 0.5% to 2.5% (Acquisition of Slack will be accretive to future growth)
WEC – add 1% (open new position)
D – add 1% (open new position)
(GOOG – in the RIAPRO portfolio there was NO transaction in GOOG due to the dollar size of the stock. The live account we set up for RIAPRO was $100,000 in 2019. However, for RIA Advisor Clients, whose accounts are much large in size, they own multiple shares of GOOG which allowed for a reduction in total size. While there was NO transaction in the RIAPRO portfolio, it did occur for our client portfolios.)
ETF
XLC – reduce by 1% from 6% to 5%
XLY – reduce by 1% from 5% to 4%
XLU – add 2% to increase the position to 4%.
Why XLU, D, and WEC?
We thought it would be helpful to walk you through our analysis backing the addition of XLU, D, and WEC to our models. For starters, we think the markets are overbought, exuberant, and due for a correction. We are reducing equity exposure and shifting exposure to “safer” sectors/stocks to help manage the situation. The utility sector is traditionally a lower beta, safer sector.
Second, the utility sector has been among the most oversold sector on a relative basis versus the S&P and an absolute basis. The first graph below shows that utilities are the most oversold of the sectors on an absolute basis. This came from our latest weekly Technical Value Scorecard.
So if we increase XLU in the sector model, which stocks should we buy for the equity model? To help answer the question, we use a similar analysis that breaks out the company’s Utility sector, as shown in the second graph. This table compares each utility company versus XLU as well as each company against each other company. In today’s instance, AEP, WEC, XEL, ED, and D are the most oversold versus XLU and most other utility companies. From there, we use fundamental and technical analysis to help choose between the five.
December 1, 2020
PORTFOLIO UPDATE – EQUITY / ETF PORTFOLIOS
We are making some changes to our bond portfolio as we wrap up the year to put us in a position to capitalize on our portfolio allocations next year.
Selling 100% of TLT
Reducing PFF from 5% to 3% of the portfolio
Such will drastically shorten our duration temporarily to hedge risk, but give us the flexibility to restructure the fixed income portfolio as we enter into 2021.
Yesterday, the sectors we have been warning about being egregiously overbought, extended, and deviated from long-term means, corrected. These sectors also coincide with our recent reductions in Industrials, Materials, Transportation, Financials, and Energy exposure.
These sectors are part of the “reflation trade” that took off post the election; the problem, as shown in the charts below, is that they all trading far above whatever “reflation” in the economy there will be.
CLICK on any image to enlarge.
XLB – Materials
Basic Materials started a correction process yesterday after surging well into 3-standard deviations above its longer-term averages.
Notably, Materials are significantly deviated from its 200-dma and well above the pre-pandemic highs. Such is essential considering that economic growth is substantially weaker than it was then, and materials are a function of actual economic activity.
As noted previously, take profits and reduce the risk for now. There is a decent amount of downside risk if the “bullish trade” begins to unwind.
XLE – Energy
Like Materials, Energy pushed well into 3-standard deviations territory and is well ahead of the economy’s underlying fundamentals and potential earnings growth. I have an article coming on Friday explaining why the rally in oil was premature and why we previously reduced our position in CVX.
Take profits and rebalance risks for now. Look for a pullback towards the 50-dma to start adding back to exposures.
XLF – Financials
Financials are exceptionally far ahead of the economy. Financials depend on higher interest rates for profitability. Furthermore, with the end of the year approaching, the moratoriums on housing and rent go away. There is a substantial risk to financials from a weaker economy ahead. Take profits in financials and markedly reduce the risk for now.
XLI – Industrials
Industrial, like Materials, depend on real economic activity for profitability. With industrials trading well ahead of actual economic growth, take profits and rebalance risk. Look for a pullback to start looking to add back to exposures. However, be aware of the relatively massive deviation from the 200-dma, which could quickly get filled if economic weakness shows up sooner than expected.
XTN – Transportation
Transportation also is heavily dependent on real economic activity. We have reduced our exposure to the sector and are looking for a correction back to the 50-dma to add back to holdings. Like with Industrials, the deviation from the 200-dma is rather extensive and is not outside the realm of possibility for a correction to fill. Trade accordingly.
November 30, 2020
MAJOR MARKET REVIEW
First, grab this weekend’s full commentary which discusses the more extreme nature of the market currently.
The major market review follows with some expanded commentary by Michael Lebowitz on gold.
With the November market surge, the risk of a correction is elevated with distribution season for mutual and pension funds. A look at the deviations in markets, a review of the risks, and 7-trading rules to follow.
The message this week is simple. “Time To Take Profits” and look for the next trade.As you will see in all of the charts below, the deviations from intermediate-term means are now extremes. As such, this is an excellent time to take some actions to reduce risk and hedge for short- to intermediate-term market correction.
WTIC – Oil
Over the last 3-years, whenever oil prices have become more than 3-standard deviations above the mean, a correction has ensued. Such will likely coincide with a counter-trend rally in the dollar and gold. With oil prices and energy stock prices grossly extended, this is an excellent time to take profits and reduce position sizing near-term.
EEM – Emerging Markets
Emerging Markets have had a huge run over the last couple of weeks, far ahead of any potential economic recovery. Given the dependence of emerging markets on the U.S. for activity, there is a very high likelihood of disappointment. Take profits and reduce exposure currently. Look for pullbacks to support and decent oversold conditions to add exposure to portfolios.
EFA – International Markets
So goes Emerging Markets, so goes International. Same story, just a different basket of countries. Notably, the US Dollar is critical here. So far, the markets have been unable to muster a robust counter-trend rally in the dollar, but it is coming. Take profits and reduce risks currently. Look for a deep oversold condition and correction to start adding positions into portfolios.
GLD – Gold (and by extension Gold Miners)
Conversely, Gold and Gold Miners are incredibly oversold. A correction in the markets will likely push money into gold as a hedge temporarily. With gold 3-standard deviations OVERSOLD, and the long-term sell signal at the lowest levels seen in years, gold could have a powerful counter-trend rally. We added to our gold miners (GDX) last week and will look for signs of life to add to our gold holdings (IAU). Traders can start building positions here.
“The last time gold was as oversold as it is today was in mid-March. As shown below, gold is trading slightly below its 200 dma and at RSI and MACD levels last seen in March. Making the recent sell-off more interesting is that a weak dollar and record negative-yielding debt, as we have today, have been decently correlated with increasing gold prices. However, and as we will show and discuss later today, real interest rates are rising which has a strong negative correlation to gold prices.” – Michael Lebowitz
SLYV – Small-Cap Value & MDYV – Mid-Cap Value
Small and Mid-Cap stocks (and particularly value stocks) have gone parabolic. Furthermore, this sector of the market is very dependent on strong domestic growth. Given that economic recovery shows signs of stalling, these markets are too far ahead of what will come to pass.
Take profits, reduce holdings, and look for deep correction and oversold conditions to add positions back to portfolios.
With the November market surge, the risk of a correction is elevated with distribution season for mutual and pension funds. A look at the deviations in markets, a review of the risks, and 7-trading rules to follow.
With the November market surge, the risk of a correction is elevated with distribution season for mutual and pension funds. A look at the deviations in markets, a review of the risks, and 7-trading rules to follow.
As shown below, we are continuing to use this rally to raise cash and reduce portfolio risk heading into December. We will add back to our holdings on a decline.
Today, we are taking small profits in areas that are pushing 3-standard deviations above their 50-dma’s.
Equity Portfolio:
CMCSA – reducing from 2.5% to 2.%
KHC – reducing from 2.5% to 2%
GDX – increasing from 2% to 2.5% due to its move to 3-standard deviations below the 50-dma
ETF Portfolio:
IYT – reducing from 2% to 1%.
GDX – increasing position from 2% to 2.5%
9:35 am EST
Investors are ALL In. A correction is very likely over the next two weeks as pension funds have to rebalance and mutual funds have to distribute capital gains and income. Both have record low levels of cash on hand.
As noted in today’s Technically Speaking Reportinvestor exuberance is way ahead of reality currently. However, such is not surprising in a holiday-shortened trading week. With the “inmates running the asylum” there is general upside bias heading into Thanksgiving.
However, as we kick off the first two weeks of December, there will be selling pressure as mutual funds have to make capital gains distributions and pension funds will rebalance for year-end. Such could certainly weigh on asset prices short term particularly with the extreme extensions seen currently.
Such is particularly the case in Industrial, Basic Materials, and Energy. These sectors have gone parabolic over the last couple of weeks on a belief that a vaccine will cure what ails the economy. The problem with the economy is much more than the “pandemic” and these sectors are heavily dependent on stronger economic growth which will be unlikely given the massive increase in debts and deficits.
Take profits and rebalance portfolios. Move stop-loss levels up to the 200-dma for now.
It is also recommended that you take profits in Financials and reduce risk accordingly. Move stops up to the 200-dma for now. Financials depend on higher interest rates for increased profitability which are not coming due to the negative impact on the economy from rising rates.
Technology, Healthcare, Utilities, and Staples are all correcting a bit as of late. Such will provide a good opportunity for a “risk-off” rotation as portfolio rebalancing occurs over the next few weeks. Once we get into 2021, we will be able to start gauging the effectiveness of potential policies and just how soon a “vaccine” will or won’t be available.
November 23, 2020
12:05pm EST
Portfolio Trades – Equity & ETF Models
With the Money Flow “sell signal” now triggered, see 3-minutes on Markets, we are continuing to reduce our exposure gradually as we head into Thanksgiving.
Reducing TLT by 2.5% after a nice runup. Taking profits and reducing position size to 10% from 12.5%.
Reducing CRM by 0.5% from 2.5% to 2.0% (Equity Portfolio)
Reducing XLK by 1% from 10.5% to 9.5%. (ETF Portfolio)
Over the last two weeks, the media has been repeating the latest narrative – the “value rotation” is finally here. While small-cap value certainly had a big week, it is now the most overbought it has been in 15-years. More importantly, the small-cap space is the most vulnerable to an economic shutdown, rising virus cases which crimps spending, and sentiment. Also, there is actually very little “value” in value currently due to the price increases, and small-cap companies is the one area most burdened by debt. Be sure and know what you own.
We would recommend taking profits and reducing risk if you have exposure to this area.
Taking Profits In Bonds
Two weeks ago we added 5% to our TLT position in our portfolios. For us, bonds are a hedge against market weakness as money rotations to bonds for safety. That trade has worked well over the last few days and we sold 1/2 of our previous addition early last week, and we will sell another 2.5% to 5% most likely this week as bonds are now back to extremely overbought and running into the 200-dma.
Time To Sell Energy Stocks
We have been discussing a setup for an energy trade for several months and it finally occurred. However, both energy stocks and oil prices are very extended short-term so look for weakness here soon. In fact, every time oil prices have been this extended (note red circles) oil prices have corrected which will take energy stocks down with it.
Take profits, reduce risk, and rebalance as needed. Be careful speculating in this sector. Energy stocks need much stronger economic growth to increase profitability and that isn’t happening anytime soon.
NEW DASHBOARD LAYOUT
We are in the process of redesigning the dashboard to provide you a quick snapshot of what is going on, what’s driving markets, and some things to help you generate trading ideas.
Let me walk you through it.
Starting at the top you will see major market data. We will be adding selectable major market graphs very shortly.
We are moving away from writing lengthy articles, to running a “daily diary.” The Real-Time Commentary and Portfolio Trading Diary will house our ongoing comments throughout the day on what we are watching, trading, and looking at. Sectors, Markets, and Fixed income comments will be found here. Links to articles we write will also appear here.
Moving down, you will find a daily economic calendar and what is moving markets
Below that you will find the latest major news headlines from major news sources. MyNews and MyAlerts are specific to stocks in your portfolio, watch lists, or alerts (set alerts up in the Portfolio tab) Also, we have set up two tabs to show you what Dividends are being paid, and who is announcing Earnings, over the next 15-days.
Now that you know what’s going on and what is moving markets, it’s time to start thinking about generating some trading ideas.
We give you a list of the Top and Bottom-10 stocks in the S&P 500 index.
Next are the stocks with the highest and lowest momentum.
Lastly, and my favorite, is a heat map of the sectors of the market. CLICK on any stock in the heatmap and below the heat map, you will see its performance versus the S&P 500, our quick synopsis of the stock, and a list of comparative stocks to consider. Next to each symbol in the table click the (+) sign for a “popout” window of charting and analysis on the stock.
COMING SOON
We have a laundry list of new things coming soon:
Auto-generated portfolios for stock / etf selection
Advanced charting (save your settings and create your own styles)
Graphing fundamental data
Trade direct from your portfolio to your account. (Interactive Brokers)
Chart Click-To-Trade while in a chart, you can “right-click” and trade the stock in your IB portfolio.
Auto-Traded Models – you will be able to select a model and have it automatically managed for you.
New sentiment and trading measures will be added to the Market Internals page including our Technical Gauge, Greed/Fear Allocation Gauge, and our proprietary Money Flow indicator.
Financial planning tools
and more.
If you have any questions or comments simply click the MESSAGE BOX in the lower-right hand corner of the screen to drop us a line.
November 16, 2020
As noted in this past weekend’s Real Investment Report the market has gotten back to more extreme overbought, extended and bullish levels. Historically, such a setup has led to short-term corrections, or worse.
While the vaccine news on this morning is certainly welcome, the markets have already priced much of that into stocks currently. Considering a vaccine won’t be widely available to mid- to late-next year, the economic weakness will continue to weigh on profitability for now.
As such, we are taking profits in some of our more egregiously extended positions and will use a post-Thanksgiving correction to add back to holdings at a cheaper level.
Equity Portfolio – Taking Profits
CVX from 2.5% to 1.5%
CMCSA from 3% to 2.5%
GOOG from 2.5% to 2%
AAPL from 3% to 2.5%
VZ from 3% to 2.5%
UNH from 2.5% to 2%
CVS from 2% to 1.5%
TLT from 15% to 12.5%
ETF Portfolio – Taking Profits
CVX from 2.5% to 1.5%
XLV from 9% to 8%
XLP from 6.5% to 5.5%
XLB from 3% to 2%
TLT from 15% to 12.5%
November 11, 2120
EQUITY & ETF Portfolios:
While the Pfizer news caused a couple of days of sector rotation, the reality is that a vaccine is not coming soon. As such, the markets are going to start gravitating back to companies that can grow earnings regardless of the economic environment as people remain working from home and the virus remains a threat.
As such we used the pullback in CLX to add to our position. Also, bonds got extremely oversold (3-standard deviations below the 50-dma) which is an ideal setup for a trade.
In Both Portfolios:
Add 1% to CLX bringing the total weight up to 3% of the portfolio.
Add 5% to TLT bringing the total weight up to 15% of the portfolio.
November 4, 2120
EQUITY & ETF Portfolios:
While the actual Presidential election is still up in the air, it appears that the GOP will retain control of the Senate which greatly limits the ability to the President to do drastic things. As such, this shifts the focus of the market back to areas that can create earnings growth in a slower economic environment and areas that will benefit from more “stay-at-home” companies.
This clears the path for the market over the next couple of months of some of the downside risk, and with the money flow signal turning positive, we are adding to the “growth areas” of our portfolios.
EQUITY –
Selling 100% of SH
Selling 100% of DOX
Adding 1% to our current holdings of AAPL, CRM, ABT, CMCSA, NFLX, AMD, UPS, and KHC.
ETF –
Adding 1% to our current holdings of IYT, XLK, XLV & XLP
Adding 2% to our current holdings of XLY, XLC
November 2, 2120
EQUITY & ETF Portfolios:
As we have discussed in the newsletter over the last couple of weeks, we have continued to raise cash and de-risk models as we get closer to the election. While polls have tightened considerably in recent days, we have absolutely no idea who will win the election. However, such is not the risk. The risk to the markets is a “contested” election which could likely last days to weeks to find out the results. There are many states which have between 3-10 days to certify their vote tallies. Then there is the risk of the lawsuits that follow.
As such we are hedging our portfolios by adding a 5% position in SH – Short S&P 500 Index. We will remove the position as soon as we have some clarity on the election outcome and market direction.
Buy 5% SH in portfolios (new position)
October 27, 2120
EQUITY Portfolio:
Sell 100% of MCHP for a gain
Initiate 1% of AMD in portfolios
We are swapping out chip companies in the portfolio. We very much like the acquisition by AMD of XLNX which puts them in a prime position to take market share from INTC. We are starting with a 1% holding and will add to AMD on further weakness.
October 23, 2120
ETF Portfolio:
Reduce XLU by 1.5% from 3.5% to 2.0% weighting.
Utilities have gotten egregiously overbought in recent weeks and is due for a correction. We have milked that position for a bulk of its gains, so we will look for a correction to rebuild the position.
October 22, 2120
** UPDATE **
Equity Portfolio:
Buy 1% of GOOG bringing allocation up to 2% of the portfolio.
The position broke above the recent consolidation suggesting we could see higher levels in the short-term.
Prepping For The Election (Continued)
As noted during the entirety of this week’s portfolio transactions, we are continuing to prep for the election, and lack of stimulus, by raising cash and reducing risk as needed.
Equity & ETF Portfolio:
Sell 100% of AT&T (T)
We originally purchased AT&T with an expectation that value would provide some relative safety to the market. However, the position violated our stop-loss with the recent breakdown. We held the stock for earnings expecting an earnings beat might lift the stock to give us a better exit point.
This morning, AT&T reported earnings were actually were weaker than estimates but guidance was good and the stock popped nicely at the open. We used that as an exit for the position.
October 21, 2120
** Updated**
Prepping For The Election (Continued)
Continuing from yesterday’s portfolio update, we are continuing to slowly raise cash ahead of the election.
Equity Portfolio:
Reducing NFLX by 1.00%
Reduced TLT by 5% (from 15% to 10%)
ETF Portfolio
Reducing XLC by 1.00%
Reduced TLT by 5% (from 15% to 10%)
October 20, 2020
Prepping For The Election
Given the potential for a contested election, which is likely the biggest risk for the market short-term, we are beginning the process of raising a bit of cash in the portfolios. This is a process we will continue over the next week as reduce/sell laggards, take profits, and rebalancing hedges.
Once we get through the election, if everything goes smoothly we will then bring weightings back up in portfolios.
Equity Portfolio:
Reducing CRM by 0.50%
Reducing AAPL by 0.50%
October 8, 2020
Equity / ETF Portfolio Update
Lately, Utilities (XLU) have been on a run and have gotten both very extended and overbought. We are taking profits in the sector. DUK had a big jump due to takeover rumors from NEE. We are closing out the entire position to remove the “buyout risk” of something falling through. We were very overweight XLU so we are reducing that position by 50%.
In the Equity portfolio, we are adding 0.5% to our holdings of T and VZ.
In the ETF portfolio, we added 1% of the portfolio to XLB and XLY to bring those positions up to weight.
Equity Portfolio:
Sell 100% of DUK
Add 0.5% of portfolio weight to VZ bringing total weight to 3%
Add 0.5% of portfolio weight to T bringing total weight to 3%
ETF Portfolio
Sell 3.5% of XLU – Reducing weight from 7% originally.
Buy 1% of XLY – Bringing total weight up to 3%
Buy 1% of XLB – Bringing total weight up to 3%
October 6, 2020
Equity / ETF Portfolio Update – Adding To Long Holdings / Adjusting Fixed Income
As noted yesterday, with the President back at the WhiteHouse, the short-term risk trade against our long-positions was removed. With the break above the 50-dma yesterday, there is upside bias short-term potentially back to all-time highs. The MACD turned positive, but the Williams %R is starting to hit back into overbought territory.
Given the more bullish tone short-term, we are adding to some of our underweight positions that we previously took profits in, and adjusting our fixed-income bucket to add additional yield.
Equity Portfolio
Bonds
AGG – 100% of holding
PFF – Initiating a 5% position of the portfolio.
Equity
Adding 0.5% of each:
V – increase weight from 1% to 1.5%
KHC – increase weight from 1% to 1.5%
MCHP – increase weight from 1% to 1.5%
ABT – increase weight from 1% to 1.5%
ETF Portfolio
Bonds
AGG – 100% of holding
PFF – Initiating a 5% position of the portfolio.
Equity
XLB – initiate new position of 2% of portfolio value.
October 5, 2020
Equity / ETF Portfolio Update – Closing Short Position
As we discussed on Friday,
“We have written previously that the one thing that will trip up the markets is an “unexpected and exogenous” event.”
On Friday, we hedged both portfolios for a worse than expected outcome from the President’s COVID infection. This morning, he seems to be out of the woods and back on the path to recovery. Therefore, with the markets clearing the 50-dma, we are removing our hedges to allow our recent portfolio additions room to work.
Selling 100% of SDS (2x Short-S&P 500)
October 2, 2020
Equity / ETF Portfolio Update
We have written previously that the one thing that will trip up the markets is an “unexpected and exogenous” event. The majority of the time, the markets tend to price in things that are “seen,” such as the lack of fiscal support short-term or a “s***-show” of an election.
What they weren’t expecting was the President to contract COVID just 30-days before the election. There are many potential ramifications from his incapacity to run, VP Pence running for President, or nothing happening, and Trump fully recovers in a couple of weeks.
We don’t know. So, while the markets are still operating functionally today, we are taking a bit of caution and increasing our hedges by taking the following actions:
Adding 2% of SDS (2x Short-S&P 500) to hedge our recent additions. We will increase sizing if markets begin to deteriorate.
Adding 1% to GDX – increasing our weighting to 3%.
Adding 1% to IAU – increasing our weighting to 3%.
October 1, 2020
Equity Portfolio Update (We are aligning portfolio weights with our Sector ETF portfolio)
This morning we got stopped out of our holdings in VIAC. We had added a 1% position to start but “value” is still not getting any attention for the time being. Also, with COVID cases kicking up in the NBA and NFL, it does not bode well for revenues over the next several months. We will revisit the position at a later time. In the meantime, we are keeping our same communications exposure by adding slightly to T and VZ.
As we reduce that one position, we are adding to areas that have been performing stronger as of late. After increasing our technology weighting and adding GOOG earlier this week, we are now adding to our Healthcare sector.
Trades:
Sell 100% of VIAC
Buy 0.5% of T increasing weight to 2.5%
Buy 0.5% of VZ – increasing weight to 2.5%
Buy 1% of UNH – increasing weight to 2.5%
Buy 1% of JNJ – increasing weight to 3%
September 28, 2020
Portfolio Update
We are adding equity exposure this morning as we are getting buy signals on some of our indicators. We remain cautious with only 50% equity exposure including the trades below. We may likely add further if the major indexes can rise above their respective 20 and 50-day moving averages.
Equity Portfolio:
+1.5% GOOG
+.5% AAPL
+.5% MSFT
+.5% ADBE
+.5% NFLX
+.5% CMCSA
+.5% VZ
ETF Portfolio:
+2% XLK
+2% XLY
+1% XLV
+1% XLC
September 24, 2020
Portfolio Update
We are adjusting our bond duration exposure and shifting our credit quality up the scale a bit to provide an additional level of defense as we move into a potential hotly contested election. Also, the strength in the dollar rally, should it continue, will attract more dollars towards Government bonds.
Equity & ETF Portfolio:
Reduce AGG from 12.5% of portfolios to 6%.
Increase MBB by 3% from 10% to 13% of portfolios.
Add 6% of IEF to portfolios
September 23, 2020
Portfolio Update
We have been discussing the extreme oversold condition of the US Dollar index combined with an extreme net-short positioning for some weeks now. The negative impact of a dollar rally would be felt most in Emerging Markets, International, and Commodities.
Due to the dollar strength and the increasing potential that it is breaking out of its recent consolidation range, we are reducing IAU and GDX by half. Also hampering the positions over the last couple of days is options expiration. We like the positions long term so will look to add back the sales when the time is right. Keep in mind we may sell the other half before adding back.
Equity & ETF Portfolio:
Sell 50% of GDX – Reduce to 1% of the portfolio
Sell 50% of IAU – Reduce to 2% of the portfolio
September 18, 2020
Portfolio Update
We are continuing to rebalance and consolidate our Equity portfolio, as noted in our previous trade alert. Today, we are selling two positions that we can concentrate on our holdings in DUK and PSA.
Equity Portfolio:
Sell 100% of WELL
Sell 100% of AEP
September 16, 2020
Portfolio Update
We are adding a starter position to RTX in the portfolio today. We are continuing to look to add yield as we rebalance and consolidate holdings.
Add 1% RTX
September 14, 2020
Portfolio Update
As noted last week, we are continuing to rebalance and consolidate our Equity portfolio. As noted:
“The overall decision is to reduce the overall number of holdings, eventually, to 20-25 so we can run more concentrated positions in companies we like long-term. This will give our winners more of an impact on overall portfolio performance going forward.”
We are continuing this process today by making additional changes due to the recent sell-off and oversold condition of the market short-term.
Equity Portfolio:
Sell 100% of PG
Adding 1% to CLX bringing total position weight to 2%
Adding 0.25% to AAPL bringing the position to 2%
Adding 0.50% to MSFT bringing the position to 2%
Adding 1.00% to CRM bringing the position to 2%
Adding 1.00% to ADBE bringing the position to 2%
ETF Portfolio:
Adding 1% to CLX bringing total position weight to 2%
September 11, 2020
Portfolio Update
With our concerns growing about the speculative underpinning of the market, longer-term more extreme deviations and overbought conditions, and a still weak economic backdrop we are beginning to restructure our portfolios to be more nimble with respect to risk management, but still maintain performance.
The overall decision is to reduce the overall number of holdings, eventually, to 20-25 so we can run more concentrated positions in companies we like long-term. This will give our winners more of an impact on overall portfolio performance going forward.
We are starting this process today by beginning to sell positions that are not performing as expected.
We are selling 100% of the holdings in both portfolio models.
Sell 100% of XOM
Sell 100% of PFE
September 4, 2020
*** Trade Update ***
Selling 2.5% of our recent TLT purchase to take the profit on that position. Moving TLT back to target portfolio weight of 15% down from 17.5%.
Over the last couple of weeks, we have been prepping portfolios for this decline. Now, with a pretty brutal 2-days of selling, we are going to add some trading positions for a potential bounce next week.
Given the momentum markets are very hard to kill, it is likely we will see some attempts to jump back into the previous leaders next week. So we are going to add some small amounts to our momentum trades, and counter that exposure with additional value trades.
As noted in our previous trading update, we are continuing to follow our process of reducing risk as the deviation from long-term means is hitting historic extremes.
Since we have added another 10% to our Treasury Bond holdings (TLT) the need for the US Dollar hedge is no longer necessary. Also, given it is a small percent of the portfolio, it isn’t large enough to add any additional benefit at this juncture due to the increase in our bond allocation.
We are also selling our position in CSCO. The reason for the sale is simply to reduce laggards in the portfolio and raise a bit more cash to the portfolio for now. We still like the company fundamentally and will likely return it to the portfolio in the future if performance begins to improve.
Selling:
100% of UUP
100% of CSCO
August 31, 2020
As noted in this past weekend’s newsletter,we discussed the more extreme overbought and extended conditions of the market. We also discussed the potential rotation to value during any forthcoming pullback/correction in the market to reduce some of the most extreme overbought conditions we have seen throughout market history.
As such we are taking some actions in portfolios, as we have been, to continue to hedge against a potential risk-off rotation and correction.
EQUITY PORTFOLIO
Sell NFLX from 2.5 to 2%
Sell VZ from 1.5 to 1%
Sell ABT from 1.5 to 1%
Sell MSFT from 1.5 to 1%
Sell MCHP from 1.5 to 1%
Rebalancing, after taking profits recently, CRM and ADBE back to their model weights (1% each)
Buy 2.5% TLT increasing stake from 15% to 17.5%
ETF PORTFOLIO
Sell XLK from 8 to 6.5%
Sell XLC from 5 to 4%
Buy 2.5% TLT increasing stake from 15% to 17.5%
August 28, 2020
TRADE UPDATE – EQUITY & ETF PORTFOLIOS
After the Fed’s announcement yesterday, we are using the opportunity to add back into our gold and gold miner positions.
Adding in both portfolios.
IAU – Buy 1%. (Increasing from 3% to 4% of the portfolio.)
GDX – Buy 1%. (Increasing from 1% to 2% of the portfolio.)
August 21, 2020
TRADE UPDATE – EQUITY & ETF PORTFOLIOS
As we have been discussing lately, we are making subtle changes to the portfolio to rebalance the risk profile to a more defensive allocation. With markets overbought, on a money flow sell signal (see video), and entering into a pre-election September, we are raising a bit of cash today in the most aggressively overbought positions.
Today, we made the following changes:
Equity Portfolio:
SELLS
100% EFV from 3.00% to 0.00%
Sell 0.5% AAPL from 1.75% to 1.25%
Sell .5% ABBV from 2.00% to 1.50%
Sell .5% ABT from 2.00% to 1.50%
Sell .5% ADBE from 1.50% to 1.00%
Sell .5% AMZN from 2.50% to 2.00%
Sell .5% CRM from 1.50% to 1.00%
Sell .5% PG from 1.25% to 1.00%
Sell .5% V from 1.50% to 1.00%
Sell .5% VZ from 2.00% to 1.50%
BUYS
Buy 0.5% NFLX from 2.00% to 2.50%
Buy 1.00% PFE – New Position
ETF Portfolio
Sell .5% XLI from 1.50% to 1.00%
Sell .5% IYT from 1.50% to 1.00%
Sell 100% EFV (Liquidate position)
August 18, 2020
TRADE UPDATE – EQUITY & ETF PORTFOLIOS
As discussed yesterday:
“We are starting to make subtle changes to the portfolio to rebalance the risk profile to a bit more defensive allocation. We are doing this is two steps by making ‘sells’ today, and tomorrow morning we will make the ‘buys.'”
Today, we made the following changes:
Equity Portfolio:
Buy 1% VIAC (New position)
Buy 1% WELL (New position)
Buy 1% PSA (New position – Trade corrected for proper entry price $198.99)
“With the markets overbought on several measures, there is a downside risk heading into the end of the month. These risks come from several fronts we will discuss momentarily. However, from a technical perspective, the downside risk is about 5.6% to the 50-dma and 9.4% to the 200-dma. (Shown above)
A 5-10% decline in any given year is not outside of the norm. However, since investors have entirely forgotten what a drop feels like, a 5-10% slide will “feel” worse than it is.”
With this in mind we are starting to make subtle changes to the portfolio to rebalance the risk profile to a bit more defensive allocation. We are doing this is two steps by making “sells” today, and tomorrow morning we will make the “buys.”
REDUCING POSITIONS:
UPS from 1.25% to 1.00%
UNH from 2% to 1.50%
MSFT from 2% to 1.50%
PG from 1.50% to 1.25%
WMT from 1.25% to 1.00%
CMCSA from 2% t0 1.50%
August 14, 2020
TRADE UPDATE – EQUITY & ETF PORTFOLIOS
As noted yesterday, we are beginning the process of adding some “value” to the portfolio. We added to both portfolios a 3% weighting in International Value (EFV) with a 3.46% yield. We are in the process of adding a couple of other value related names here soon.
We continue to hedge our exposure opportunistically, so we are adding to our long-dollar position which is extremely oversold and deviated from its long-term mean. More importantly, the net short positioning in the dollar is now at levels which historically coincides with bottoms.
That net-short positioning in the dollar is also a “Buying” opportunity for Treasury bonds as well.
We are adding:
UUP increasing 1% from 2% to 3% of portfolio.
TLT increasing 2.5% from 12.5% to 15% of portfolio.
STOP ALERT – CSCO (Update)
CSCO is extremely oversold after yesterday’s selloff, so we are looking for a bounce to sell into. We will update when we execute.
August 13, 2020
TRADE UPDATE – EQUITY & ETF PORTFOLIOS
As noted yesterday, we are beginning the process of adding some “value” to the portfolio. We recently added AT&T, and previously bought XOM. (Seelatest value report here)
We are adding to both portfolios a 3% weighting in International Value (EFV) with a 3.46% yield. We are looking to add a couple more “value” holdings to the portfolio over the next couple of weeks as well.
Buy 3% EFV
STOP ALERT – CSCO
We have been stopped out of Cisco Systems (CSCO) with the earnings report today. Earnings were good but forward guidance was disappointing. We are going to wait until tomorrow to sell the position to see if the knee-jerk selloff this morning gives way to some early buyers in the morning. Net loss will be between 5-6% on the position.
August 12, 2020
TRADE UPDATE – EQUITY & ETF PORTFOLIOS
As we have noted over the last few weeks, both precious metals have become grossly overextended, and as such, we were expecting a pullback. In this week’sMajor Market Buy Sell Review we stated the following:
Gold is extremely overbought and starting to push 4-standard deviations above the 200-dma.
We suggest taking some profits for now and look for a pullback to increase our sizing.
We had previously taken profits, and hedged the position with a long $USD trade, but the pullback was so sharp yesterday it gave us an opportunistic entry point to add back into our Gold Miners (GDX) that we had bought and sold previously.
We are also making room in the portfolio to add some additional “deep value” positions to go along with our recent purchase of AT&T (T).
EQUITY PORTFOLIO
Buy 1% GDX
Sell 100% of BLL
Sell 0.5% of CLX (Holding 1%)
ETF PORTFOLIO
Buy 1% GDX
Sell 0.5% of CLX (Holding 1%)
August 6, 2020
TRADE UPDATE – EQUITY & ETF PORTFOLIOS
As noted in our“Value Seeker Report” this morning, we added a 2% weighting of AT&T (T) to both portfolios this morning. We continue to look at building a small portion of the portfolio based on “value,” plus the 7% dividend yield gives us return while waiting for appreciation.
Buy 2% T
August 3rd, 2020
TRADE UPDATE – EQUITY PORTFOLIOS
** Trade Correction: On 7/28 we sold EFA but incorrectly listed the sale price as $83.701 vs $63.701. That was corrected today.
After adding to our technology holdings last Thursday, Apple (AAPL) sprinted higher after earnings and is well into 3-standard deviation extremes from its moving average. We are taking some profits here.
SELLING 0.5% Apple taking it from 2% to 1.5% in portfolio models.
We have been looking for a candidate to add to our Technology holdings in the semi-conductor space. While there are other companies we like better, many of theme (like Nvidia as 20x price-to-sales) are trading at extreme valuations.
We are added 1% of Microchip Technology (MCHP) to our portfolios.
It is currently trading at a much more reasonable valuation (although still expensive), EPS have been rising without the benefit of share buybacks, and carries a 1.45% yield currently. We are carrying a close stop at $100. If our thesis plays out we will add to the position on a breakout above current resistance.
Buy 1% – MCHP
July 30, 2020
TRADE UPDATE – EQUITY AND ETF PORTFOLIOS
As discussed in Tuesday’s Sector Buy/Sell Review– we there were several sectors like Transportation, Materials, and Industrials which were getting more extreme in terms of their overbought conditions. Technology, conversely, has been in a consolidation over the last couple of weeks working off some that extreme short-term.
As we also discussed, the U.S. Dollar is deeply oversold, which is why we are accumulating a position in it now, which will also weigh on sectors with large international exposures when it rebounds. As such we have rebalanced some weightings in portfolios but have NOT increased overall exposures.
In the EQUITY Model.
After taking profits in our tech positions at the peak a couple of weeks ago, we added back to those expsoures.
ADBE 1 to 1.50
CRM 1 to 1.50
AAPL 1.5 to 2
NFLX 1.5 to 2
AMZN 2 to 2.5
MSFT 1.5 to 2
We sold 100% of the following to reduce our dollar exposure risk:
RTX – Sold All
NSC – Sold All
In the ETF Model we made the following changes.
Add 2% to XLK
Sell 1% XLI
Sell 1% IYT
July 28, 2020
TRADE UPDATE – EQUITY AND ETF PORTFOLIOS
As discussed in Monday’s Major Market Buy/Sell Review– the U.S. Dollar is now 3-standard deviations oversold. Also, the over riding sentiment from the mainstream media is massively negative. (This is always a good contrarian indicator).
Given the deep oversold condition of the dollar, we are expecting a counter-trend rally over the course of the next month which will coincide with a correction in EXTREMELY extended Gold, Silver, Commodity, International and Emerging Market positions.
We have taken the following actions in our portfolios today:
EQUITY PORTFOLIO
Sell 100% EFA
Sell 1% IAU
Buy 1% UUP (Bringing weighting up to 2% – we are scaling up the position.)
ETF PORTFOLIO
Sell 100% EFA
Sell 100% EFG
Sell 1% IAU
Buy 1% UUP (Bringing weighting up to 2% – we are scaling up the position.)
July 24, 2020
TRADE UPDATE – EQUITY AND ETF PORTFOLIOS
With Gold and Silver getting all the attention as of late, it is important to know when this happens, it is generally a sign of excess and a good time to take profits and hedge some risk.
For precious metals, commodities, and emerging and international markets, the key to watch is the dollar. The fall in the dollar over the last couple of months has sent those “dollar sensitive” assets soaring. With the dollar now deeply oversold on an intermediate term basis, a reversion is quite likely. Timing is all the key issue.
We are starting to build a long dollar position in portfolios to hedge our risk in Gold and International Markets. We are going to start small and add to the position as it bottoms and turns up.
Buy 1% of UUP.
July 21, 2020
TRADE UPDATE – EQUITY AND ETF PORTFOLIOS
Yesterday, the S&P 500 broke out of its 45-day long consolidation, this is “bullish” especially when combined with the recent “Golden Cross” of the 50- and 200-dma.
We have also recently discussed the weakening of the US Dollar and the potential benefit to commodities and international stocks. As such we have been slowly increasing exposure to these areas. (I am not a huge fan of international exposure for a multitude of reasons discussed previously, so these will likely not be long-lived positions.)
Today, we are adjusting our holdings a bit to both more closely align us with our benchmark index weightings, and to take further advantage of the weakening of the US Dollar.
Equity Model:
Buying:
1% ADBE
1% CRM
2% EFA – adding to existing position.
0.5% BLL – adding to existing position.
ETF Model:
Buying:
3% EFG – international growth to compliment current value tilt.
1% XLV – adding to existing position.
1% XLC – adding to existing position.
1% XLI – adding to existing position.
July 16, 2020
TRADE UPDATE – EQUITY AND ETF PORTFOLIOS
After failing to break above the June highs again yesterday, we are closing out of our SPY “rental trade” for the time being. We we look to re-add the position on either a further pullback towards the 50-dma that works off some of the short-term overbought condition, or a breakout above the June highs and the recent consolidation range.
Selling 100% of SPY
July 14, 2020
TRADE UPDATE – EQUITY AND ETF PORTFOLIOS
We are continuing our “risk” rebalancing in portfolios again this week after selling extremely overbought positions in Technology last week. We are selling our “Rental Trade” in DIA in both models to free up cash to add exposure to defensive rotation areas of the portfolio.
Equity Model
Selling:
CLX from 2% to 1.5%
UPS from 1.5% to 1.25%
WMT from 1.5% to 1.2%
Adding To:
BLL from 1% to 2%
XOM from 2% to 2.5%
CVX from 2% to 2.5%
CMCSA from 1% to 2%
Sector Model
Selling
CLX from 2% to 1.5%
Adding:
XLI (New holding) to 2%
XOM from 2% to 2.5%
CVX from 2% to 2.5%
July 10, 2020
TRADE UPDATE – EQUITY PORTFOLIOS
We are continuing to reduce risk slightly in portfolios as we head into August and September (typically weak performance months) by trimming out profits in stocks that are grossly extended and deviated from intermediate-term moving averages.
Today we are trimming slightly two more positions.
Reducing COST from 1.5% to 1%, and
Reduced PG from 2% to 1.5%.
July 9, 2020
TRADE UPDATE – EQUITY & ETF PORTFOLIOS
As we continue to watch the unfolding of the economic environment, we have grown ever more risk adverse to Real Estate due to potential impact of revenue shortfalls. While we liked the yield, performance has been a drag to the portfolios.
In both portfolios we are selling Real Estate:
SELL 100% of MPW
SELL 100% of WELL
SELL 100% of XLRE
We are adding 3% of EFA to both portfolios as we are seeing continued weakness in the US Dollar. With European countries handling the virus better than the U.S. combined with a potentially weaker US Dollar, we are hedging portfolios with a small weighting of International exposure.
BUY 3% EFA
July 8, 2020
TRADE UPDATE – EQUITY & ETF PORTFOLIOS
As discussed in today’sPortfolio Position Reviewwe took action in both of our models to take profits in our positions which have been extremely overbought and deviated from their 200-dma. Such extensions tend not to last long, and we will look to add back to our holdings following a correction or consolidation that reduces risk to a degree.
In the equity models we reduced our holdings in the following:
AAPL from 2% to 1.5%
AMZN from 3% to 2%
NFLX from 2% to 1.5%
MSFT from 2% to 1.5%
In the Sector Models we reduced the following:
XLC from 5% to 4%
XLK from 7% to 6%
July 6, 2020
TRADE UPDATE – EQUITY & ETF PORTFOLIOS
Added 2.5% SPY in both portfolios to bring the total weight up to 5%.
In the EQUITY Portfolio – we made changes to rebalance the compensation of the portfolio but did not change overall equity exposure by much. Hedges remain in place.
Reduced DUK and AEP by 1% each to make room in the portfolio to rebalance equity exposure.
Added 1% to CSCO to bring up to weight in portfolio.
Added 1% to BLL as we are underweight industrials in the portfolio.
Sold 100% of INTC which continues to underperform and broke our stop level.
July 2, 2020
TRADE UPDATE – EQUITY & ETF PORTFOLIOS
Bought 2.5% SPY in both portfolios to replace the sale of 2.5% of DIA.
Sell all (2%) of XLE in the Sector Portfolio
Sell (rebalance) UPS to take profits and bring it back to the 1.5% model weighting.
Wishing you a happy and festive holiday weekend!!
June 30, 2020
TRADE UPDATE – EQUITY & ETF PORTFOLIOS
We reduced our equity exposure slightly this afternoon as follows:
Sell 2.5% DIA – leaves 2.5% remaining
Sell CLX to bring it back to the 2% model weighting.
June 23, 2020
TRADE UPDATE – EQUITY & ETF PORTFOLIOS
After a brief rally in the US Dollar, we are selling 100% of UUP to reduce that hedge in the portfolio after making adjustments to our bond portfolio. (We are just rebalancing the hedges in the portfolios.)
A couple of weeks ago, we took profits in both XOM and CVX near their recent highs. Since then both have pulled back to support and gotten short-term oversold. As such, we are taking the opportunity to slighting increase those holdings in portfolios taking them back to 2% of the portfolio each.
Increasing XOM to 2% of Portfolio
Increasing CVX to 2% of Portfolio.
June 16, 2020
With the update to the corporate bond buying program, Trump’s touting of an “infrastructure bill,” and better than expected economic data on the retail sales front, the market was able to recover from yesterday mornings selloff and confirm support at the 200-dma.
With push by the Fed to support the corporate bond market we are swapping IEF for AGG to pick up some corporate bond exposure and improve our overall portfolio yield. This is in conjunction with our swap yesterday of SHY for MBB.
Equity & ETF Portfolio
Sell 100% of IEF
Buy 12.5% of portfolio in AGG
Buy 5% DIA
June 15, 2020
This morning we swapped SHY for MBB to pick some additional yield for the portfolio. There is little “upside” currently with rates so low, but with the Fed buying mortgage backed securities, we can add some “yield” to the portfolio with some potential upside and defensive positioning against a market decline.
Selling 100% of SHY
Buying 10% of MBB
June 12, 2020
After the market dropped over 5% yesterday and successfully tested the 200 day moving average, we made slight additions to the portfolios. The positions are small and we remain vigilant to potentially more downside as the S&P 500 sits on top of its 200 day moving average.
Equity Portfolio Buys
CMCSA – Initiate 1% position
CSCO – Initiate 1% position
ETF Portfolio Buys
XLE – Add 1% to bring total to 2%
XLP – Add 1% to bring total to 5.5%
We continue to hold our TLT and UUP positions for now as a hedge.
June 9, 2020
After adding some defensive rotation exposure yesterday, we took profits in a couple of positions that are extremely overbought currently.
Equity Portfolio Sells
PHG – Sell 100% of position
XOM – Sell down to 1%
CVX – Sell down to 1%
ETF Portfolio Sells
PHG – Sell 100% of position
XOM – Sell down to 1%
CVX – Sell down to 1%
XLE -Sell down to 1%
We are continuing to hold our TLT positions for now as a hedge.
June 8, 2020
The rally in the most fundamentally weak sectors of the market such as small, mid, materials, and industrials on the hope of a “V-shaped” recovery has gotten well ahead of itself and the potential for recovery. As discussed in today’s Major Market Review, those sectors are now 3-standard deviations overbought will Treasury bonds are 3-standard deviations oversold.
Our expectation is the momentum chase will fade pretty quickly as the realization of a slower economic recovery becomes more prevalent. This should lead to a defensive rotation in fairly short order where money starts to look for safety over risk.
As such we made the following trades today in both the Equity and ETF Models
Equity Model:
Added To
VZ – 1.5% to 2%
DUK – 2% to 3%
PG – 1.5% to 2%
INTC – 1% to 2%
NFLX – 1% to 2%
MSFT – 1% to 2%
AEP – 2% to 3%
ABT – 1.5% to 2%
ABBV – 1.5% to 2%
JNJ – 1.5% to 2%
AMZN – 1.5% to 3%
AAPL – 1% to 2%
ETF Model:
Added To:
XLK – 6% to 7%
XLV – 5% to 7%
XLRE – 4% to 7%
XLU – 3% to 7%
June 5, 2020
Selling 100% of GDX to close out for gain. Holding IAU for now.
June 4, 2020
Today, we sold Community Healthcare REIT (CHCT) in our portfolio in its entirely.
While we like the position very much, and there is nothing wrong the holding, we made the decision to sell based on the lack of liquidity for the shares in the market. We had an extremely difficult time liquidating the large number of shares that we owned (roughly 1/2 of the daily volume.).
We will be replacing the position with another REIT very shortly as soon as we identify the position.
*** UPDATE ***
We swapped CHCT with WELL in the portfolio at a 1.5% position. (1/2 target weight)
June 3, 2020
On Monday, we removed our “rental trade” on the S&P 500 for a small profit due to the rising protests across the country which could impact the economic reopening. The market didn’t even notice and has continued to push higher. With the market up 4-days consecutively, we will wait for a small correction back to towards the 200-dma to re-add that broad market position to the portfolio.
However, we continue to add equity exposure in areas that we like, with a focus on dividend yield, and continue to hedge that equity risk with offsetting bond and dollar exposures. (Bonds and the dollar are extremely oversold, so a rotation is likely near term which will coincide with a short-term market correction or consolidation)
In the EQUITY PORTFOLIO we are adding:
CVS – 1.5% – With people returning to activity, sales should pick up on the retail side.
UPS – 1.5% – Economic re-opening should see a pick up in shipping rates.
NSC – 1.5% – Same with transportation.
In the ETF PORTFOLIO we added:
XLU – 1% addition to current holdings.
IYT – 3% – Transportation sector to capture an increase in shipping with reopening.
In BOTH PORTFOLIOS we hedged the increases in equity risk with an addition of 2.5% to TLT which is currently deeply oversold relative to equities.
June 1, 2020
Last week, we added a 5% “rental trade” in SPY to the portfolio for a break above the 200-dma.
While the backdrop to the market is still bullish, as noted this weekend, we are VERY overbought short-term and extended on many measures.
With the riots breaking out all across the country, this is a new dynamic to the markets that potentially leads to some short-term selling. We are going to step aside on the rental trade at a small gain until we see how things shake out.
We will re-add the position to the portfolio when the risk/reward becomes a bit more clear.
May 28, 2020
If you didn’t read our trade update yesterday, we added 5% to SPY. For more commentary on why, read Michael’s note below:
Over the last couple of weeks we have talked about the consolidation of the markets between the 50% retracement levels and the 200-dma. This consolidation can either be bullish or bearish depending on which way it breaks out of that consolidation.
Today, on a second attempt, it appears the market will break out above the 200-dma and hold this time. With that breakout we are adding a 5% weighting to both EQUITY and ETF Models in SPY.
If the breakout holds the entirety of the week, or we have a pullback that holds the 200-dma, we will then add a second tranche of 5% to the portfolio.
Stop-loss is currently set at 2965
May 22, 2020
TRADE UPDATE: EQUITY & ETF MODELS
My wife and I went to the store today to pick up some cleaning supplies for the house. There were NONE in stock at 8-different locations we went to. After selling a portion of our CLX holdings at $205.69, we are adding 1% back to portfolios at $198.22 bringing our holding to 2%.
However, we are keeping our equity weighting the same by making some offsetting sells.
EQUITY MODEL
Buy 1% CLX
Sell 100% of CMCSA – stock is overbought, underperforming, and at a gain. We are going to take the profits and re-evaluate our communications holdings.
ETF MODEL
Buy 1% CLX
Sell 1% XLC – reduces our weighting back to 5% of the portfolio, selling recent addition for a gain.
May 21, 2020
TRADE UPDATE: EQUITY & ETF MODELS
In keeping with our process, and as we have detailed weekly in our newsletter, as we continue to add equity “risk” to portfolios, we also “hedge” that risk to protect our capital. In keeping with that process, we have added to our bond portfolio along with rebalancing duration a bit.
IN BOTH MODELS
SELL SHY – we reduced short-duration bond exposures from 11% to 8%.
BUY TLT – increased our 20-year duration from 8% to 10%
BUY IEF – increased the 7-10 year duration from 10% to 12.5%
May 20, 2020
TRADE UPDATE: EQUITY & ETF MODELS
With the markets successful retest of the consolidation breakout above the 61.8% retracement level today, we are adding additional exposure to our portfolio models at the close today.
EQUITY MODEL
INTC – 1.5% – Intel is a maker of semiconductors and broke above its consolidation channel today.
PHG – 1.5% – Phillips makes a variety of health care related products, but we are particularly interested in the UV (ultra-violet) lighting for disinfection purposes.
ETF MODEL
PHG – 1.5%
May 18, 2020
TRADE UPDATE: EQUITY & ETF MODELS
As we have been doing over the last couple of months, we continue to incrementally add exposure to portfolios as previous support levels hold, and resistance levels are taken out. Today, the markets broke out of the previous trading range we addressed over the weekend, which led us to increase exposure across both models.
Equity Model Additions: Current weighting next to symbol:
UNH – 1.5%
CMCSA – 1.5%
AEP – 1.5%
VZ – 1.5%
AEP – 1.5%
DUK – 1.5%
IAU – brought up to 4% of the portfolio
XOM – 1.5%
CVX – 1.5%
ETF Model Additions: Current weighting show next to symbol:
XLK – 6%
IAU – 4%
XLV – 5%
XLRE – 3%
XLC – 6%
XLU – 3%
XOM – added 1% to round out position in XLE
CVX – same as XOM
May 15, 2020
TRADE UPDATE: EQUITY MODEL
We added to our current holding of CHCT (Community HealthCare REIT) after it held support and rebounded late yesterday. As we have noted in our recent commentary, REITs have been lagging the market, so we have added to our REIT exposure this week to bring our weighting up for a rotational market play.
Earlier this week, we added MPW (Medical Properties REIT).
We also added 1.5% of Visa (V) to our equity holdings this morning as well.
Despite a slate of terrible economic news, the liquidity being pushed into the market is keeping stocks elevated so we are trading accordingly. We are currently on a seasonal SELL signal, so we continue to hedge our equity increases with offsetting purchases in fixed income. We added to IEF earlier this week bringing our overall weighting to 10%.
May 13, 2020
TRADE UPDATE: EQUITY & ETF MODELS
UPDATE – ERROR CORRECTION: We added 11-shares to IEF after the close today for a transaction we missed in November, 2019 in the ETF Model.
In both the equity and sector models we:
Added 2% of IEF to bring the total holding to 10%
Rebalanced and took some profits on CLX by reducing it down from 1.5% to 1% of the portfolio.
We still like CLX and believe their sales/revenue will be strong as the need for their products will improve upon the reopening of the economy. The stock was on a tear and we wanted to take some profits and hopefully add back to CLX at lower prices.
Trades will be posted once we get settlement details from the custodian.
May 11, 2020
TRADE UPDATE: EQUITY & ETF MODELS
(Trade Error – I entered the wrong symbol of CVS on the initial trade. I have corrected that in the portfolio.)
Equity Model:
We added
1/2 position (1.5%) of WalMart (WMT) to the portfolio on its recent pullback to support.
Brought Costco (COST) up to 1/2 position by adding .75% to our previous holding.
ETF Model
We added
1% to Staples (XLP) bringing that sector up to 4.5% of the portfolio.
1% to Communication (XLC) bringing exposure up to 5% of the portfolio.
Technology (XLK) remains at 5% of the portfolio
Healthcare (XLV) is slightly underweight at 4%. (Will likely be our next addition)
Real estate is lagging in performance and given the “yield chase” preference in the market, we will likely see some “catch up” in the sector over the summer. (For more on this reasoning please review our report onRelative Value Sector)
May 8, 2020
TRADE UPDATE: EQUITY & ETF MODELS
We are continuing to use the rally in the market to concentrate our holdings and rebalance the models the next leg of the market.
We SOLD 100% of Conagra Foods (CAG) in both portfolios for a small gain.
In the Equity Model we added 1.5% MPW (Medical REIT) to our Real Estate holdings of CHCT. This brings our total exposure to 2.25% currently.
In the ETF Model we added a 2% weight to XLRE (SPDR Real Estate).
Real estate is lagging in performance and given the “yield chase” preference in the market, we will likely see some “catch up” in the sector over the summer. (For more on this reasoning please review our report onRelative Value Sector)
May 7, 2020
TRADE UPDATE: EQUITY & ETF MODELS
After a 36% gain in GDX we are rebalancing the position back to our current model weight of 1.5%. Gold miners are extremely overbought and need to correct a bit before we can add back to the holding. We are looking to increase our weighting to 3% of the portfolio on the next opportunity.
May 5, 2020
TRADE UPDATE: EQUITY & ETF MODELS
With today’s rally, we are selling 100% of our “rental trade” in the S&P 500 (SPY) for a small gain.
While there is certainly an ability for markets to rally tomorrow, there is so much economic data coming into the end of the week on the employment front, we are just going to step aside and evaluate the data and reconsider our equity exposure at that time.
Given that we are heading into the seasonally week period of the year, the risk/reward dynamics aren’t great so we will take small wins where we can get them.
May 4, 2020
TRADE UPDATE: EQUITY MODEL
Our SPY trade is flirting with its stop loss level, so we are watching that closely.
However, we are reducing our equity exposure in the Equity Portfolio by 1.5% today by selling the remaining holdings of PEP and CVS for gains.
Heading into summer we are wanting to lower our risk profile in both portfolios to 30% equities, or less by adding hedges, as risk remains elevated.
Also, while we like both companies, our goal is to consolidate, and concentrate the number of holdings that we have in portfolios to 20-25 with larger weightings as we come out of the current malaise. This is just the first steps in that process. This does not preclude us from buying these shares back in the future.
May 1, 2020
TRADE UPDATE: EQUITY MODEL and SECTOR MODELS
We are taking profits in Merck (MRK) today selling 100% of the position.
We are sitting on our STOP LOSS for our SPY trade, but need to close below, and remain below on Monday to confirm the break if it occurs. We will update accordingly.
Part of the process this summer is to reduce the total number of equity holdings in the portfolio to 20-25 and run a more concentrated equity positioning coming out of this current consolidation/bottoming/bear market process. We are evaluating each position in the portfolio for long-term value, positioning, and relative performance.
Watch for changes.
April 30, 2020
TRADE UPDATE: EQUITY MODEL and SECTOR MODELS
Over the last few weeks, we have been steadily increasing equity exposure, but balancing that exposure with hedges against risk. This one step forward and pause method allows us to continue managing portfolio risk in a market that will likely correct in the month ahead. (Nothing goes straight up…even with QE)
Today, we added to existing holdings which have more “defensive” properties to them. This is setting us up to eventually start adding a hedge to our portfolio when we see a break of the bullish trendline from the recent lows.
Equity model: Increased exposure from 0.75% to 1.5% of portfolio: AAPL and MSFT
ETF model: We added 1% each to XLV now 3%, XLU now 2% and XLP now 3.5%
April 28, 2020
TRADE UPDATE: EQUITY MODEL and SECTOR MODELS
To help hedge our increased exposure to equities we added 2.5% of TLT to both models. This increases our total holdings of TLT to 7.5%.
Trade details will be released when the allocations settle at the custodian.
April 27, 2020
TRADE UPDATE: EQUITY MODEL and SECTOR MODELS
In this past weekend’s newsletter we discussed the market being range bound and that a breakout would likely lead the market higher. To wit:
“If the markets can rally more on Monday and break above the downtrend, the 61.8% retracement level becomes a viable target. Above that resides the 200-day moving average. Both levels are going to provide formidable resistance to a move higher.”
With the breakout on Monday, we added a “RENTAL TRADE” for that move using the S&P 500 ETF (SPY) as our proxy position. We put that on at the end of the day.
Position size is 5% of our portfolio.
Stop-loss is the 50-dma at $278
Target for trade is $293.60 to $297.60
This is a trade only, and we fully expect to get stopped out. (Risk/Reward is not optimal.)
April 24, 2020
TRADE UPDATE: EQUITY MODEL and SECTOR MODELS
As has been commonplace for us over the last couple of months, as we continue to add some equity exposure in areas that we like, or think are undervalued, we are hedging that risk accordingly.
Previously, we discussed reducing our bond portfolio to align with our reduced equity exposure, however, over the last couple of weeks, we have been adding positions in CLX, MRK, CAG, XLE, XOM, and CVX, along with increasing exposures in our Staples (XLP), Healthcare (XLV) and Communications (XLV).
Today, we are increasing our bond exposure a “smidge” to compensate for the risk of increased equity exposure by adding a 5% weight of TLT (iShares 20-Year Treasury Bond) to our portfolio.
This will increase our bond “duration” a bit so that if the market declines, the pickup in yield will hedge our equity risk to some degree.
April 23, 2020
TRADE UPDATE: EQUITY MODEL and SECTOR MODELS
Over the last few days, as the oil price rout has ensued, energy stocks have been providing a very encouraging relative outperformance in the sector. We have discussed for quite some time that we have been looking for a reasonable risk/reward setup to begin building positions into our portfolios.
Today we are starting that building process. We have added 1% into our models as follows:
Equity Model:
Exxon Mobil – XOM
Chevron – CVX
ETF Model
SPDR Select Sector Energy ETF (XLE)
On our ALERTS page (In the PORTFOLIO TAB) we are adding our stops AND our breakout buy levels to add to our holdings.
XOM – Add @ $46.50 / Stop set @ $38
CVX – Add @ $91 / Stop set @ $78
XLE – Add @ 37 / Stop set @ $30
***We just rolled out the ability to set email price alerts on your RIA Pro portfolio holdings. In the Portfolio tab go to Alerts. From this screen you can set alerts based on the stock price or daily percentage change. When your alerts are triggered you will receive an email.
April 14, 2020
TRADE UPDATE:
EQUITY MODEL and SECTOR MODEL
In both models we bought 3% of UUP, and added 3% IEF, .50% of CAG, and .50% of CLX
We sold all of STIP 5% in both models
In the equity model we added: .75% PG
In the sector model we added 1% XLP
We sold STIP and took profits as inflation expectations have risen from near zero to 1.25%. Our concern is that another bout of stock weakness and economic concerns would revive deflationary concerns. We may likely buy STIP or TIP in the future as our inflationary concerns rise.
We added dollar exposure (UUP) to both portfolios as we recognize that a shortage of dollars globally should promote a stronger dollar.
Despite the strong rally we remain concerned this is a bear market rally and are buying conservative stocks/sectors that we think have value and whose earnings should hold up well in a recession.
We will have more details on trades shortly when they become available from our custodian.
April 7, 2020
TRADE UPDATE:
EQUITY MODEL and SECTOR MODEL
In both models we were stopped out of SH and sold all of the shares.
In the equity model we bought: 1% of the following: IAU, GDX, DUK, RTX
In the sector model we bought 1% of the following IAU, GDX, XLU
Despite the strong rally we remain concerned this is a bear market rally. We will have more details on trades shortly when they become available from our custodian.
April 6, 2020
TRADE UPDATE:
EQUITY MODEL and SECTOR MODEL
In the equity model we sold UTX (United Technologies) and Bought RTX (Ratheon Technologies) to account for the merger over the weekend. This is simply a bookmark entry to account for the merger. We did not add/reduce any exposure.
We are being stopped out of our short-hedge potentially in the morning. If the market opens down in the morning, we will maintain the hedge. Otherwise we will close it our tomorrow. Today’s action smacks of a short-covering “bear rally” so we are looking for confirmation of a breakout above last weeks consolidation highs.
April 2, 2020
TRADE UPDATE:
EQUITY MODEL and SECTOR MODEL
We added a second round of 2.5% of SH (S&P 500 Short) into both portfolios.
Stop is 2600 on the S&P 500 Index.
April 1, 2020
TRADE UPDATE:
EQUITY MODEL and SECTOR MODEL
The market failed at previous resistance confirmed by today’s sell-off. We are going to start building a hedge into our portfolios which will eventually get to 10% of the portfolio.
We started today by adding 2.5% of SH (S&P 500 Short) into both portfolios.
If the market opens up tomorrow, we will add another 2.5%, etc.
Stop is 2600 on the S&P 500 Index.
March 31, 2020
TRADE UPDATE:
EQUITY MODEL and SECTOR MODEL
Equity Model- Selling Visa (V) and buying 1% of ConAgra (CAG)
Sector Model – Adding 1% of CAG
We are concerned that delinquencies and defaults will surge at Visa and instead prefer to keep leaning towards the safety and consistency of needed staples.
March 30, 2020
TRADE UPDATE: EQUITY MODEL
We are rebalancing holdings in the equity model this morning to continue shifting our risk profile to a move conservative stance for the next month as we continue to progress through the onslaught of poor economic data coming our way.
Selling 100% of KHC and HCA.
We still like these positions longer-term but had to sacrifice them to add to our stronger positions for now. We will buy them back at a later date most likely.
Added to: JNJ, ABT, and ABBV
We doubled our holdings in these companies which are on the forefront of a vaccine, testing and distribution of products for the COVID-19 pandemic. Plus we like the healthcare space going forward on an earnings basis.
March 27, 2020
TRADE UPDATE: BOTH MODELS
Selling 100% of QQQ
We placed a trade on QQQ for a “bear market rally,” which has potentially reached its logical conclusion. Plus since bad things typically happen over the weekend, we are going to take the “win” for now and lock in some gains.
On Monday, we will see where the market opens and then evaluate our next set of trades.
Importantly – coming in our weekend newsletter:
The long term bull pattern that existed since the 3/9/09 is over. That means the pattern of investors confidently buying every decline is over.
The market became historically oversold on 3/23 using many metrics and that oversold condition coincided with the long term support area of S&P500 2110-2180.
Short covering and rebalancing has a lot to do with the size and speed of the 3 day rally. Also, we know that the lack of ETF liquidity played a role.
Technically the market (S&P500) can still go up 6.9% higher from here to hit the 50% retracement level (3386 – 2237 = 1149/2 = 574 + 2237 = 2811….2811/2630 = +6.9%. I would not bet on it.
The S&P500 will unlikely hit a new high this year, and potentially in 2021 as well.
March 26, 2020
**We fixed our 60/40 Index Benchmark in the RIA Pro Portfolio graphs. The prior benchmark was not static. As the stock and bond markets went up and down, the allocations to equities and bonds were changing and straying from a 60/40 stock/bond allocation. This became obvious during the sharp sell off of the last few weeks. The current benchmark will constantly rebalance to a 60/40 allocation.
TRADE UPDATE: BOTH MODELS
We are buying 1% of CLX (Clorox) into both the equity and sector model. While CLX is not a sector, it is a special situation which has no ETF equivalent. Going forward we will be flexible in the sector model with individual names if needed to meet our strategic goals.
As noted previously over the next several months, as we go through this market, we will be blending the ETF and Equity Models together.
TRADE UPDATE: EQUITY MODEL
We are buying 1% MRK (Merck) in the equity model today. We are positioning the portfolio to maintain a consistent equity weighting as we will be selling highly leveraged positions during this rally.
March 24, 2020
Trade Update: ETF MODELS
As noted below, we were waiting for the market to pull back a bit before completing the swap from XLRE and XLU to XLK and XLC. The purpose primarily is to reduce the leverage in sectors most susceptible to default risk. There are several REITs which are going to liquidate over the next couple of months which will impact the whole sector.
Increasing weights in portfolios:
XLK to 4% of the portfolio
XLC to 4% of the portfolio.
Trade Update: ETF MODELS
This morning we sold XLRE and XLU. We plan on replacing those positions with additions to XLC and XLK.
We are having problems with the custodian so we will update the portfolios as soon as trades settle.
March 24, 2020
Trade Update: ETF MODELS
This morning we sold XLRE and XLU. We plan on replacing those positions with additions to XLC and XLK.
We are having problems with the custodian so we will update the portfolios as soon as trades settle.
March 23, 2020
Trade Update: ETF & EQUITY MODELS
This morning the Federal Reserve went “ALL IN” with unlimited QE. As we addressed in this weekend’s newsletter, the markets are extremely oversold and a “bear market” rally is highly likely.
We want to focus our attention of sectors which are lesser affected by the “viral impact” to the economy, and the reality the Fed has just unleashed “Pandora’s Box” with their massive interventions.
As such we are taking on a very small exposure in portfolios adding:
2.5% of QQQ
1% of IAU (inflation hedge) (Read market buy/sell report today for parameters on Gold)
Stops are set very tight, but we will add to the holdings if a rally begins to mature over the next few days. Such a rally could get an additional boost from Congress if they can get their stimulus bill passed.
Will update the portfolios as soon as trades settle.
March 19, 2020
Trade Update: ETF & EQUITY MODELS
We have settled the sells of DBLTX and PTIAX in the models this morning.
We bought STIP this morning. More details on why we executed this trade are below.
We also closed out our short-hedge (SH) for now as the markets are grossly oversold.
Also, we are considering putting on a small position in SPY if this consolidation over the last couple of days holds through Friday. What we HAVE NOT had, as of yet, is TWO POSITIVE RETURN days in a row. However, the recent market action has been more constructive in holding recent lows. We may look to add a trading position and build into it if we get follow through.
As the chart below shows, the TIP market now implies that inflation will average +0.16% for the next five years. If inflation is higher on average than 0.16%, STIP should outperform similar maturity Treasury bonds and vice versa if lower. We are in the midst of a short term deflationary bust, but given the massive fiscal and monetary stimulus we think a good majority of the next 5 years will see normal to much higher than normal inflation.
March 18, 2020
Trade Update:
“Too Damn Cheap…”
With the markets in full “margin call” liquidation mode, everything is being sold from bonds, to stocks, to gold, to equities. This is like an Oriental Rug Company – “Everything Must Go.”
With that said there is real value coming into the markets and over the next 30-45 days we are going to start picking through the rubble nibbling on things that are just “too damn cheap.”
We started that process today with a 1/2% position in GDX in the Equity and ETF Portfolios.
Buy 0.50% GDX
NOTE:The ETF PORTFOLIO is going to migrated into the EQUITY MODEL over the next few months. With valuations finally getting cheap, bonds no longer a hedge for portfolios, and dividends escalating sharply, we will want to more selective buying individual companies, increasing holding sizes, and maximizing returns going forward. This makes ETF’s a less “optimal” strategy for portfolios going forward.
Trade Update:
We sold our holdings in DBLTX and PTIAX in the sector and equity funds. With our equity exposure so low at this point, we do not need as big a bond position to hedge our equity positions. Also, with rates so low they provide little coupon interest but significant risk if interest rates rise.
Trades will be posted tomorrow as the securities are mutual funds and will not occur until later tonight.
March 16, 2020
IMPORTANT UPDATE
We have been holding on to some equity exposures in anticipation of a “Fed Bazooka.” Given the markets pre-disposition to rally on liquidity pushes, we didn’t want to get caught on the wrong side of the “trade.”
However, one concern we have had for some time is what if QE doesn’t work? We MAY have that answer.
More importantly, QE doesn’t solve the problem of a global pandemic recession and market shutdown.
As such we have NO IDEA where the bottom is, and we simply do not want to take any additional risk until there is some certainty and clarity in terms of risk and reward. MAYBE IT IS TODAY? We just don’t know.
Most importantly, this morning we broke the long-term bullish trend from the 2009 lows and as such:
We are closing out our core and
Selling 1/2 of our tactical equities.
We are maintaining our bond and short exposures.
We have closed our the Dynamic model entirely at this point and will rebuild that portfolio when the “dust” settles.
Overall, we have been taking profits and reducing risk for quite some time and have a performance gap over the S&P 500. We can allow the S&P to play catch up with us and rebuild our portfolios when there is a clearer view of risk and reward.
Right now, we have no clarity.
I will post the trades up later today once they all settle and we know what our fills are.
Thank you.
March 11, 2020
ALL MODELS
As noted yesterday:
“We are going to change our “CORE” allocations positions and weightings to give us better flexibility with the two portfolios in the future. We are going to increase IVV to 10% of the portfolio and sell both RSP and VYM. This will give us more room to add selective equity and sector exposure while giving us an exact hedge with a SHORT S&P 500 Index.”
This morning we added IVV to portfolios to bring that “CORE” weighting up to a full position.
We have stated for some time that the Fed was likely to extend their Repo facilities and increase the funding. They did that today and the market did not respond.
There is simply too much “bad news” swirling in the headlines and our last support was taken out today. We used the brief rally at the end of the day to liquidate RSP and VYM and reduce our overall core position.
The markets are DEEPLY oversold, as stated in today’s commentary, so, while it may not seem likely at the moment, there is a potential for a fairly sharp one to two day rally. We will short against the core position at that point taking it to market neutral.
We did short against the core holdings in the Dynamic model to limit downside risk as we are at our stop limits for the whole portfolio currently.
March 10, 2020
EQUITY & ETF Models
We are going to change our “CORE” allocations positions and weightings to give us better flexibility with the two portfolios in the future. We are going to increase IVV to 10% of the portfolio and sell both RSP and VYM. This will give us more room to add selective equity and sector exposure while giving us an exact hedge with a SHORT S&P 500 Index.
This will be done opportunistically with the sells occurring on any sustained counter-trend bounce to the 200-dma.
DYNAMIC MODEL
I placed orders for ADBE and CRM below the market opens today and got filled on the selloff earlier today.
Bought 1/2 positions in ADBE and CRM.
March 9, 2020
EQUITY & ETF Models
The impact of the decision by Saudi Arabia to boost production and lower prices to preferred partners, along with Russia not participating in cuts, has created unexpected risk for markets that we can not quantify at the moment.
While markets are oversold on a short-term basis, we used the small bounce from this mornings to sell our “rental trade” for the time being. Once the market bottoms, we will look to reintroduce the trade.
We expect the markets to bounce over the next few days, and we will use that opportunity to most likely raise more cash and short against remaining long positions.
Selling 100% VOOG
DYNAMIC MODEL
Selling 100% of IVE
March 6, 2020
We are giving up on our “beaten up, out of favor, fundamentally strong” energy thesis for the time being. We still like the sector and will come back to it later when a better bottom has formed.
We need to raise cash for the portfolios to be more defensive here, and with Russia failing to join the OPEC+ cut, we have more downside risk in the sector.
We also sold XLY as discretionary is subject to an earnings shortfall with the impact of the virus and the global supply chain impact.
ALL MODELS:
Selling 100% of XOM, AMLP, RDS/A and XLY
March 3, 2020
** UPDATE ** 3-4-2020
TD Ameritrade finally allocated our trades this morning for the equity model. Please review the PORTFOLIO POSITION REPORT today for analysis on why we brought selected positions up to target weights in portfolios.
We have updated the portfolio holdings with the below listed trades.
However, we had a problem with TD Ameritrade today, and some of our trades have not settled into accounts yet, so I am missing cost basis on the equity positions.
I should be able to update them in the morning.
Portfolio Trading Update:
We are doing a lot of rebalancing in portfolios today, so there will be updates through out the day as we rebalance models.
As discussed in the SECTOR BUY/SELL UPDATE we are:
Selling Areas Most Exposed To Corona Virus:
XLF, XLB , and XLI in the ETF Model
JPM, NSC, and MU in the Equity Model
Rebalancing to Target Weights
XLK, XLRE, XLU, and XLV in the ETF Model
AAPL, ABT, AEP, CHCT, CVS, MSFT, PG, and V in the Equity Model
We will update portfolios as all the trades settle from our client accounts so that we have the average cost basis and execution levels.
February 28, 2020
Portfolio Trading Update:
In the EQUITY and ETF PORTFOLIOS, because immediately below, the very oversold condition suggests a short-term bounce is likely so we are reducing some of our hedges and taking in profits.
While TLT proved to provide great protection, but it is very extended and while we like bonds as a hedge, if the impact to the global supply chain is as we suspect, it could be inflationary and way on longer-duration bonds.
We sold GDX as well, because Gold Miners are people intensive and are in countries, primarily, which are more subject to the effects of the Coronavirus. We are keeping our GOLD position which will benefit from reduced supply as well as the potential inflationary impact with respect to the global supply chain. Gold is an insurance policy against reckless central bank policies.
Selling:
TLT
GDX
***Important Market Message
The market is currently extremely stretched to the downside, as shown below, with very negative sentiment. Thursday afternoon saw a flush of sellers, and it looks like we will see a continuation of that this morning. We suspect a rally could begin later into the afternoon to try and defend the 200-dma.
If correct, we will probably get a reflexive rally back to 310 to 315 on SPY, and then we will most likely sell off our trading positions and reduce our equity exposure further.
Importantly, despite the selling, the bull trend is still intact, so while we have triggered some short-term sell signals, it isn’t time to become completely bearish just yet. However, I suspect that time will come in the next few months.
Click to enlarge.
February 28, 2020
***Important Market Message
The market is currently extremely stretched to the downside, as shown below, with very negative sentiment. Thursday afternoon saw a flush of sellers, and it looks like we will see a continuation of that this morning. We suspect a rally could begin later into the afternoon to try and defend the 200-dma.
If correct, we will probably get a reflexive rally back to 310 to 315 on SPY, and then we will most likely sell off our trading positions and reduce our equity exposure further.
Importantly, despite the selling, the bull trend is still intact, so while we have triggered some short-term sell signals, it isn’t time to become completely bearish just yet. However, I suspect that time will come in the next few months.
Click to enlarge.
February 27, 2020
ETF, EQUITY & DYNAMIC PORTFOLIO
As noted into today’s POSITION COMMENTARY report, with energy stocks trading at extreme deviations BELOW their 200-dma, we said we were going to start nibbling into positions in the energy space.
As such we added 0.50% to our current AMLP position which resides in all 3-portfolio. AMLP is 3-standard deviations below its long-term mean with an 11.5% dividend yield currently.
In the EQUITY and DYNAMIC models we added a small 1% position of Royal Dutch Shell (RDS-A) which currently is more than 3-standard deviations oversold and carrying an 8.4% dividend yield.
February 25, 2020
ETF, EQUITY & DYNAMIC PORTFOLIO
This morning in the DYNAMIC PORTFOLIO we closed out of the rest of the SHORT S&P 500 INDEX position and added a 5% trading position in VOOG.
In the ETF and EQUITY PORTFOLIOS we added a 5% trading position in VOOG.
These are “RENTALS” on the S&P 500 for a tradeable bounce. We will likely sell these on this rally over the next couple of days as markets approach resistance and then add back the SH position to hedge our other longs.
This is a tricky market right now, so don’t try and get “cute” with it and take on unnecessary risk.
February 25, 2020
ETF, EQUITY & DYNAMIC PORTFOLIO
With the decline this morning we were stopped out of several positions in both the Equity and Dynamic Portfolios:
DOV
VMC
LVS
Also, with yields dropping rapidly and yield curves inverting, our yield-curve steepening trades have been closed our for now with nice gains.
AGNC
NLY
REM
We are raising cash to limit further downside risk at the current time, but also to position the portfolio for potentially weaker economic growth going forward. The cash raised will be redeployed back into our stronger positions that we have previously taken profits in. We are also looking to reduce our exposure to impacts to global supply chains so we are shifting away from Materials and Industrials to some degree.
There are a lot of moving pieces right now, so nothing is firm yet.
February 24, 2020
DYNAMIC PORTFOLIO (Updated)
Sold 1/2 of the short-hedge position in the account due to the more extreme oversold condition that currently exists. We will likely see a bounce over the next day or two which will let us add the hedge back for the continuation of the correction for now. We were also stopped out of our Pfizer (PFE) position.
EQUITY & ETF PORTFOLIO
As we have addressed over the last couple of weeks, we were close to getting stopped out of small cap, international and emerging market positions. DEM, EFV and SLYV, along with PFE in the Equity model, were stopped out today. These positions were laggards to the portfolio and were underperforming.
Both XOM and AMLP are trading at extreme discounts to fair value as well as deep deviations from the their long-term moving averages. We are going to hold these positions for now and will reconsider our positioning on a rally in the next few days.
February 21, 2020
DYNAMIC PORTFOLIO
We are continuing to work on using opportunistic pullbacks in the market to build out the Dynamic Model Porttfolio.
This morning we put in a limit order to buy the Vanguard S&P 500 Growth Fund (VOOG) at 186.00. The trade was executed late afternoon.
The Dynamic Portfolio carries a long-term “CORE” position of broad market indices which use as a base to build the rest of our exposure off of. It is also the primary position which we hedge against, including our current Short S&P 500 Index fund (SH).
As we get the portfolio built out we will begin to rebalance and adjust weightings in all of our positions.
February 19, 2020
All Fund Data up to date.
February 18, 2020
NOTE: These are mutual fund trades which take some time to settle after the market closes. I will update the portfolio positions as soon as I have the transaction data.
PORTFOLIO TRADING UPDATE: EQUITY & ETF MODELS (FIXED INCOME TRADE)
This morning we swapped half of DBLTX for PTIAX for the Equity and ETF models.
In a 60/40 portfolio, we reduce DBLTX by one-half weight and added and equal amount of PTIAX. We did the trade as an exchange, meaning we bought the same amount we sold. Therefore, total fixed income exposure did not change.
PTIAX has a $2500 minimum, but there are no transaction fees.
Why we did the trade:
PTIAX is conservative, like DBLTX, but provides us with better diversification in our fixed income holdings and a history of outperformance versus both DBLTX and the Barclays Aggregate benchmark. Whereas DBLTX is largely in Agency mortgages, PTIAX has some residential and CMBS holdings but is largely into tax exempt munis. Like DBLTX, PTIAX sees little to no value in corporates at the moment. From an underlying ratings perspective they are both similar. Note the lower rated securities are bonds that have not been re-rated since the financial crisis.
Essentially the swap allows us to diversify into a fund with better performance and strong track record of outperformance in bad fixed income environments.
February 14, 2020
PORTFOLIO TRADING UPDATE: DYNAMIC MODELS
This morning, I took the SHORT S&P 500 (SH) to 10% of the DYNAMIC MODEL.
We are still trying to build this model out and I am hedging a chunk of the portfolio for a short-term corrective action in the market so I can add to existing positions, and add new ones, more opportunistically.
This is simply a hedge to protect newly invested capital and not a “bearish” call on the market.
February 12, 2020
PORTFOLIO TRADING UPDATE: EQUITY / DYNAMIC MODELS
This morning we added a position in both models of Las Vegas Sands (LVS).
In the EQUITY model we SOLD our position in SLYV. It has been underperforming and we needed to make room to add LVS. We are looking at two additional additions to the portfolio currently which will require some further adjustments.
LVS is just triggering a MONTHLY BUY signal which is bullish, and more of the technical aspect are turning bullish as well. as noted in our analysis:
Click To Enlarge
With a 4.5% yield, it adds to our income flow of our portfolio, as well as with the technicals improving the potential for a decent total return.
February 11, 2020
PORTFOLIO TRADING UPDATE: EQUITY / ETF MODELS
With the markets pushing more extreme extensions once again, as discussed in today’s #TechnicallySpeaking,we are beginning to add on some additional hedges. The first step is we are starting to extend our duration in our bond portfolio a bit as a correction will push money into
BUY – TLT @ 144.22
Looking to add further hedges later this week if needed.
February 5, 2020
PORTFOLIO TRADING UPDATE: EQUITY / DYNAMIC MODELS
As noted in ourPOSITION UPDATE REVIEWthis morning, we made a few minor changes to our Equity and Dynamic Portfolios this afternoon. We noted that we previously took profits in some of our most grossly extended positions like AAPL, UNH, UTX and others. As noted at that time, we were expecting a 3-5% correction to work off some of the excess which did occur.
While the markets are still extended there were a few positions that had more substantial pullbacks and offered better entry points. The following purchases were made:
EQUTIY MODEL:
ADDED TO UNH bringing position back to target weight @ 288.125
BUY PFE @ 37.9995
ADDED TO ABBV bringing position to full portfolio weight @ 85.3258
BUY JPM @ 136.6599
ADDED TO AMLP bringing position to full portfolio weight @ 8.22
DYNAMIC MODEL
BUY PFE @ 38.205
BUY UNH @ 289.5271
BUY ABBV @ 85.6144
BUY AMLP @ 8.2101
BUY JPM @ 136.712
February 4, 2020
PORTFOLIO TRADING UPDATE: ETF / DYNAMIC MODELS
As noted in ourSECTOR BUY/SELL REVIEW, we discussed that we took profits yesterday in the ETF Model to reduce our holdings slightly in Utilities & Real Estate.
This morning we added exposure as discussed to XLF and XLV as we work on rebalancing portfolios for risk.
We also continue to build out the new DYNAMIC model which we reduced our market neutral hedge by 1/2 today, and added XLV, XLF and IVV to the portfolio.
ETF MODEL:
Increased XLV back to target weight @ 101.42
Added XLF to 1/2 portfolio weight @ 30.65
DYNAMIC MODEL
Sold 1/2 SH @ 23.52
Added XLF @ 30.65
Added XLV @ 105.02
Added IVV @ 330.325
February 3, 2020
PORTFOLIO TRADING UPDATE: ETF MODELS
As noted in our SECTOR BUY/SELL REVIEW, which will be posted in the morning, we took profits today in the ETF Model to reduce our holdings slightly in Utilities & Real Estate.
The reasoning for taking profits is that over the last couple of weeks interest rates have had a huge move lower which boosted the prices of Utilities and Real Estate which are interest rate sensitive. With both sectors, along with rates, very overbought, we are taking some profits here to be able to rebuild the positions following a correction. We will also look to increase our bond exposure as well.
Sold 1/3 of our position in:
XLU @ $69.133
XLRE @ $39.395
TRIAL USERS
Click the link below for the promotional analysis on the Energy sector.
As noted in our previous post, the market is SO very extended, overbought, and complacent that we needed to take some profits and temporarily reduce equity exposure in both the EQUITY and ETF Portfolios.
As such we have taken profits in the following positions:
As noted at the beginning of the year, we launched the DYNAMIC EQUITY PORTFOLIO with a purchase of 10% of the account value in a large capitalization VALUE fund (IVE).
The S&P is currently more than 2-standard deviations above the 200-dma (shaded blue area).
The “buy signal” (lower panel) is back to levels of extensions normally only seen with short-term tops and corrective actions, particularly when combined with extreme extensions and deviations from long-term means.
Because of this extreme extension we have been unable to complete building out our “core” holdings, until the market reverts some of the overbought condition.
Therefore, given that complacency is high, put/call ratios are at extremes, and the markets are extended and deviated from long-term means, we have taken the portfolio to a “MARKET NEUTRAL” position for now by adding an equal SHORT-S&P 500 position to the model.
BUY: 10% SH – Proshares Short-S&P 500 Index
This will allow us to protect our capital and will provide the opportunity to build out the core S&P 500 position on a market correction. At that point we will remove the short and build out the rest of the portfolio.
As noted previously, the Dynamic Model is an 80/20 portfolio allocation, which is more aggressive than normal, and is a go anywhere, do anything, model. As such we are looking for potentially longer-term investments in “out of favor” areas of the market while still investing in current market trends.
01/03/2020
We are starting the launch of the DYNAMIC EQUITY PORTFOLIO today with a purchase of 10% of the account value in a large capitalization VALUE fund (IVE).
The Dynamic Model is an 80/20 portfolio allocation, which is more aggressive than normal, and is a go anywhere, do anything, model. As such we are looking for potentially longer-term investments in “out of favor” areas of the market while still investing in current market trends.
Our initial purchase is the start of building a “core allocation” which we will eventually “hedge” against. Given the market is extremely overbought currently, we will look to use further pullbacks and corrections to build out the core opportunistically.
12/31/2019
TRIAL SUBSCRIBERS
If you are trial user looking for our special report on the Energy Sector click the link below.
Scroll down to read more about our portfolio recommendations, changes, and trades.
12/31/2019 – PORTFOLIO UPDATE
As mentioned previously we are doing some tax loss harvesting in the Equity Portfolio this morning. (Please read the Portfolio Update Report)
EQUITY Portfolio
Selling:
100% of Boeing (BA) at the open
100% of Wells REIT (WELL) at the open
After these sells are completed we will then look at rebalancing risk in the broader portfolio.
In early January we will look to hedge the our portfolio against a short-term correction.
We will update the transactions once they are filled.
TRIAL SUBSCRIBERS
If you are trial user looking for our special report on the Energy Sector click the link below.
Scroll down to read more about our portfolio recommendations, changes, and trades.
12/16/2019 – PORTFOLIO UPDATE
As noted in our previous portfolio update:
“With the markets back on a monthly “buy” signal, we will likely be added a bit more weight in the days ahead, so we will keep you apprised.”
Given the resolution of the “trade war”, “Brexit,” but primarily because the Federal Reserve is injecting nearly $500 billion in liquidity over the next 6-weeks, we are adding some additional exposures to portfolios. We have discussed in our previous market update, the breakouts occurring in Small-Cap, Emerging and International Markets.
These are trading positions only with VERY TIGHT stop parameters. If the positions continue to perform as expected we will increase holdings accordingly.
EQUITY Portfolio
Selling:
100% of Duke Energy – DUK
Buying:
1% of Small-Cap Value – SLYV
1% of International Value – EFV
1% of Emerging Market Value Dividend – DEM
ETF Portfolio
Buying:
1.5% of Small-Cap Value – SLYV
(Which we are blending with the recent purchase of KGGIX to balance performance short-term)
1.5% of International Value – EFV
1.5% of Emerging Market Value Dividend – DEM
TRIAL SUBSCRIBERS
If you are trial user looking for our special report on the Energy Sector click the link below.
Scroll down to read more about our portfolio recommendations, changes, and trades.
12/12/2019 – PORTFOLIO UPDATE
EQUITY Portfolio
As discussed in previous updates, we took profits in Gold Miners and Gold near the peak of the advance this summer. However, we like the positions as a hedge for our portfolios longer-term against a pickup in volatility and risk. We have added back 1% in each of the positions bringing them back to slightly overweight in the portfolio.
ETF Portfolio
Also, as noted in the sector update on Tuesday, Healthcare (XLV) was just grossly extended with the position up sharply in recent weeks. Given that we had overweighted the sector earlier in the year expecting a pickup in performance, we have now reduced the position back to a normal full weight. (We reduced the total holding from 4% of the portfolio to 3%)
We also add a “starter” position of a small-cap deep value mutual fund (KGGIX) which essentially replicates our previous thesis on the coming rotation to value from growth. (The link below is for Part V – all other previous links are contained therein)
With the markets back on a monthly “buy” signal, we will likely be added a bit more weight in the days ahead, so we will keep you apprised.
PORTFOLIO UPDATE
BOUGHT – 1/2 Position Of AMLP (Alerian MLP)
Over the last couple of weeks we have been discussing picking up some exposure to the energy sector and have been digging around for opportunities. We have identified several E&P companies as well as looking at some MLP’s for both potential price appreciate and yield.
However, the issue with MLP’s are the K-1 issues particularly for IRA accounts. Therefore, we are taking an initial 1/2 position in AMLP which has 1099-tax treatments. We are giving the position a little wider than normal stop-loss of $7.00/share because with the end-of-year tax loss selling season in progress, we could see some downward pressure on the holding short-term. We will add our second 1/2 position on weakness.
If you have not read our thesis on AMLP, please do.
PORTFOLIO UPDATE
Selling 100% of SDS (2x Short S&P 500 index) hedge.
We had expected a 2-5% correction in the market to resolve the overbought and extended condition of the market. That correction occurred on Monday and Tuesday (almost precisely 2%) before “trade deal” headlines begin flooding the airwaves.
For the week, the market will end virtually flat, but that consolidative action was enough to reduce portfolio risk enough to warrant removing the hedges for now. With the end of the year portfolio window dressing coming, it is likely the market will try to move higher over the Christmas holidays.
After taking short-term trading profits out of positions earlier this year we are “tax loss harvesting” the portfolio hedge through the end of the year. We will add the hedge back on as soon as the next signal warrants adding additional protection. For now, we want to let the markets “bullish bias” work in our favor through the holidays.
After all….Santa Claus is coming to town.
TRIAL USERS:
As referenced in our weekly newsletter, here is the referenced report on QE-4:
Click The Image To Read
PORTFOLIO UPDATE
As we are writing for tomorrow’s “Technical Update” – the risk of a short-term correction has hit pretty extreme levels with “Short VIX” positioning now at record levels. With the markets back to extreme OVERBOUGHT on virtually every measure, we have added a SHORT S&P 500 ETF to our portfolios.
This will be removed over the next few weeks as we get the anticipated correction. However, we are also keeping a fairly tight stop on the position just in case the market decides to rocket off higher into year end.
We have recently talked about the rotation from “defense” back to “offense” as QE gained traction in the market. That is occurring so we have reduce WELL from 1.5% of the portfolio to 0.75%.
Also, a reminder (as we are getting emails), we have closed out the Long-Short Portfolio in order to launch a Dynamic Equity Income Model on January 1st. Here was our previous note:
LONG-SHORT PORTFOLIO
We have been wrestling with TD Ameritrade for several months now to get a waiver to allow us to short individual equity positions in an IRA account. We have not been successful.
We are going to terminate this portfolio and relaunch it in January to follow our DYNAMIC GROWTH Portfolio we are launching for our clients. The portfolio, which was conceived from your subscriber requests, is an all-weather portfolio allocation that can buy any asset class, short markets, and take advantage of any opportunity. There is no set allocation mix so weightings can float between equities, commodities, fixed income, and cash as needed to create growth or hedge risk.
We are putting the finishing touches on the model now and will look to launch the portfolio live on January 1st.
October 30, 2019
Portfolio Action Update
Equity Portfolio
As we have been discussing in our portfolio commentaries over the last couple of weeks, we are making some changes to our portfolio.
(Click to Enlarge Charts)
SELLING 100% of YUM Brands (YUM)
As shown in the chart below, Sales have been declining with earnings being supported by a massive share buybacks.
SELLING 100% of Mondelez (MDLZ)
Sales at MDLZ have also been falling with earnings supported by share buybacks. We are taking our profits out the position and looking to reallocate.
REDUCING Apple (AAPL) to take profits heading into earnings. (Risk from China)
After taking 20% in profits in AAPL earlier this year, we are reducing once again due to stagnant revenue growth and EPS supported by share buybacks.
BUY Full Position of Kraft Heinz (KHC)
KHC is a “SPECULATIVE” trade based on earnings tomorrow. There is a HIGH PROBABILITY we will be stopped out. Therefore, DO NOT enter this trade if you are not keen on a potential short-term loss. As noted in our Portfolio Postion review:
Last week we talked about our speculative turnaround story in KHC. We still think that is the case and we will add a “trading position” to the portfolio.
With a 6% yield, and the stock turning higher, we are liking the position more.
This is a speculative trade set up with a tight stop at recent lows.
October 22, 2019
Portfolio Action Update
Equity Portfolio
Read yesterday’s note for explanation on actions we are taking currently and yesterday’s trades.
Today, we are adding:
1/2 position of ABBV
A full position of AMZN
We are also looking to rebalance and add exposure to the ETF model as well.
LONG-SHORT PORTFOLIO
We have been wrestling with TD Ameritrade for several months now to get a waiver to allow us to short individual equity positions in an IRA account. We have not been successful.
We are going to terminate this portfolio and relaunch it in January to follow our DYNAMIC GROWTH Portfolio we are launching for our clients. The portfolio, which was conceived from your subscriber requests, is an all-weather portfolio allocation that can buy any asset class, short markets, and take advantage of any opportunity. There is no set allocation mix so weightings can float between equities, commodities, fixed income, and cash as needed to create growth or hedge risk.
We are putting the finishing touches on the model now and will look to launch the portfolio live on January 1st.
October 21, 2019
Portfolio Action Update
Equity Portfolio
As noted in the last update we took profits from positions that were grossly extended and showing signs of correction. The second was to add to, or add new, positions in the portfolio to keep current allocations levels.
Today, we took some initial actions in the Equity Portfolio and added:
1/2 position of XOM which brings our position up to a full weight.
A full position of MU
We have 3-other positions slated to add over the coming days and will do so opportunistically.
We are also looking to rebalance and add exposure to the ETF model as well.
October 15,2019
Portfolio Action Update
Equity and ETF Portfolios
Over the last several weeks we have been discussing the need to take profits out of positions (for a third time this year) as prices had just gotten way to extended. Furthermore, we appear to be in the early stages of a rotation from more “safe haven” investments back into “risk on” as the Federal Reserve begins to once again be expanding the balance sheet.
We are making the adjustments to the EQUITY portfolio in 2-steps.
The first step is taking profits from positions that are grossly extended and showing signs of correction. The second step will be adding to, or adding new, positions in the portfolio to keep current allocations levels.
Today we have taken profits in the following positions:
AEP
CHCT
DUK
GDX
IAU
PG
VMC
YUM
In the ETF portfolio we are reducing IAU by 50%.
We will look to increase exposure to either the core or sectors weightings over the next couple of days if necessary.
October 11, 2019
Equity Long/Short Portfolio Trade Update
Buy 100 shares of TBX and Buy 100 shares of SHY
As discussed in our just released RIA Pro article –Non-QE QE and How To Trade it, we believe the yield curve will steepen. Today the Fed announced that they will buy $60 billion per month of Treasury Bills for at least six months.
The trade above in the RIA Pro portfolio is slightly different than that which we recommended in the article. Because of difficulty in shorting IEF, we instead purchased TBX, the inverse ETF of IEF. Due to this change we had to adjust the ratio of SHY and TBX. Please read the article for more of a discussion on the trade and the details.
October 9, 2019
Equity Portfolio Trade Update
Sell 1/2 ABT
As noted in today’s POSITION UPDATE REPORT our holding in Abbott Laboratories broke support and triggered our adjusted stop loss.
After taking profits in the position previously, we have sold 1/2 of the remaining position.
Over the next couple of days, as we see how things develop with the “trade negotiations,” and the Fed, we are going to rebalance our portfolio holdings accordingly by trimming profits and adjusting the overall risk profile.
We are optimistic some form of a trade deal will be completed and the markets will likely rally into the end of the year. However, until we have some clarity, it makes sense to hedge risk currently.
Remember, it is always easier to add money to a rising market versus trying to figure out how to make up losses.
September 27, 2019
** RIA Pro Web Site Upgrades **
In the Portfolio Tab you will now find a gold plus sign to the left of the ticker. When you click on it you will access key information about the company.
Within this menu is a listing of past and future dividend and earnings dates and data for the company. To see this information for your entire portfolio you can click Dividend at the top of the page to the right of the large performance graph. This will display dividend and earnings information for your entire portfolio.
In the Research menu you will now find global dividend and earnings calendars. Clicking it will display a list of companies with dividends or earnings for the specific date.
These upgrades were based on comments from subscribers. Please keep the great ideas coming.
September 26, 2019
** Trade Update **
BUY – Boeing (BA)
EQUITY PORTFOLIO
Yesterday, I noted that we added the 2nd half of a position to BA to the LONG-SHORT PORTFOLIO as discussed in our Portfolio Position Update report.
We completed the process of adding to 2nd half of the BA position to our EQUITY PORTFOLIOS today.
Models have been updated.
September 25, 2019
** Trade Update **
EQUITY/ETF Portfolios
We had previously added a short-term trading position in VXX as a hedge against the Federal Reserve announcement on rates.
These positions, due to the optionality inside of the ETF, can NOT be held for long-periods of time as they “bleed” relative to the performance of the underlying index due to the “decay of premium” in the underlying options.
With the market oversold short-term, and sitting on support, we are closing out the position with a slight gain. We will look for the next opportunity to hedge which will be coming around mid-month with the “trade negotiations.”
EQUITY LONG-SHORT
We added the 2nd half of a position to BA today as discussed in our Portfolio Position Update report.
September 24, 2019
** Trade Update **
ETF Portfolios
We have been talking for a while about the really overbought conditions of “defensive” sectors of XLP, XLRE, and XLU.
We have been carrying an overweight position in XLP since earlier this year. Today we reduced that overweight to portfolio weight to take in some gains.
September 17, 2019
** Trade Update **
Equity and ETF Portfolios
We are starting to add a hedge to our portfolios heading into the Fed meeting tomorrow and the “trade negotiations” in mid-October.
We added our 1st-stage of VXX to both models and will continue to build into the position as volatility drops further. Markets are extremely overbought short-term and a correction is pending in the next few weeks.
This is a short-term hedge which will maintain both a tight stop as we build into it, and will be sold on a spike in volatility.
September 12, 2019
** Trade Update **
Equity Long-Short Portfolio
We closed out our 2x S&P 500 trading position after adding to the position twice in recent weeks. As noted previously, the trade was put on after the S&P 500 broke out of consolidation and above the 50-dma which gave us a trade target of the July highs. We reached that target this morning and with the market back to extreme overbought we have closed the trade and taken in profits. We are now looking for an opportunity to potentially short against our remaining long “core” S&P 500 positions.
The chart below shows the overbought short-term condition.
Equity Portfolio
In the core equity portfolio we have been discussing needing an opportunity to increase duration in our bond holding and add to our gold positions. The announcement by the ECB to go deeper into #negative #rate territory and restart QE was the point we needed.
Added to the 2x S&P 500 holding in the EQUITY LONG-SHORT Portfolio for a one or two trade trade opportunity. Market approaching overbought so rally is likely to fail at all-time highs.
September 6, 2019
NEW SITE FEATURES
RIA PRO portfolios are now compared to an equal benchmark of S&P 500 and Fixed Income which more appropriately represents the risk management features of the portfolio.
Click to Enlarge Image
We have also added a screen for DIVIDEND YIELD.
Click Images To Enlarge
You can screen for high dividend yielding stocks and then sort by yield We have included our ranking system to help sort out the good from the bad.
September 5, 2019
Trading Alert:
With breakout above the 50-dma and the trading channel we have been in over the past month we have added 1/2 of a trading position to the EQUITY LONG-SHORT Portfolio. We will add a second half-position in the next day or so if the breakout holds.
In the ETF Portfolio we added to our existing exposures of XLC and XLY bringing both of those positions up to target weights.
August 28, 2019
As discussed in this morningsSELECTED PORTFOLIO POSITION REVIEWthere are several positions currently under scrutiny for liquidation as market risks rise relative to economic, technical and fundamental outlooks. The ongoing trade war is wearing on profitability as well as the inversion of the yield curve suggesting something more serious damage is occurring in the economy.
As such our first actions in this regard was the liquidation of our financial positions as the inversion of the yield curve, along with the Fed cutting rates, negatively impacts bank profitability. Also, credit risk is rising which also makes banks more vulnerable.
Equity Model – Sell JPM
ETF Model – Sell XLF (FNCL for RIA Advisor Clients)
Portfolio models have been updated.
August 23, 2019
President Trump ordered companies in the United States to look for an alternative to doing business with China and warned that he would further retaliate.
China had threatened new tariffs on $75 billion worth of American goods in an escalation of the trade dispute between the world’s two largest economies.
After Powell’s closely watched speech in Jackson Hole, Trump tweeted, “As usual, the Fed did NOTHING!”
After China announced more import tariffs on U.S. goods early Friday, Trump said he would respond Friday afternoon. The president also asked “who is our bigger enemy,” Powell or Chinese President Xi Jinping.
With that type of rhetoric flying around, it is impossible to trade the market at this moment.
We closed out our remain portion of the 2x S&P 500 long and will wait for things to settle down a bit and see where next supports are.
August 22, 2019
NO LONG-SHORT LIST TODAY
With the Jackson Hole Conference starting today, there is too much risk to be short in the market currently.
As noted yesterday, we have sold into this rally and reduced our 2x SP500 position. We are maintaining our core S&P 500 positions as the bias is currently bullish. The support that has been building around the recent lows is positive and a break above the 50-dma could lead to a retest of previous highs.
With the volatility seen in just the past two weeks, it is too difficult to trade short positions without being “whipsawed” out of the holdings.
Trading Rule:
When you are “unsure” about the best course of action, the best course of action is to “do nothing.”
We will wait for a clearer picture.
August 21, 2019
** UPDATE **
EQUITY LONG SHORT PORTFOLIO:
We sold another 25% of the 2x S&P 500 position that we added for the bounce last Thursday. This leaves us with 1/2 of the original position. With the market still contained below resistance, and working off the oversold condition, there is probably not much more upside to the trad currently. However, IF we get a break above the 50-dma, then a rally back to highs is possible.
Comments from the FOMC minutes or the Jackson Hole summit which tilts towards more rate cuts or QE could push asset prices above resistance.
August 19, 2019
** UPDATE **
EQUITY PORTFOLIO:
We have been discussing for a while that we would be eliminating PPL from the portfolio, but we were waiting to find a suitable replacement. While we have a couple of candidates to add to the portfolio, we decided to go ahead and sell PPL and use the proceeds to add to AGNC and JNJ.
We are continuing to leg into our Agency positions which will benefit when the yield curve starts to steepen as the Fed cuts rates and implements QE. Today, the White House starting applying pressure to accomplish this goal. We are saving some powder momentarily add to NLY as the steepner becomes more evident.
We are adding to JNJ as we feel much of the legal issues surrounding “talc” are likely embedded into the stock price. We are increasing our holdings slightly given the recent pullback to support.
EQUITY LONG SHORT PORTFOLIO:
We sold 25% of the 2x S&P 500 position that we added for the bounce last Thursday. With the market not yet back to “overbought,” we will continue to monitor and sell more on the approach to the 50-dma.
August 15, 2019
** UPDATE**
EQUITY LONG SHORT PORTFOLIO:
I added a 2x S&P 500 position to the Long-Short portfolio for an “oversold trade” and a bounce into the end of the week. We will re-evaluate the holding tomorrow.
____________________________
We have released a SPECIAL REPORT covering the S&P 500 index on a daily, weekly & monthly basis to weigh the possibilities and probabilities of what happens next, the “yield curve,” and why the inversion was “no surprise.”
August 14, 2019
**UPDATE**
ETF Portfolio Change
This morning we sold XLE as it violated our stop loss levels. At the moment we are being cautious and replacing it with short term treasuries (BIL).
The portfolio has been updated.
We have also implemented a new ALERT SYSTEM which will send an email to all subscribers when we make changes to the RIA PRO Portfolios. See below:
CLICK TO ENLARGE
August 13, 2019
ETF Portfolio Change
With Trump caving to corporate pressure (Christmas shopping season right around the corner), and suspending tariffs on technology and apparel goods, we are tweaking our exposures in our portfolios. We started with the ETF model today, and are reviewing the EQUITY model for changes as well.
Today, we took profits in XLU as the sector was grossly extended. We reduced XLF as rate cuts by the Fed will reduce their future net margin interest.
We added to our existing Technology position (XLK) and added a 1/2 position in Communications (XLC)
I will address the reasoning in more details in our blogs and newsletters over the next couple of days.
August 12, 2019
Today, we made a small adjustment to the bond side of the portfolios by swapping the Treasury Floating Rate Fund (TFLO) for a bit longer duration Treasury bond fund (SHY). Our expectation is the Fed will cut rates again in September, which will suppress the short-end of the curve faster than the long end. By increasing duration a bit, we can add some incremental returns to the portfolio without taking on additional credit risk.
If we get a pullback in bond prices in the next couple of months, which is very high probability, we will increase duration further in the portfolio. Credit quality is important at this late stage of the investment cycle, so maintaining a high level of credit quality is very important to capital preservation in the months ahead.
August 9, 2019
Yesterday, as the market opened up fairly sharply, we temporarily closed out the 2x S&P 500 short position to allow the long-side of the portfolio to gain ground.
If today closes below the 50-dma we will begin looking for an opportunity to reinstate the short-position.
August 2, 2019
Not surprisingly, following the addition of new tariffs on China, something we had previously predicted would be the case, the market turned ugly over the past few days.
We were stopped out of NVDA and CRM this morning with breaks below support.
We will probably look to put these trades back on heading into earnings for both companies, but there is simply too much uncertainty at the moment regarding the war breaking out between the White House and the Federal Reserve.
We continue to carry our 2x S&P 500 short but will look to close that trade out as well as the market approaches an oversold condition.
August 1, 2019
** EMN stopped out at $74.75 today. Position has been closed.**
NO LONG-SHORT IDEA LIST Today
Yesterday, the Fed cut rates a quarter point and, as noted in our daily commentary, it was the suggesting of a “mid-cycle” cut which sent stocks reeling.
Given this turmoil, it is too risky to take on additional long-short bets at the moment until we can see how this is going to play out.
As noted, we sold our long GOOG position following earnings. We remain long in our 2x S&P 500 short fund to hedge our long S&P positions.
We are close to being stopped out of our remaining trading positions. However, as noted, we didn’t want to sucked in by the announcement turmoil yesterday, so we are going to wait and see how our positions trade over the next 24-48 hours.
NVDA
CRM
EMN
We will update you accordingly.
July 25, 2019
Following last week’s LONG-SHORT IDEA list, we bought 4-positions long for trading:a CRM, NVDA, EMN and GOOG.
This morning we sold our position in GOOG this morning following their earnings announcement with an average price of $ 1247.84.
Trading lesson RE-learned:
I knew better than to sell at the open this morning, but I did it because I was concerned that with AMZN’s miss, it might drag prices lower early. We got an “okay” price at the open but if I would have waited for the “robots” to finish their opening “buying,” I could have done a bit better on the trade.
This is what happens when you let emotions dictate your trading. Unfortunately, that is the lesson that must be re-learned from time to time.
NVDA is holding ground.
CRM is up slightly (waiting on earnings)
EMN is close to being stopped out.
We are still holding a small 2x-short S&P 500 index in the portfolio as a hedge going into August/September seasonal weakness.
July 24, 2019
On Monday we noted that we were taking profits in positions that had become grossly extended in the EQUITY portfolio.
Yesterday, we took similar actions in the ETF model and sold 10% of our over-weight defensive positions:
Sold XLU @ 59.94
Sold XLP @ 59.98
Sold XLF @ 28.21
This raise our cash position slightly and we are maintaining our other hedges accordingly for now.
“Equity Model: No changes this past week. We are looking to taking profits across the breadth of our portfolio as we are currently sporting gains of 20-40% in many positions just since the beginning of the year. We have already taken profits once back in May, and taking profits a second time will allow us to remove our stop-loss levels for now and look for deep corrections to rebuild holdings.”
This morning, that action was taken and we took profits on 10% of the following 11 Equity model stocks. All of these had >20% gains.
CHCT – Sold 3 shares @ 40.2559
COST – Sold 1 share @ 281.385
DOV – Sold 2 shares @ 98.2807
MDLZ – Sold 2 shares @ 54.7749
V – Sold 1 share @ 179.5506
GDX – Sold 9 shares @ 28.0965
VMC – Sold 1 share @ 138.7877
NSC – Sold 1 share @ 196.65
MSFT – Sold 1 share @ 137.5511
ABT – Sold 3 shares @ 87.68
PG – Sold 1 share @ 115.26
This is the SECOND round of profit taking we have done this year after a similar action was taken back on April 30th.
July 19, 2019
in yesterday’s commentary we noted that we were adding to our Long-Short portfolio:
A small 2x S&P 500 short position to hedge our core long positions against a retracement over the next few weeks. We will remove the short if the market is able to regain its footing and move higher, or the market sells off and reaches oversold conditions.
We sold EFA and EEM at the open and closed out our international positions.
We are also adding two trading positions from our Long-Short list – CRM and GOOG for a trade heading into earnings.
The Equity Long-Short portfolio positions have now all been updated with cost basis.
We are reviewing the 60/40 Equity Portfolio today and will begin taking profits out of our biggest gainers.
We did this back at the beginning of May, and now with many of these positions up 20% or more since the beginning of the year, we are going to lock in more of gains and wait for a correction to add back exposure at cheaper levels.
We will keep you apprised as we take actions.
July 18, 2019
This morning we are adding a small 2x S&P 500 short position to the trading portfolio to hedge our core long positions against a retracement over the next few weeks. We will remove the short if the market is able to regain its footing and move higher, or the market sells off and reaches oversold conditions.
We are also selling EFA and EEM at the open and closing out our international positions which have failed to gain any traction following the G-20 meeting and more “dovish” positioning by the ECB.
We are also adding two trading positions from our Long-Short list today – CRM and GOOG for a trade heading into earnings. Both are on the cusp of either a breakout or a breakdown, so we are running with very tight stops.
I will update the portfolio model later today once trades have settled.
July 3, 2019
Yesterday, we added a full position (1.50%) of WELL to the RIA Equity Portfolio. We also added a full position (2.92%) of REM to the ETF portfolio. REM is an ETF similar in nature to NLY and AGNC, which we purchased last week.
We have held this position previously and were stopped out. However, after a long basing period, and better than expected results from Walgreens (WBA) there is a reasonable trade set up for our longer-term Equity Portfolio.
Yesterday, we added a full position of CVS to the RIA Equity Portfolio at $54.365. However, we are also carrying a very tight trailing stop at the recent lows at $51.00.
June 18, 2019
We just published Profiting From a Steepening Yield Curve which further explains our rationale for buying AGNC and NLY in the equity portfolios. To read the article click the link below.
June 12, 2019
Portfolio Update.
EQUITY and EQUITY LONG-SHORT Model Portfolios
After taking profits at the beginning of May in a majority of our equity holdings and shifting to more defensive positioning in the ETF portfolio there hasn’t been much to do.
Today, we took some actions.
In our weekly MAJOR MARKET REVIEW we recommended taking a position in SPY with a sell target of 290. With that target hit on Monday we sold half of our positioning in the LONG-SHORT portfolio of RSP, IVV and VYM.
We will look to add back to those positions on the next opportunity.
MU continues to be our “problem child” in our portfolio. It simply isn’t performing and while it recently held support the risk/reward simply doesn’t work right now.
With a P/E of 3x, the company is simply CHEAP.
We are giving MU a bit of room, but not much, and we are very close to selling the position for now and putting it back on our watch list.
Stop-loss is set at 32.50.
The breakdown in MU today was enough to trigger our sell, so we closed out the position.
BUT, we also added 1/2 of two new positions in the mortgage sector: NLY and AGNC.
We have a specific report on this trade coming out next week.
However, our belief is that as the recession approaches we will see the yield curve steepen markedly as the short-end of the curve collapses faster than the long-end. A “bullish steepner” is beneficial for these companies so we are beginning to take on positioning to plan for that eventuality.
In the mean time, both NLY and AGNC yield healthy dividends of 13.3 pct and 12.9 pct respectively.
We will update this positioning and the reasoning for it in the upcoming report. Stay tuned.
May 28, 2019
Portfolio Update.
EQUITY and EQUITY LONG-SHORT Model Portfolios
When we originally launched the Equity Trading Portfolio we launched it as a pure Equity/Fixed Portfolio. However, within our client accounts at RIA Advisors, our equity portfolios carrya core holding of the S&P 500 which is the base we build the rest of the portfolio off of. This “core” provides a base relative to the market which then allows us to select specific equities to overweight and underweight specific areas of the market to create “alpha” over the market.
We had been looking for a correction to add the core to the equity portfolio and the recent pullback, while early, is providing the entry point. The core is comprised of 1/3 S&P 500, 1/3 S&P Equal Weight, and 1/3 Dividend Yield. This blend gives us relative performance to the S&P 500 with a bit of a defensive tilt with higher yield.
We added 1/3rd of each position on May 22nd and added again to those positions on the recent weakness.
1.5% RSP @103.62
1.5% VYM @ 85.39
1.5% IVV @ 285.02
We will continue this process into the summer until the core is complete. Looking forward, this core can both be added to, and shorted against, as needed to hedge performance.
We also added the beginnings of the core position to the Long/Short portfolio as well which, now that we can track short positions at RIA PRO, we will begin fully building out this summer from our weekly Long/Short Idea List.
May 23, 2019
Portfolio Update.
ETF Model Portfolio
We recently reduced equity exposure in the ETF portfolio by selling EEM, and cutting our XLB, XLI, and XLY exposures in half. This took our target equity weighting below our model allocation levels currently.
As noted in our newsletter over the last couple of weeks, we are seeing the early signs of a defensive rotation in equities due to the resurgence of the trade war. Therefore, we are moving our allocations accordingly to participate with the rotation.
We are adding:
1.5% to XLRE
1% to XLU
1% to XLP
After recently lengthening duration in our bond portfolios, we will look for a short-term reversal in rates, which will coincide with a counter-trend market bounce, to add further to our position in IEF.
May 22, 2014
Portfolio Update.
EQUITY and EQUITY TRADING Portfolios
When we originally launched the Equity Trading Portfolio we launched it as a pure Equity/Fixed Portfolio. However, within our client accounts at RIA Advisors, our equity portfolios carry a core holding of the S&P 500 which is the base we build the rest of the portfolio off of. This “core” provides a base relative to the market which then allows us to select specific equities to overweight and underweight specific areas of the market to create “alpha” over the market.
We had been looking for a correction to add the core to the equity portfolio and the recent pullback, while early, is providing the entry point. The core is comprised of 1/3 S&P 500, 1/3 S&P Equal Weight, and 1/3 Dividend Yield. This blend gives us relative performance to the S&P 500 with a bit of a defensive tilt with higher yield.
We added 1/3rd of each position today and will build into the core on further weakness throughout the summer. Looking forward, this core can both be added to, and shorted against, as needed to hedge performance.
We also added the beginnings of the core position to the Long/Short portfolio as well which, now that we can track short positions at RIA PRO, we will begin fully building out this summer from our weekly Long/Short Idea List.
May 14, 2014
Portfolio Update.
ETF Portfolio
Continuing from yesterday’s discussion on the impact of “trade wars” on various sectors has us beginning to reposition out of some the areas most susceptible to tariffs. Yesterday, we close out our position in Emerging Markets, and sold 1/2 of our position in Basic Materials.
Today, on the bounce as laid out yesterday, we sold half of our position in XLI (industrials) and XLY (consumer discretionary) and added one-half position in XLRE (real estate) which should be defensive with lower interest rates.
May 13, 2019
Portfolio update:
Equity Long-Short:
On Friday, we put on a small 2x S&P 500 trade for a market bounce. However, over the weekend President Trump and Xi went to war with each other completely tripping up expectations of the market. As a consequence, we closed the position out at the open for a small loss.
ETF Portfolio
Trade wars don’t play well with Emerging Markets, Basic Materials, and Industrials. We are moving a little slowly here after already taking profits a couple of weeks ago, however, we closed out our small position in EEM and half of our position in XLB. On a bounce in the market, we will close out half of our position in XLI and look to add to IAU and/or GDX.
May 10 2019
After 5-days of selling the market is short-term oversold. I put on a 5% SPY trading position in the trading account this morning for a bounce.
Buy 5% position in SSO – filled at open at 119.63.
May 9 2019
As noted in Wednesday’s portfolio position review, the majority of our positions have held up fine this week, although we do have a couple on the “high alert” list.
We have been talking about taking profits a good bit lately due to the overly extended nature of the market. When a market becomes over bought, extended and bullish there is always some issue which leads to a reversion of that positioning. This week it was the return of “Tariff Man.”
Because of the uncertainty coming out of Washington, we have remained on hold this week. The problem when dealing with the White House is the volatility caused by his “tweets.” The current sell off was sparked by his tweet on Sunday threatening additional tariffs on Friday. However, this weekend you could well see a tweet saying he and President Xi had a very good meeting and tariffs are being postponed for now. Such would lead to a market surge on Monday.
As such, we are sitting on our hands at the moment and closely watching our positioning. We are still overweight cash, bonds and gold, relative to equities, so our guard is up. Once we have a resolution on Friday, we will get back to work whichever way it goes.
This is also the reason there is NO LONG-SHORT LIST today. No matter what longs or shorts I pick, the decision from “Tariff Man” on Friday could change everything with a tweet.
A review of the reasoning behind our profit taking last week and what we are looking out for next.
April 30, 2019
PORTFOLIO UPDATE
Over the last couple of weeks, we have been discussing the incessant rise in the market and the need to trim profits and rebalance risk in some of our holdings particularly after such large gains in some of the positions since the beginning of the year. Some of the proceeds we took we then added to Health care due to the valuation opportunity that exists currently.
Sold 20% of AAPL @ 200.5446
Added to ABT @ 78.6536
Sold 10% of CMCSA @ 43.378
Sold 10% of COST @ 244.3952
Sold 10% of DOV @ 97.254
Sold 10% of YUM @ 103.97
Added to HCA @ 128.49
Sold 10% of MDLZ @ 50.545
Sold 10% of PG @ 105.635
Sold 10% of MSFT @ 130.205
Sold 10% of NSC @ 201.4858
Added to UNH @ 236.6287
Sold 10% of UTX @ 141.755
Sold 10% of V @ 165.4572
Sold 10% of VMC @ 125.3312
April 26, 2019
PORTFOLIO UPDATE
Following both disappointing earnings from Exxon Mobil and President Trump’s tweet that he called OPEC and demanded lower gas prices, how that isn’t a minipulation of markets mind you, we made the following sells:
Sold 1/2 of our position of Exxon Mobil (XOM) in the EQUITY Model
Sold 100% of Valero Energy (VLO) in the EQUITY LONG-SHORT Model
Yesterday we released Value Your Wealth – Part One Introduction. This series of RIA Pro articles will deeply explore value and growth strategies. Some of our ideas for future articles are included in this introduction article.
Over the last ten years a performance gap between growth and value has occurred on a scale only seen leading up to the 2001 tech wreck and the Great Depression. We believe this historic anomaly has important implications for investors when this market and economic cycle finally turn. This series of articles will provide you a road map to investing and preserving wealth in what we believe will be a difficult environment for most investors in the future.
April 25, 2019
This morning 3M (MMM) reported earnings which missed markedly. Outlook was poor and they cut 2000 jobs. This, combined with Caterpillars (CAT) yesterday continues to suggest economic growth may be weaker than currently reported. Combined with a strong dollar, the knock off effects in the coming quarters may be persistent.
We closed out MMM at the open this morning at a cost of $ 195.6401
The Equity Portfolio has been updated for the sale.
April 24, 2019
*** Update: We got lucky and sold GS this morning at the open at 203 which protected our gains in the EQUITY TRADING account. VLO is not working well, and we will likely trim it out in the next day or so if it doesn’t perk up. Currently, this account is mostly cash as a majority of positions are grossly extended to the upside. However, we do not have a good setup to short the market either with bullish sentiment running to extremes. So, we will hold cash until an opportunity presents itself.
As noted yesterday, we took profits in XLK and added to our holdings in XLV. This is something we discussed in our weekly sector updates. With the Healthcare sector beaten down by political rhetoric, and with strong earnings, there is some value in the sector. Technology is extremely extended, so simply just taking some profits for now.
We are going to be taking some similar actions in the EQUITY model as well. Review the Position Review for some of the areas we are looking at specifically.
April 23, 2019
We are working on taking profits in XLP, XLK, and XLY in the ETF Model and adding to XLV as we continue to roll into earnings season. No changes needed at the moment in the EQUITY Model.
In the meantime, catch up on your reading: (Click Image To Read)
April 18, 2019
I have been traveling this week, so I was unable to post the Portfolio Position Review yesterday. Since tomorrow is “Good Friday,” and the markets are closed, I am going to postpone the Long-Short Idea List until next week as “crazy” stuff can happen over a long holiday weekend.
**Trading Update: With the market opening higher this morning on the back of JPM’s earnings (which we own long in the Equity Model) and surge in China Bank Credit, we are closing out our short hedge. We are looking for additional trading longs to add to the Equity Trading Long/Short account but most positions are egregiously extended at the moment.
If you are holding junk/high yield corporate bonds (rated below BBB-) or associated ETFs (HYG or JNK for example) we suggest reading our latest article on what to expect from junk bonds if the current economic cycle is coming to a conclusion. Click below for the article.
Both J. Brett Freeze from Global Technical Analysis and Erik Lytikainen from Viking Analytics are both predicting a large move in the S&P 500 over the next week. This move could be UP or DOWN, but the bias is most likely to the downside.
Therefore we have hedged our portfolio with a Short S&P 500 position (SDS).
If the market breaks to the upside we will close it out and add to our longs positions.
April 9, 2019
No trades for today as we await a very heavy Wednesday of Fed speak and FOMC minutes.
As I noted on Tuesday, we were working on the rebalance of the Equity 60/40 portfolio. That process is now complete and the complete list of transactions is listed below. We reduced positions that had grown well beyond portfolio weights and added to underweight positions. We did NOT add to Boeing (BA) at this time as we are waiting for both earnings announcements and further reports on ongoing investigations.
Click To Enlarge For Readability
We are also reviewing the ETF 60/40 Model for rebalancing as well and will likely have an announcement on that by next week.
We have recently added the ability to include SHORT POSITIONS in the RIA PRO Equity Long-Short portfolio. We are rebuilding our model currently to start implementing the trades we discuss on Thursday’s Long-Short Idea List
(Note: The Long-Short Idea List is on hiatus today as we work through this process.
Note 2: We will be rolling out the ability to add short-positions in all user portfolios in the next couple of weeks along with a “live” version of the 401k Plan Manager.)
April 2, 2019
Slow News Day – Catch Up On Your Reading
April 1, 2019
All dividends and interest for March have been added to the cash balances of all three portfolios.
We are working on doing a system wide rebalance on all accounts this week for the quarter and ahead of the start of earnings season.
We will provide an update on all activity when the rebalance process is complete.
Transports violated their stop loss and need to be sold. Watch Financials as they are close to their stop-loss as well.
Market being driven by a narrowing participation.
We have reorganized the menu items to make them more intuitive in the research and portfolio construction process.
START – Catch up on daily portfolio alerts, commentary and blogs.
MACRO – An high level overview of what’s moving in markets and sectors.
IDEAS – Drilling down into markets and sectors to find out whats working and what’s not.
RESEARCH – Found an idea – research it with charts, analyst reviews, etc.
PORTFOLIO – Add it to your portfolio or watch list.
NEW PORTFOLIO FEATURE: SELL SHORT
In our Equity Long-Short portfolio we have only been able to buy ETF’s which short the market as the mechanics in the portfolio tool did not allow for entering SHORT positions.
That has now been resolved.
In your portfolio, you can now SELL SHORT to open a new position and BUY TO COVER to close it out.
MAJOR MARKET BUY/SELL REVIEW is now available
ICYMI – REAL INVESTMENT REPORT
March 22, 2019
Equity Long-Short Portfolio
** Update: Sold remaining 1/2 of 2x Short S&P 500 position today at $ 33.6728
March 20, 2019
Equity Long-Short Portfolio
** Update: Sold 1/2 of 2x Short S&P 500 position pre-Fed announcement at $ 33.685
Equity Portfolio
** Update: FDX sold at $ 172
** Update: Bought 1/2 position of Micron Technologies (MU) at $ 40.49 before earnings. Stop-loss is any downside break due to missed/poor earnings.
Selling Federal Express (FDX)
As noted in today’s PORTFOLIO POSITION REVIEW, below, we are selling Federal Express after a second dismal quarterly earnings report and forecast. In our management process, we can forgive a one quarter miss, but two quarters tends to represent a bigger issue for the company. We will come back to FDX later when things begin to show signs of improvement.
Snapshot:
FedEx Corp. (FDX) reported fiscal third-quarter earnings of $739 million.
On a per-share basis, profit was $2.80. Earnings, adjusted for non-recurring costs, were $ 3.03 per share.
The results missed Wall Street expectations. The average estimate was for earnings of $ 3.10 per share.
Revenue was $ 17.01 billion in the period, short of forecasts for $ 17.64 billion.
The short-fall in EPS was despite continued share count reduction which is problematic.
With the market entering into the quarterly “blackout period” for stock buybacks, and with options expiration behind us, there is a decent probability of a short-term pullback to support given the short-term overbought conditions.
Given that setup, we bought a 2X S&P 500 inverse position (SDS) in the EQUITY LONG/SHORT portfolio to both hedge our Boeing (BA) trade and take advantage of a short-term correction through the end of the month.
Tomorrow is QUADRUPLE witching as all options contracts for March expire simultaneously. This always creates volatility in the market and some of the recent runup in equities may be linked to impending option rolls.
Therefore, we have closed our recent 2X S&P 500 position until we get through tomorrow because leveraged funds are impacted by optionality. We will add the position back on a retest of support.
Also, as noted in today’s commentary, Erik Lytikainen has been nailing the oil market for the last 6-months. His analysis suggests a roughly 2 dollar drop in oil prices tomorrow during options rolls. We added a ONE DAY short trade on oil prices (SCO) which will be closed out tomorrow by the end of the day.
_____________
Note: I got waylaid on a couple of big projects yesterday and was unable to get the LONG-SHORT IDEA LIST generated. I will try and get that published later today. My apologies for the delay.
With the pullback and successful test of the 200-dma we add some exposures to our portfolio.
We have been light on financials so we added a starter position in JP Morgan (JPM) which compliments our current holding in Visa (V)
We also added a fundamental cheap utility company PPL Corporation (PPL) which trades at 12x earnings and a 23% profit margin.
After a series of negative reports and a vast majority of Wall Street analysts now negative on Apple (AAPL) we added 1/2 position as a trade and will look to build that out heading into their earnings report which will likely surprise to the upside. Risk/reward decent in the position currently.
We also add to our holdings of United Health Care (UNH) and HCA Healthcare (HCA) bringing those positions to full model weights as the pullback to support held.
Yesterday, one of our users discovered a glitch in the indices overview sector where the commentary was not updating for each market. That has now been corrected.
Like our long/short portfolio discussed in yesterday’s trade notes we also closed our a small short S&P 500 position and added 1/2 position in Boeing (BA)
This morning we bought a position in Boeing (BA) following the sell off on news of the crash over the weekend. Even if the two crashes of the 737 MAX are related to a structural design issue it will take years for a settlement to be reached and even longer to be paid out. (We can look at BP following the Gulf well blowout as an example.)
Therefore, in the short-term we thing there is a good trading opportunity as well as a long-term play as we added 1/2 of a position to our Equity Model as well. We will allow for weakness in the position as news works its way through the stock to add our second 1/2 position in the future.
Also, with the market short-term oversold as of the end of last week, we closed our our short S&P 500 (SH) position and added 1/2 position in 2x S&P 500 (SSO).
DID YOU KNOW – You can quickly look at the best performing sectors and see the top players in that sector. It’s a great way to come up with investment ideas if you are overweight or underweight sectors in your portfolio.
Click On MARKET DATA tab and scroll down to theS&P SECTORS link. Then select the SECTORS RELATIVE STRENGTH sub-menu tab.
March 7, 2019
Portfolio Update:
No actions have been needed over the last couple of days. Given that we are carrying an overweight position in cash and many of our positions are at 1/2 weights, we are looking for a buying opportunity to add exposure during the correction/consolidation phase. Importantly, the market must hold the 200-dma which we will evaluate in the this coming weekend’s newsletter.
DID YOU KNOW – You can compare all the FUNDAMENTAL STATS of your stock to its peers? Simply click on CHARTS and go to the FUNDAMENTALS STATS TAB
March 5, 2019
Portfolio Update:
We were stopped out of Walgreen’s Boots Alliance (WBA) on Monday and the equity portfolio has been updated. As we stated previously, we like the corner drug store model for a lot of reasons, but the market doesn’t agree with our assessment currently. We will come back to either CVS or WBA in the future when prospects improve.
DID YOU KNOW – We post our proprietary market internals for you to use in your analysis. Head over to the MARKET DATA tab and click on MARKET INTERNALS on the drop down menu.
If you click on HEAT MAP and then select GRID option you can sort Stocks, ETF’s and Funds by a variety of measures to find great long and short candidates.
As we discussed in this mornings TECHNICALLY TRADINGreport, the odds of an unabated continued rally from this point is becoming much less likely.
Based on this analysis we are closing out our long-positions in the EQUITY TRADING LONG/SHORT portfolio and taking our profits. (Note: These transactions are ONLY in the trading account and are not applicable to the Equity portfolio which has a longer-term investment horizon.)
Today, we sold:
RTN
UTX
HCA
VMC
MSFT
LLY
YUM
We are maintaining our long/short hedge of SH and XLU at the moment as we await a better opportunity for the next set of trades.
As noted in thispast weekend’s newsletter,yesterday we added starter positions in both Gold and Emerging Markets.
Equity Portfolio – 1/2 position in IAU
ETF Portfolio – 1/2 position in IAU and EEM
Gold and Emerging markets have been performing much more bullishly as of late but both are extremely overbought short-term. As always, we start with a “trading” position which limits our portfolio risk currently, and if the trade begins to work as we expect, we then add to the position for a longer-term investment.
We are still worried about the global economic weakness which will likely wind up negatively impacting emerging market stocks, but the recent break above the 200-dma, and retest, is a bullish trading setup short-term.
IAU is a hedge against rising inflationary pressures and global weakness. Again, as with our exposure in our Equity Portfolio to GDX, it is a hedge against equity risk in the short-term.
As I noted in this morning’s LONG-SHORT IDEA list, candidates are getting much harder to come by which is symptomatic of a market reaching more extreme overbought conditions.
Also, be sure and check out our new tools on the site:
This week we used our NEW HEAT MAP TOOL(Click on HEAT MAP in the menu bar above) to screen for our candidates. Change the layout to GRID and then short by a fundamental or momentum ranking.
As noted last week, the new SCAN TOOL also has several new screening parameters to include both fundamental factors(Piotroski Score) and momentum factors (Mohanram Score) along with Zack’s rankings.
More innovations are on the way…stay tuned.
February 20, 2019
This morning I posted our Selected Portfolio Position Review in which I discussed our holding of CVS Health Corp. (CVS).
To wit:
CVS has been a laggard in the portfolio and was very close to being stopped out.
The recent rally above short-term resistance is postive, but needs to rally above the long-term moving average to build momentum.
The sell-signal is improving but we are likely going to sell the position here soon when we find a suitable swap to replace it with.
Stops are moved up to $66
This morning, on rather disappointing earnings, CVS sold off and triggered our stop loss.
As discussed, since we like the “Corner Drug Store” business, we swapped into Walgreens Boots Alliance (WBA) with only a minor difference in cost basis.
Fundamentals for WBA are also comparable to CVS.
P/E: 14x
Fwd P/E: 10.56x
Income: $5.20 Billion
Sales: $134.59B
Yield: 2.36%
LT Debt/Equity: 0.45
Price/Book: 2.76
Price/Sales: 0.51
February 18, 2019
Markets are closed today, so it’s a great day to catch up on your reading.
February 16, 2019
Real Investment Report Is Now Available
February 14, 2019
**UPDATE – we closed out SSO this morning with break back below the 200-dma on pretty dismal economic data. We are leaving our hedge in place in the Long-Short portfolio.
Today’s list was created using our newly UPDATED SCAN TOOL which now includes Zack’s ranking, Piotroski Fundamental Scores, and Mohanram Momentum Scores. You use the screen to reduce the potential universe of stocks quickly to improve you stock selections. Give it a try by clicking SCAN in the menu bar above.
Yesterday, the market broke above the 200-dma which effectively now resolves the more bearish backdrop of the market from 2018. The next major resistance is at 2800 where the October and November highs reside.
If the market can clear that hurdle, then all-time highs are the next target.
Click To Enlarge
What is important, is where the market CLOSES ON FRIDAY. The breakout of the market above the 200-dma will be invalidated if it closes below that level on Friday.
If that happens the 200-dma will be reinforced as resistance for the market and it will be considered a failed test of that level.
For this reason, we have not closed out our short position in either of the equity portfolios. However, in the Equity Long-Short Portfolio we did neutralize the short position with 2x leveraged S&P 500 fund (SSO). If the market rises and confirms the breakout, we will close the short-hedge.
There are still plenty of risks to markets over the intermediate term, but the momentum behind the equity rally remains bullish for now.
Yesterday, the market ran into the 200-dma. As I noted in this past weekend’s missive, another test of the 200-dma was likely. However, what is important is whether the market can close solidly above the 200-dma by Friday’s close.
Click To Enlarge
If that happens then much of the bearish case for the markets will have been absolved, so any further weakness that maintains support at the 200-dma should be bought.
There are still plenty of risks to markets over the intermediate term, but the momentum behind the equity rally remains bullish for now.
Our equity portfolio remains somewhat defensive in nature with 17% cash currently, but we will deploy that cash opportunistically in the weeks ahead as as the market progresses.
February 12, 2019
Sector Buy/Sell Review Is Now Available
February 11, 2019
Major Market Technical Review
Equity Portfolio Update:
We added 1/2 position of UNH (United Health) to the portfolio. With support close by, we will watch and wait for a an opportunity to fill out the other half of the position.
February 9, 2019
Weekend Newsletter Is Out!
Over view of market technicals and backdrop.
Sector and Market analysis.
Portfolio positioning
401k Plan Manager.
February 8, 2019
Yesterday, we added a small short-position to the Equity Portfolio as a hedge (we used SH) as the market is currently tracing out the pathway we laid out a couple of weeks ago.
Right now, the hedge is small relative to the size of the portfolio, but the composition of the portfolio is already very defensive plus we have an outsized holding of cash.
Support for this pullback is at the confluence of the Oct-Nov bottoms and the rising 50-dma. If that support holds we will add to our existing equity holdings and remove all hedges. If it fails, we will continue to build the hedge to protect capital.
Importantly, the risk IS elevated. As noted in the chart below, the rising wedge from the lows has been violated. The market MUST close in the green today otherwise the 100-dma and the 350-dma will be violated as well.
As noted yesterday, the market is looking to pull back here a bit after running into the 200-dma which is in line with our path prediction described a couple of weeks ago. (Click To Enlarge)
We have a hedge ready to introduce to portfolios if the market closes below 2710 by Friday. Such a close would reflect a further decline back to a minimum of 2625-2675, but lower levels are certainly viable.
After the State Of The Union address we will sit back and wait for some type of corrective action before taking any further actions within portfolios.
I am looking to sell COST and CVS opportunistically and am looking for positions to swap into.
Two weeks ago I produced the following chart with a Green projection line for the market. The rally has exactly traced that projection since that time and hit our targets which is why we reduced some of our overweight core positions yesterday.
The ideal pullback target will be a retracement back to 2625 that holds. (Click to enlarge)
Ahead of tonights “State Of The Union” address, we are adding Basic Materials to our ETF portfolio in anticipation of proposal for an infrastructure program.
We are offsetting that purchase with a reduction in both RSP and VYM as the market has come too far, too quickly and has hit our near term targets of the 200-dma.
Equity Portfolio Actions: Reducing DOV adding VMC
In the Equity model we are taking some profits in DOV which has had an enormous run following their earnings announcement and we are picking up VMC (Vulcan Materials) which should benefit from any talk about infrastructure spending plans. They also announce earnings next week which could be a positive catalyst for the company.
Equity Long/Short – Adding VMC and increasing SH
We are also adding VMC to the long/short portfolio for the same strategy as the Equity model, but given the extreme run of the markets in recent weeks we are also adding to our S&P 500 short position as a hedge.
As we have discussed previously, the market has been consolidating along the 50-dma and the Oct/Nov lows within a very tight range as shown in the chart below. (Click to Enlarge)
Yesterday, the Fed announced that not only would they be patient with further rate hikes, but also is open to moderate balance sheet reductions as need. In short, Jerome Powell admitted he was the “market’s b*tch.”
With that the S&P 500 broke out of its consolidation and above the running downtrend line from the 2018 highs. This sets up a run to the 200-dma as the most likely outcome over the next couple of weeks.
We had launched the ETF model at the first of January at 1/2 weight. Yesterday, we added the positions as noted above and brought the model to full target weights of 75% exposure. This still leaves 20% in cash, 35% in fixed income and 45% in equities.
When the weekly “buy” signals are triggered we will bring the model up to full target weight on the equity side of the allocation.
January 30, 2019
Update: Market is rallying today and is running into the bottom of its downtrend from the 2018 highs. We are just going to wait to see what the Fed says and how the market interprets it. We have some trades on deck that we are looking to institute in both the Equity and ETF portfolios.
Also, make sure and read today’s portfolio position update.
Much as been made about the bullish ratio of price to forward earnings. In today’s article, Price To Forecasted Hope, we help make sense of the valuation model and explain why it might be sending the same false buy signal it sent in November of 2007.
“NEW MENU ITEM” – ANALYST RECOMMENDATIONS
Check out the new “tab” on the menu bar above labeled “ANALYST.” This page allows you to scan Wall Street and media buy/sell/hold recommendations for your favorite stocks. We also made updates to the portfolio page to make the Transactions table sortable and added a Closed Positions tab. Below is a screen shot of the new Analyst tab.
These changes started as requests from subscribers. Please keep them coming.
January 29, 2019
Sector BUY/SELL Review is available:
“NEW MENU ITEM” – ANALYST RECOMMENDATIONS
Check out the new “tab” on the menu bar above labeled “ANALYST.” This page allows you to scan Wall Street and media buy/sell/hold recommendations for your favorite stocks. We also made updates to the portfolio page to make the Transactions table sortable and added a Closed Positions tab. Below is a screen shot of the new Analyst tab.
These changes started as requests from subscribers. Please keep them coming.
January 28, 2019
Markets are set to open lower this morning as concerns over global growth are seeping into corporate earnings. While CAT beat estimates this morning, their outlook for global growth was weaker than expected.
The Fed is on deck this week, so all eyes will be focused on their statement with respect to any guidance on potential ceasing rate hikes and balance sheet reductions.
We will likely hold off on any portfolio changes until after the announcement.
Be sure and read today’s recommendations for the major markets.
Also, catch up on all of our sector and market analysis from this weekend’s newsletter.
January 25, 2019
** UPDATE #2 **
In the Equity Account we sold ABBV and PFE. Both positions broke down out of consolidation patterns suggesting lower price levels for now. ABBV had a poor earnings announcement and performance of both PFE and MRK has been extremely weak. We BOUGHT 1/2 position in HCA as we need Health Care exposure and added to our position in GDX.
** UPDATE #1 **
In the Equity Trading Account we sold AAP and AZO. Both positions broke down out of consolidation patterns suggesting lower price levels for now.
As noted yesterday, we made added some equity to both the trading and equity model.
This morning, futures are pointing sharply higher on reports from the WSJ that the Fed is considering ending their Quantitative Tightening (QT) process much sooner than expected. To wit:
“Federal Reserve officials are close to deciding they will maintain a larger portfolio of Treasury securities than they’d expected when they began shrinking those holdings two years ago, putting an end to the central bank’s portfolio wind-down closer into sight.
Officials are still resolving details of their strategy and how to communicate it to the public, according to their recent public comments and interviews. With interest rate increases on hold for now, planning for the bond portfolio could take center stage at a two-day policy meeting of the central bank’s Federal Open Market Committee next week.“
Given the weakening economy, pressure from the Administration, and the recent market correction, it is not surprising to see the Fed buckle to pressure from their member banks.
Despite a 10-year economic recovery, the Fed, the markets, and the economy are still reliant on “emergency measures” for support. What could possibly go wrong?
However, for now, the markets are moving back into a much more “bullish mode.” With February fast approaching, which tends to be a weaker month, look for pullbacks to support to begin increasing equity exposure.
January 24, 2019
We made several portfolio changes today. (All portfolio models have been updated)
Equity Model
We added 3 new positions at 1/2 weight. (With the market very overbought we are looking for a pull back to add to our holdings at a better cost basis and with better risk/reward measures)
MSFT – Microsoft Corp.
UTX – United Technologies
YUM – Yum Brands (From our long-short idea list)
Given that we are only about 1/2 weighted within our equity model currently, we have temporarily swept our excess cash into an ultra-short Treasury bond ETF:
BIL – 1 to 3 Month Treasury
ETF Model
We are currently weighted only at our core holdings (RSP, VYM, IVV)
We have swept excess cash into BIL as a temporary place holder until we get a better risk/reward entry point for increasing exposure to equity risk.
January 23, 2019
Markets sold off yesterday and bounced off of the first level of support as I laid out in this past weekend’s RIA Report.
Pathway #2: Given the extreme overbought condition of the market, a pullback is likely. The most bullish would be a retest of the Oct/November lows that works off the short-term overbought condition. This would provide the best opportunity for a push above the 200-dma. Given the overbought short-term condition of the market, the compressed rise in prices, and extension from the lows, a correction is likely to entail a bigger draw down. (Probability 20%)
As shown, the market pulled back to that first level of support.
(Click to Enlarge)
The good news is the market did hold on to both the 50-dma and previous support line running back to January of 2018.
That wasn’t going to be the case until Larry Kudlow came out late yesterday to say the meeting China’s delegation had NOT been called off. I am pretty sure this will likely turn out to be a fallacy as we have seen both the Fed and the White House panicking over the recent decline. As such, we have moved into an environment where every pullback has to be met with reassurance.
Importantly, the overall downtrend is intact and there is a fairly high probability that current support will fail in fairly short order. Remain defensive for now.
January 22, 2019
Markets are set to open lower this morning as trade tensions and global growth concerns return to the forefront.
While earnings have been “okay” so far, as I noted in today’s “Fundamentally Speaking” the majority of the beats are coming in against sharply lowered estimates. In fact, despite all of the media “hype” about exploding earnings, both revenue and earnings are slated to have a negative growth rate for the quarter.
For now we are watching the markets carefully. We remain underweight equity and over-weight cash and fixed income as this rally has run into important resistance and most of the short-covering, which has fueled the rally from the December lows, appears to be completed.
The chart below lays out potential retracement ranges for a pullback with the most bullish in “green” and moving to the most bearish in “red.” My suspicion currently is we see a 5% pullback from current levels which would pull the S&P 500 back to the 50% retracement level wiping out half of the gains from the December 24th low. (This is an important point not to be overlooked. While the media often dismisses pullbacks by saying “yes, the market pulled back 5% after advancing 12%, the reality is that decline wiped out 50% of the previous gains.
(Click to Enlarge)
With markets extremely overbought short-term, remain cautious for a better opportunity to increase exposure.
January 21, 2019
On Friday, bonds provided the pullback that we had been looking for to add to our fixed income holdings. As shown in the chart below, the long-term trend in bond indicators are all signaling the next leg of the “bond bull” market.
While this doesn’t mean that interest rates can bounce up back toward 3.0%, the overall trend of rates is going lower over the next couple of years. Given the rising risk of a recession in the next 24-months, it is highly likely that rates will ultimately fall below 2%.
In the models we added to our existing bond holdings:
DBLTX – Doubleline Total Return Fund for GNMA exposure.
GSY – Short-duration bonds which will protect against rate volatility.
SHY – Same as GSY but with a U.S. Treasury based structure for increased credit quality.
TFLO – Treasury floating rate fund for increase credit quality.
In a recession, corporate bonds are at the most risk of declines in prices which is why our focus currently is on duration and credit quality. When bullish trends are firmly established we will begin to add positions to add to duration to participate in the rate decline.
NOTE: In our actual client portfolios we use individual bonds but in order to get consistent and stable pricing across models we are using the above holdings as a “proxy” for our client portfolios.
January 18, 2019
In our Equity Trading (Long-Short) Account we added the following positions this morning:
This adds additional long-exposure to the portfolio while we still carry our short hedges.
We currently have 3-4 equity positions we are looking to short as well and are just waiting for the right positioning within the overall market to increase our short-book further.
January 16, 2019
Yesterday, we added to our existing XLU trade in the equity trading portfolio and add 1/2 of a position to the ETF model.
As discussed in this past weekend’s newsletter, the Utilities sector continues in a very bullish trend currently and is also a defensive position against potential market weakness.
The chart below shows the market rally from the December lows. Most importantly note the rather dramatic plunge in volume on the rally at a point where the market is very overbought short-term and the advance-decline remains in a substantial downtrend.
(Click to enlarge for readability)
As stated yesterday:
“I continue to believe, currently, that at a minimum we will retest lows over the next couple of months. This is why we remain very underweight equities across all models currently.
However, if the market is able to rally above resistance and begin to reverse the negative trend of the market currently in place, then we will adjust accordingly and increase equity risk. However, such is not the case currently.”
We remain cautious for now and will look for a better opportunity to add equity exposure tactically.
January 15, 2019
I wanted to draw your attention to the NEW DAILY posts we are producing for you each day. Today, we are covering the major sectors of the market with technical entry and exit points for traders.
As I discussed in today’s technically speaking post, the recent rally in the market has been nice but has done little more than retrace most of the breakdown from the October/November lows.
With a lot of overhead resistance, the market back to short-term overbought conditions, and volume on the decline, as shown below, there is not a lot of reward currently relative to the potential risk of a retest of December lows.
I continue to believe, currently, that at a minimum we will retest lows over the next couple of months. This is why we remain very underweight equities across all models currently.
However, if the market is able to rally above resistance and begin to reverse the negative trend of the market currently in place, then we will adjust accordingly and increase equity risk. However, such is not the case currently.
January 10, 2019
Trade Update: In the Equity Portfolio we sold the following stocks:
AXP
CDW
MDT
MSFT
UNH
As we have mentioned on numerous occasions, we have been looking for the market to bounce from extreme oversold conditions to reduce our equity exposure. Given overhead resistance and the unwind of oversold conditions we reduced our equity exposure. At noon, we sold the shares listed above accounting for approximately 6% of the portfolio.
January 9, 2019
Trade Update:
In our newly created Equity L/S Trading Portfolio, located in the Portfolios tab – RIA PRO we made our first trade.
We purchased:
50 Shares of XLU (SPDR Utility ETF) at 52.875 representing 2.6% of the portfolio
170 Shares of SH (Proshares short S&P 500) at 30.275 representing 5.1% of the portfolio
These trades are part of the first leg into a larger trade. Currently, and subject to change, we expect to own 5% XLU, 10% TLT (iShares 20yr+ Bond ETF), and 15% SH. This combination of positions should do well if the market resumes its bearish trend. The S&P 500 is currently hitting the underbelly of many resistance levels which provided us the rationale to put on these opening trades. We do believe there is a decent chance the market can rally further so we will wait to add to the trade.
We will monitor the trade and the market closely and add to the position or close it if necessary.
Equity L/S Trading Portfolio Description
This portfolio is completely flexible and will take on trades which are both long or short. The portfolio can buy stocks, ETF’s, or mutual funds OR can be fully invested in cash.
There is no defined holding period for any position bought which means it can be opened and closed within the same trading day.
When trades are placed in the trading account we will report those trades after the close of business.
As noted yesterday, the rebound from the December lows is set to continue today as hopes for a resolution of the “Trade War” with China is close.
Given that this whole situation was started by the current Administration, we expect the announcement to be little more than a “cease fire” for some period of time and talks to resume later. The goal of both the U.S. and China delegations is to remove the “trade war” off of the headlines and relieve the economic pressures on both countries.
In the meantime, the markets are approaching our initial resistance point at 2600-2650. There is a potential that if the markets can break above that resistance we could see a retest of the the previous November/December highs. However, that is likely the extent of the rally before we ultimately see a retest of recent lows.
However, if you are looking for long and/or short candidates for your portfolio, RIA PRO shows you the best and worst performing stocks each day under the “Active Trader” tab. As always, momentum tends to run in one direction for a while, so strong players tend to remain strong, and the weak can be shorted.
There are a tremendous number of hidden gems on the site so explore and feel free to ask us questions if need help.
Have a profitable day.
January 8, 2019
NOTE: We have launched 4-new reports that will be produced regularly:
Monday – Major Market Buy/Sell Analysis
Tuesday – Major Sector Buy/Sell Analysis
Wednesday – Portfolio Position Technical Review
Thursday – Watch List Review
If you have any suggestions to improve these reports, please let us know.
Market Update
The market continues to rally following the deeply oversold condition seen Christmas Eve. As noted by the “Technical Measures” gauge on the right, that gauge fell to 6 during the recent sell off. To understand the importance of that oversold condition I have overlaid the technical measure with the S&P 500 index.
While technical measures have rebounded over recent days, the previous low read of 6.47 was on of the lowest seen during previous corrections and bear markets.
IMPORTANTLY: Note that during real bear markets, the indicator tends to reach lows as seen recently. However, during previous bull market the lows tend to remain around a reading of 50. During the last decade, when lows below 20 were reached, which would normally indicate the onset of a bear market, either the Fed or Central Banks stepped in with liquidity. This time, Central Banks are extracting liquidity which may suggest we see a retest of recent lows before the current corrective cycle is complete.
Our target for this rally remains 2550-2600.
January 6, 2019
As we noted previously, the models we built on RIA PRO were replicas of the models we run internally at RIA Advisors for our clients. However, the models were NOT total return as they did not include the dividends, interest, and distributions from the underlying holdings.
Therefore, as we have been noting over the last couple of months, we have launched THREE new LIVE portfolios with each tracking a LIVE account we manage at TD Ameritrade.
The 3-models are:
60/40 Equity Portfolio
60/40 ETF Portfolio
Trading Portfolio
Equity Portfolio – Start Date 1/4/2019
The portfolio was bought into the same holdings which are currently owned by our equity only clients. These holdings will be managed according to the same technical and fundamental processes that we employ at RIA Advisors.
We are using ETF’s and Mutual Funds for the fixed income portion of the model.
Trades will be reported AFTER the close of business when they are made.
ETF Portfolio – Start Date 1/4/2019
This portfolio is comprised of all ETF’s and trades will be reported AFTER the close of business when they are made.
We have currently bought 1/4th of our CORE Equity and BOND sleeve so far. We will continue to build out the model opportunistically until we get to full weightings.
Trading Portfolio – Start Date 1/4/2019
This portfolio is completely flexible and will take on trades which are both long or short. The portfolio can buy stocks, ETF’s, or mutual funds OR can be fully invested in cash.
There is no defined holding period for any position bought which means it can be open and closed within the same trading day.
When trades are placed in the trading account we will report those trades after the close of business.
________________
At the end of each month all dividends, interest, and distributions will be added to the CASH balance of the portfolio as they are reported on the account statements.
Furthermore, in the next couple of months we will add performance tracking of the portfolio over different time frames for comparison purposes.
Thank you for your patience.
December 26, 2018
As I noted yesterday, the market is sitting on very important long-term support and needs to defend current levels. To wit:
“Currently, the market has started a mean reversion process back to the 200-week (4-year) moving average. As you will notice, with only a couple of exceptions, the 200-week moving average has acted as a long-term support line for the market. When the market has previously confirmed a break below the long-term average, more protracted mean-reverting events were already in process.”
“While, the bulls remain in charge for the moment with the market sitting just a few points above the long-term average. A weekly close below 2346 on the S&P 500 would suggest a deeper decline is in process.”
After a brutal sell off over the last 8-trading days, US equity futures are rebounding from overnight trading which saw the E-mini initially tumble 1% early in the overnight session, then rise as much as 0.6% in yet another illiquid session boosted by Trump’s latest attempt to talk up markets after an apparent de-escalation in tensions between the president and the Fed chair and Treasury Secretary. Earlier, Asian stocks outside of Japan dropped 0.2% to a two-month lows catching down to Monday’s US market rout, while Europe was mostly closed for trading.
S&P 500 contracts gained 0.6% as of 7am ET after falling as much as 1.1 percent earlier. Futures on the Nasdaq 100 Index and the Dow Jones Industrial Average advanced 0.4 percent and 0.5 percent, respectively. With the S&P closing on the edge of a bear market, traders will be looking for confirmation of more liquidation selling or else an attempt at lifting stocks from massively oversold levels.
Top Overnight News
U.S. stock-index futures whipsawed between losses and gains, as investors assessed comments from President Donald Trump that he was confident in Treasury Secretary Steve Mnuchin and the American economy while the benchmark index sat at the edge of plunging into bear market territory
President Trump’s frustration with Mnuchin is ratcheting up after his attempts to calm Wall Street failed, CNN reported, citing a source close to the White House.
Japanese stocks rose for the first time in six days as electronics makers staged a rebound after the Nikkei 225 Stock Average tumbled into a bear market on Tuesday
Bank of Japan Governor Haruhiko Kuroda said growing overseas economic risks and recent market volatility are precisely the kind of circumstances that call for sticking with powerful and sustainable stimulus
Oil in London fell below $50 a barrel for the first time since July 2017 as broader financial market turmoil and worries over U.S. supply countered signals from the OPEC+ coalition that it may extend or deepen output cuts
Gold is rallying into the end of 2018 as turmoil in global equities, the partial U.S. government shutdown and concerns about the outlook for next year stoke demand, lifting prices to the highest in six months
December 24, 2018
As noted in this past weekend’s newsletter, the market is EXTREMELY oversold and a bounce is likely in the near term as portfolio, pension, and hedge fund managers rebalance for end-of-quarter reporting.
Our composite technical indicator, as shown below, is at 6.85 (on a 0-100 basis) which is one of the more severe oversold readings seen historically. It is suggestive of a fairly strong reflexive rally in the month or so ahead particularly as we flip the calendar. However, this is a trading bounce only and longer-term investors should look to use the bounce to reduce equity exposure further. It is unlikely we are going to resume the bull market in 2019 based on the current economic and fundamental backdrop.
REMINDER!
RIA PRO Model Changes
The current RIA PRO portfolios were built during the BETA Testing phase of our development. As such, the portfolios are CAPITAL APPRECIATION only and do not reflect the interest income from the bond holdings or the dividends from the equity holdings.
Starting in January, we will discontinue the three current portfolios and will swap to 3-portfolios tied to live accounts which gives you three important advantages:
Trades will be able to reported “real time” instead of a 3-day delay.
Interest and dividends will be credited the the portfolios on a monthly basis
Total returns, including all costs, will be reported.
We apologize for any inconvenience but we feel this will be a much better way to align the RIA PRO models to actual results for tracking purposes. We will keep you apprised of progress over the next month before we make the final changes.
Thank you.
December 20, 2018
Trade Alert
We sold IVV from all three portfolios. In the 60/40 ETF Model we reduced the position by 5 percent from 14.50 to 9.50. In the other two portfolio we sold the entire position.
We sold the entire position of XLV in the 60/40 ETF Model.
We are increasingly convinced a bear market has begun. We will not get concrete evidence until month end. Given the sloppy price action and the tone from the Federal Reserve and Jerome Powell, we thought it appropriate to reduce our exposure further.
It is possible the market bounces as it is extremely oversold. However, we maintain that these bounces are opportunities to sell and should not be mistaken for a resumption of the bull market. If the technical outlook changes we will reverse that stance but for the time being we believe conservatism is the best course of action.
Changes in the portfolios as shown will occur shortly.
REMINDER!
RIA PRO Model Changes
The current RIA PRO portfolios were built during the BETA Testing phase of our development. As such, the portfolios are CAPITAL APPRECIATION only and do not reflect the interest income from the bond holdings or the dividends from the equity holdings.
Starting in January, we will discontinue the three current portfolios and will swap to 3-portfolios tied to live accounts which gives you three important advantages:
Trades will be able to reported “real time” instead of a 3-day delay.
Interest and dividends will be credited the the portfolios on a monthly basis
Total returns, including all costs, will be reported.
We apologize for any inconvenience but we feel this will be a much better way to align the RIA PRO models to actual results for tracking purposes. We will keep you apprised of progress over the next month before we make the final changes.
Thank you.
December 18, 2018
Be sure and read today’s post on the market as I walk through some of the longer-term underpinnings of the market.
We have been giving the market a little room here due to deeply oversold conditions, but that has proved problematic as the markets have been unable to muster a rally. However, with the Fed on deck today and tomorrow, it is likely the market will rally on “dovish” comments from the Fed.
We will be using that rally to raise more cash heading into the end of the year as the markets have now changed their overall trend from bullish to bearish.
This morning futures are higher following better than expected housing data (less bad than expected.)
Dow: +128
S&P 500: +14.25
Nasdaq 100: +39.75
Crude Oil: -1.39
Gold: -0.20
The target for the rally is 2600 which is likely all we are going to get for now. Be a scale up seller.
European Union will rule out doing mini deals with the U.K. to ease the chaos of Britain crashing out without a divorce agreement, and instead take unilateral steps to protect its interests, a person familiar said
U.K. said to prepare migration policy favoring high earners, after months of arguments over which applicants should be given preference
Chinese President Xi Jinping said his government will continue a multi-year effort against pollution, poverty and financial sector risks, while underlining commitment to the multilateral global trading system
China Daily reports individual income tax reduction will be on top of Chinese government’s task list next year, citing an unidentified official
President Trump slammed the Fed on the eve of its policy meeting for “even considering” another rate increase, and suggested the central bank has no reason to move because inflation is low
Fed rate hikes are extremely rare when stocks are this beaten up
Reserve Bank of Australia struck a slightly dovish tone in minutes of its last policy meeting of the year
Bank of Canada Governor Stephen Poloz says he isn’t expecting a recession in 2019. The economy is operating near capacity and inflation on target means rates should be more normal and move toward a neutral range of 2.5% to 3.5%
China’s holdings of notes, bills and bonds dropped for a fifth month to $1.14t in October, from $1.15t in September, according to Treasury Department data
Crude settled below $50 a barrel in New York for the first time in more than a year and continued falling in after-hours trading
The EU will rule out doing mini deals with the U.K. to ease the chaos of Britain crashing out without a divorce agreement, and instead take unilateral steps to protect its interests, a person familiar with the bloc’s plans said
M&G Investments is building up its war chest of U.S. Treasuries on wagers that yields in the world’s most liquid bonds are likely near their peak
This week, Sweden’s central bank may be facing its most difficult meeting since 2011. That’s the last time the bank raised interest rates and, in so doing, set in motion a cycle that ultimately ended in the deployment of crisis measures
Germany’s federal government plans to increase gross borrowing by around 15 percent to 199 billion euros next year to accommodate refinancing of the nation’s “bad bank” fund that was set up during the height of the financial crisis
“Given the Fed meets next (this) week, we are going to give our trade just the smallest margin of movement currently for three reasons:
The market is deeply oversold which will contribute to a bounce on any bit of good news.
The index closed lower than where it opened for 4-consecutive days. Such selling is often met with a one or two day bounce.
Lastly, as noted previously, distributions for mutual funds are now mostly complete and they have to rebalance portfolios before the end of the reporting year. With next week having the highest historical probability for a rally, a more ‘dovish’ than expected Fed could spark a bit of buying frenzy.
While we are expecting an oversold rally, remember after having reduced exposure in portfolios previously, and carrying a much heavier weighting in cash, we are giving the market time to figure out what it wants to do. Given the consolidation range over the last couple of months, it is too risky to be either overly short, or aggressively long, currently. Cash remains the best hedge currently.
But let me repeat the most important point:
‘The expected rally IS NOT the next version of the ‘bull market.’ Nor does a rally mean the ‘bear market’ is over. It will be a counter-trend rally to sell into.’”
This morning futures are pointing lower at the open after Europe’s rally fizzled follow extremely poor retail sales data.
The dollar’s gains over the past three months have spurred hedge funds to cut bullish bets to the lowest since June. Leveraged funds trimmed positions wagering on gains in the greenback by the most since September, according to the latest data from the U.S. CFTC based on eight currency pairs
Donald Trump won’t be sitting down with Special Counsel Robert Mueller to answer more questions in his investigation into election interference, Rudy Giuliani, the president’s attorney, vowed on Sunday
U.K. Prime Minister Theresa May will attack supporters of a second Brexit referendum on Monday as she explains to Parliament why European Union leaders rebuffed her attempt to make her divorce deal more attractive to lawmakers
Australia is on track to return to the black for the first time since the global financial crisis, almost doubling the size of its projected surplus in fiscal 2020, according to projections from the Treasury
The Italian government will trim its deficit target for next year in its latest proposal that seeks to avoid EU sanctions for violating the bloc’s budget rules, the Ansa news agency reported
The toll Brexit is taking on the U.K. housing market was laid bare in surveys published Monday
December 14, 2018
Another disappointing rally attempt yesterday which started out to the upside once again, but failed.
While the market did close “flattish” for the day, the price action this entire week has been dismal. As shown, every day has been sold off after the open.
The failure of the market to maintain a rally is not a good sign, however, with mutual fund distributions now behind us for the year, next week provides the best opportunity for a rally as portfolio managers need to rebalance their holdings for the end of year reporting period.
Nonetheless, our trade is simply not working at this point. Stops remain tight while we are still looking for a rally into the Fed meeting next week.
Economic data continues to come in weak, not only domestically, but globally as China reported weak economic data this morning. Retail sales were not exciting at the headline, but core sells were up 0.9% for the month which was not surprising given we are in the Christmas holiday shopping season. Overall, retail sales have been disappointing for so far and suggests the consumer is slowing down.
This morning looks to open weak with futures down -22.00 on the S&P 500.
Let’s see if buyers show up after the open.
December 13, 2018
It was a disappointing rally yesterday which started out strongly to the upside with a more than 40-point advance on the S&P 500 to only end up 14-points by the end of the day.
It continues to be a struggle for the market to find footing as each step forward (positive news on trade) is offset by another shock from the White House (immunity given to publisher of National Enquirer.)
Yesterday, was an exact clone of both Monday and Tuesday of this week and the failure to maintain an advance in the market is becoming markedly more concerning particular as we continue to “eat up” the oversold condition that previously existed.
Futures are higher again this morning with the S&P up +10.25, however, Oil is fading back to 50.61/barrel.
Interest rates bounced up a bit yesterday from an extremely overbought condition, look to add to fixed income holdings if rates approach 3% on the expected rally in the market.
This morning the economic data continues to worsen suggesting a much weaker economic environment:
Export Prices: -0.9%
Export Prices Ex-Ag: -1.0%
Import Prices: -1.6%
Import Prices Ex-Oil: -0.3%
(These data points, as we have stated previously, continue to show there is no real “risk” of inflation. This puts the Fed in a much tighter spot on continuing to hike rates into 2019.)
Stops remain tight on our trading position in IVV.
Let’s see how the day goes.
December 12, 2018
As noted in yesterday’s update:
“We added 5% of IVV as a trade at 267.32 per share. I will update the model portfolios later today.”
Yesterday, the market opened up about 30 points. We waited for the mid-day fade to add our trading position, however, we were a bit early as White House antics drug the market into negative territory late yesterday. Fortunately, the market recovered back above our stop-loss level of 2633 before the close.
Today, the market looks to open higher as news of progress with China on trade hit the wires last night. Also, President Trump also stated he could intervene into the Huawei case if needed to keep “trade talks” moving forward.
Given that President Trump has staked his entire record of success as a President on the direction of the stock market, it is not surprising to see him react to the market in terms of policy. This is not the way to successfully govern, but for now it helps our trading positions so we will take it.
Of course, this is an exact clone of yesterday’s open so we need to see it maintain during the day.
We are moving our stops down to yesterday’s lows of 2620 (on a closing basis) for now, but will begin raising stops if the expected rally forms. Target is 2730-2740.
December 11, 2018
**UPDATE 1: We added 5% of IVV as a trade at 267.32 per share. I will update the model portfolios later today.
Yesterday, the market did indeed break the “neckline” and successfully tested the 2018 lows. However, since the market rallied back, and closed, above that support level the “break”is not valid. This keeps the current consolidation range intact for now.
With the market very oversold, a reflexive rally is likely over the next few days.
We are looking to add a “trade” to portfolios for a potential rally back towards the 2750 level by Christmas. We will maintain a tight stop at 2633 for now. If the trade works we will move the stop up daily.
December 10, 2018
As I noted on Friday, be sure and read this week’s market report as I cover the short, intermediate, and long-term technicals.
This morning, futures are pointing lower suggesting a break of the neckline as I laid out previously.
With the market very oversold on a short-term basis, and sentiment much more negative, don’t make any hasty decisions today. What will matter is where we finish the week.
If the market finishes the week BELOW the neckline, then look for a failed rally back to the neckline to institute “short market” positions.
If the market finishes the week ABOVE the neckline, then the break will be negated and we are back within the consolidation band looking for a resolution.
As I noted on Friday, a rally is highly likely. We continue to suggest using any rally to reduce risk and rebalance accordingly.
December 8, 2018
Be sure and read this week’s market report as I cover the short, intermediate, and long-term technicals. A couple of important notes, however.
The market is testing the important neckline support of the current “head and shoulders” formation as noted earlier this week.
The market is very oversold on a short-term basis and sentiment has gotten much more negative. The market is looking for ANY good news to rally on which could come over the next two weeks for various Fed officials dropping “trial balloons” before the December 18-19 meeting.
Given President Trump has staked his entire Presidency on the “market” as a measure of his “success or failure,” look for tweets, comments, or actions which will be lofted out there to try and support the markets.
As noted, with the market very oversold, a rally is highly likely. Use any rally to reduce risk and rebalance accordingly. Being overweight cash remains the optimal hedge in an uncertain market.
REMINDER!
RIA PRO Model Changes
The current RIA PRO portfolios were built during the BETA Testing phase of our development. As such, the portfolios are CAPITAL APPRECIATION only and do not reflect the interest income from the bond holdings or the dividends from the equity holdings.
Starting in January, we will discontinue the three current portfolios and will swap to 3-portfolios tied to live accounts which gives you three important advantages:
Trades will be able to reported “real time” instead of a 3-day delay.
Interest and dividends will be credited the the portfolios on a monthly basis
Total returns, including all costs, will be reported.
We apologize for any inconvenience but we feel this will be a much better way to align the RIA PRO models to actual results for tracking purposes. We will keep you apprised of progress over the next month before we make the final changes.
Thank you.
December 6, 2018
Comments Wednesday morning from the Chinese that progress was indeed made on a trade truce at the G-20 meeting, had futures rallying very mildly. Unfortunately, the markets were closed for President Bush’s funeral. There was hope of some carry through into today until news broke last night of the arrest of Chinese national in Vancouver.
Ms. Meng Wanzhou , the CFO of Shenzhen-based Huawei, the world’s second-largest maker of telecommunications equipment, was arrested in Vancouver on December 1. She is sought for extradition by the United States for an attempted sell of embargoed Hewlett-Packard equipment to Iran’s mobile-phone operator. A bail hearing has been set for Friday for violation of U.S. sanctions against Iran.
To understand the magnitude of the arrest, just imagine if China had just arrested the child of Tim Cook or Jeff Bezos.
Importantly, Chinese officials stated this morning:
“The Chinese side firmly opposes and strongly protests over such kind of actions which seriously harmed the human rights of the victim. The Chinese side has lodged stern representations with the US and Canadian side, and urged them to immediately correct the wrongdoing and restore the personal freedom of Ms. Meng Wanzhou.
We will closely follow the development of the issue and take all measures to resolutely protect the legitimate rights and interests of Chinese citizens.“
With that also went any hope of a “trade truce” or “trade negotiations” which is a fight President Trump continues to lose, and can’t win, with China.
As such, futures are down sharply this morning and the markets are threatening to break critical support levels. As I discussed yesterday:
“Most importantly, the most recent failure at key resistance levels has set the market up to complete the formation of a ‘head and shoulder’ process. This is a topping pattern that would suggest substantially lower asset prices going into 2019 ‘IF,’ and this is a key point, ‘IF’ it completes by breaking the lower ‘neckline.'”
The neckline currently resides at 2630ish and support of the closing October lows at 2640. A confirmed break of those levels will suggest a further decline in the market of the same distance as the previous decline, which in this case, would equate to roughly 300 points of downside.
We will continue holding higher levels of cash and fixed income and any confirmed break will increase our cash holdings considerably.
December 5, 2018
The “sell off” yesterday was much different than what we have seen previously. As I noted in recent missives, during the previous declines volatility, bond prices, and gold didn’t confirm any “panic” in the market. Yesterday, that changed as 10-year Treasury bond yields plunged below 3% as money sought the safety of Treasuries.
As I noted in yesterday’s Technical Update, which was posted before the opening bell:
“We did add some equity exposure to portfolios on Friday, but are still holding a higher level of cash than normal. As shown below, the 61.8% Fibonacci retracement level, and the 2016 bullish trend line, have remained formidable adversaries to the previous rally attempts. However, if the lower “sell signal” is reversed, such would likely coincide with a breakout above resistance and confirm a new uptrend is underway.”
“IMPORTANT: It is the success or failure of this rally attempt will dictate what happens next.
If themarket remains above the 50-dma AND breaks above resistance at 2820, then another attempt at all time highs is likely. (Probability Guess =40%)
However, if this rally fails such will result in a continuation of the correction back to recent lows. (Probability Guess = 60%)
So, why did I give Option #2 a greater weighting?
This is because, despite the recent oversold surge from lows, the primary backdrop of the markets has not changed markedly.
The “trade truce” was nothing more than that. China is not going to back off its position on “Technology Transfers” as that is the key to their long-term economic future. This means that either Trump caves into China or we will be back to a full on “trade war” in 2019.
The Federal Reserve is still reducing their balance sheet by $50 billion per month which has removed a primary buyer of U.S. Treasuries at a time when the Government has gone on an unfettered spending spree.
With the Democrats in control of the House, there will likely be “no” constructive legislative action to note in the next year. However, there is almost an absolute guarantee of more anti-Trump actions being lofted from the “Pelosi House.”
Valuation remains extremely elevated despite the recent correction.
Most importantly, year-over-year earnings growth rates are set to deteriorate markedly in 2019 as both the effect of the 2018-tax cuts vanishes and end-of-year estimates still remain way too high.
The deterioration in credit is accelerating
Economic growth has likely peaked.”
Most importantly, the most recent failure at key resistance levels has set the market up to complete the formation of a “head and shoulder” process. This is a topping pattern that would suggest substantially lower asset prices going into 2019 “IF,” and this is a key point, “IF” it completes by breaking the lower “neckline.”
For now, we are going to continue holding higher levels of cash and allow our fixed income holdings to pick up the slack.
December 2, 2018
After Fed Powell’s reversal on rate policy last week, the market finally got the catalyst for a bounce. On Friday morning, we anticipated the Trump would also soften his “hardline” stance on China which occurred over the weekend as Trump agreed to a “truce” with China for another 90-days. While this “truce” doesn’t change anything at all with respect to “tariffs,” or China, it does remove a short-term headwind which will allow the bulls to rally the market into the end of the year.
The sell-off in October and November violated many of our stop levels which led to a larger cash position than we would like heading into the end of the year. Friday morning we added some equity back into portfolios by starting with 1/2 positions in:
AEP – AMER ELECTRIC POWER
AXP – AMERICAN EXPRESS CO
CMCSA – COMCAST CORP A
MDLZ – MONDELEZ INTL
MDT – MEDTRONIC
MMM – 3M CO
CHCT – COMMUNITY HEALTHCARE TRUST
CDW – CDW CORP
We will also be rebalancing our current holdings and reviewing positions we were stopped out of for re-entry.
With the markets retesting the 200-dma, we are not supremely confident we are out of the woods just yet and the main issues plaguing the markets over the last couple of months have not been resolved – namely, the Fed reducing their balance sheet.
This is why we are scaling into equities with 1/2 positions which we will add to as things improve but offer little risk currently if the market breaks down.
RIA PRO Model Changes
The current RIA PRO portfolios were built during the BETA Testing phase of our development. As such, the portfolios are CAPITAL APPRECIATION only and do not reflect the interest income from the bond holdings or the dividends from the equity holdings.
Starting in January, we will discontinue the three current portfolios and will swap to 3-portfolios tied to live accounts which gives you three important advantages:
Trades will be able to reported “real time” instead of a 3-day delay.
Interest and dividends will be credited the the portfolios on a monthly basis
Total returns, including all costs, will be reported.
We apologize for any inconvenience but we feel this will be a much better way to align the RIA PRO models to actual results for tracking purposes. We will keep you apprised of progress over the next month before we make the final changes.
Thank you.
November 21, 2018
As noted in today’s commentary section, we were stopped out of multiple positions yesterday which also provided the opportunity to do so tax-loss harvesting in portfolios for year-end.
Currently, the market is oversold and is set up for a short-term bounce. In the next few days, we will look to add a trading position to portfolios for a potential year-end rally. As we have stated previously, we are moving into the “seasonally strong” period of the year combined with a post-midterm election period which have historically equated to a positive push in the market.
However, nothing is guaranteed so the recent changes to portfolios to raise cash, shore up risk, shorten-durations, and increase credit quality all remain prudent actions.
Most importantly, while the market will indeed garner a rally over the next couple of months, such will not change the fact that we are in the midst of a substantially more important topping process. The chart below lays out the potential range for a bounce before a continuation of the current decline ensues.
November 20, 2018
This morning, the market opened lower triggering stops all across the portfolio pushing sells of:
MSFT
AAPL
MU
BA
NVDA
UTX
WMT
NKE
EW
TGT
HRL
V
XLY
I will update the portfolios once the trades settle for our clients and I have final execution values for each position.
The market is EXTREMELY OVESOLD on a short-term basis and will likely bounce tomorrow or early next week. We will be using that bounce to potentially lift further positions and add further hedges to portfolios.
The breakdown this morning confirms we have most likely started a bear market and a retest of the April lows at 2575 is highly likely. Also, watch the reversion in oil prices, interest rates, and a potential spike in the VIX to confirm the breakdown.
The recent addition of Treasury bond positions and rebalancing of risk in the bond side of the portfolio has continued to mitigate risk in the short-term.
We will look to rebuild equity holdings after the market stabilizes.
November 14, 2018
As I noted in this weekend’s newsletter, the daily, weekly, and monthly charts have now all registered “sell” signals. However, as I stated:
“I want to caution you that by the time longer-term sell signals are issued, the market tends to be more extremely oversold and due for a reflexive bounce.”
This is currently the case, with many of our short-term indicators very oversold. However, on a bounce that fails to get above the 200-dma we will look to raise some additional cash and continue to rebalance risk in portfolios.
This past week, we made some changes to the Fixed Income side of the portfolio to shorter overall duration and increase credit quality:
REDUCED:
SPDR Barclay’s Investment Grade Floating Rate Fund (FLRN)
Invesco Ultra-Short Duration Bond (GSY)
ADDED:
I-Shares Treasury Floating Rate Bond (TFLO)
I-Shares 1-3 Year Treasury Bond (SHY)
We have been repeatedly warning about the risk to investment-grade and corporate bond funds when the next recession comes. More importantly, during the reversion process, money will seek out the safest of investments which will be U.S. Treasuries.
These initial moves on the bond side of the equation was to shore up both current duration risk and credit-quality. The next move will be to add a significant chuck of 10-year Treasury exposure to the portfolio on confirmation the bear market has indeed started.
On the equity side of the portfolios we have also made some changes:
Last week we sold in the ETF and Equity-ETF Models
Technology Select Sector SPDR (XLK)
Sometimes Lessons Must Be Relearned
My mistake last week was NOT selling Nvidia (NVDA) as I had planned.
I very much like the company as they are on the cutting-edge of the chips and video-cards required for everything from video-game graphics to virtual reality.
The price appeared to be making a short-term bottom and looked as if most of the “bad news” from the inventory build in processors had been built into the stock price. I opted to wait for their earnings announcement.
That was a mistake.
While the “bitcoin mining” bust was apparent, the negative revisions to their estimates and revenues was larger than I anticipated. The stock was down sharply on Friday violating our absolute stop-loss on the position.
It will be sold next week.
And the lesson I relearned painfully this past week was to “sell losers short.”
Apple (AAPL) and Micron (MU) are also on the “Naughty” list.
November 8, 2018
Now that we have cleared the mid-term elections, we are looking for the market to firm support back above the important longer-term support line as shown below.
Yesterday, the market was able to push above both previous support and the longer-term moving average which is bullish.
However, this is a WEEKLY chart, so the only thing that will matter with respect to this analysis is where we end the week.
If the market pulls back to support, holds, and turns up then we will be able to add some trading opportunities to the portfolio. After recent sells we have cash available to add some exposure as needed.
If the market fails to hold support, then we are likely going to see a retest of recent lows and the additional cash we have currently will hedge downside risk.
With the market on a more severe weekly sell signal, don’t be overly aggressive at this juncture. Much of the oversold condition that was generated during the recent decline has been erased and the market is back to more extreme overbought conditions on a short-term basis.
In Tuesday’s technical commentary, “A Sellable Rally,” we discussed the potential for a rally that had some follow through and would potentially push the markets back to overhead resistance. The rally ran right into previous support, now resistance, and failed.
With that failure, we have executed “sells” within our portfolios.
Equity and Equity/ETF Portfolios:
Selling KLAC, JPM, HD, and SU
ETF Portfolio
Selling XLF
As is our discipline, we look to sell positions that have not been performing as expected. The sells will increase our cash balance for now and give us opportunity react to other opportunities that become available.
It is to soon to tell if the recent October decline is just another “buy the dip” opportunity, as is currently believed by a vast majority of Wall Street and the mainstream media, or is this the beginning of a deeper correction to come.
We don’t know. As such this is why we are raising cash until the market determines what it is going to do next. If the market begins to resume its bull market trajectory we will add exposure back to portfolios. If not, the additional cash will hedge risk while we make further adjustments.
Allocation Gauges and Portfolio Models will be updated over the weekend once the weekly data and final settlement data becomes available.
October 31, 2018
The market finally mustered a bounce to close out a brutal month of October which saw almost exactly the same percentage decline as February of this year. However, the main difference between the two declines is that previously the 200-dma acted as support for the market. Now, the 200-dma is applying resistance to market rallies back to the 2750-2760 area.
The good news is the market did bounce and is pushing up into previous resistance levels. Furthermore, there is a potential for a “buy signal” from currently still oversold conditions. Both of these indications SHOULD theoretically provide some lift to the markets over the next couple of weeks.
However, we suggest not being complacent about this rally as the technical backdrop has changed to more bearish with the break of the running trend line from the 2016 lows.
As we have been discussing, we will continue to use these rallies to:
Rebalance portfolio risks,
Reduce/remove positions that aren’t working at better prices, and;
Re-evaluate remaining positions for additions or reductions.
We are looking to raise roughly 20% cash for the time being to hedge portfolios UNTIL such time as a more bullish backdrop emerges.
“With the market exceeding 3-standard deviations below the 50-dma currently, the extreme oversold condition still sets the market up for a fairly strong bounce. That bounce SHOULD be sold into.”
On any bounce next week we will continue to sell positions and raise cash to 25-30% of the portfolios in total.
For now, the market has changed from “buying dips” to “selling rallies” which we will honor until such time that the bull market reasserts itself.
October 26, 2018
Sold VO and IJR in the ETF and Equity/ETF models yesterday.
The failure to get “follow through days” on rallies is troubling to say the least. While this mornings opening is set to be very weak, I would not be surprised to see some buying later on this morning and into the afternoon.
With the markets DEEPLY oversold on both a short and intermediate-term basis, we are looking for a rally to 2750 on the S&P 500 to raise cash levels in all models to 25-30%.
October 23, 2018
With the market confirming a break of weekly support and failing at the recent retest of the 2016 bullish trend line, we are now on alert to use any rally back towards 2740-2750 to liquidate or reduce positions in our models.
This morning we sold RAVN at 42.93.
We will be selling on any bounce KLAC, MU, JPM, and HD.
The recent adds of NKE and FDX are dangerously close to being stopped out as well.
Overall, we are looking to reduce portfolio risk by 25-30% on a rally and raise some cash heading into the end of the year.
We have been trying to give the markets a bit of room given that it is October, a historically volatile month. Also, stock buybacks will return towards the end of the month and there will likely be some performance chasing heading into the year-end which could be supportive of higher asset prices in the near term.
We are trying to balance the current extreme oversold condition, which should provide a sellable rally, against the risk of a bigger short-term correction.
However, the bigger issue is that we may have witnessed a more important trend change that will be determined by the strength and magnitude of any reflexive rally this week.
October 13, 2018
Lot’s of analysis in this weekend’s missive on the market and what we expect to happen next.
Here is the checklist of actions we will be looking to take on any rally:
Re-evaluating overall portfolio exposures.It is highly likely that equity allocations have gotten out of tolerance from the original allocation models. We will also look to reduce overall allocation models from 60/40 to 50/50 or less.
Use rallies to raise cash as needed.(Cash is a risk-free portfolio hedge)
Review all positions(Sell losers/trim winners)
Look for opportunities in other markets(Gold may finally shine)
Add hedges to portfolios (If the market begins to show a negative trend we will add short positions)
Trade opportunistically (There are always rotations that can be taken advantage of)
Drastically tighten up stop losses. (We had previously given stop losses a bit of leeway as long as the bull market trend was intact. Such is no longer the case.)
If I am right, the conservative stance and hedges in portfolios will protect capital in the short-term. The reduced volatility allows for a logical approach to further adjustments as the correction becomes more apparent. (The goal is not to be forced into a “panic selling” situation.)
If I am wrong, and the bull market resumes, we simply remove hedges, and reallocate equity exposure.
“There is little risk, in managing risk.”
The end of bull markets can only be verified well after the fact, but therein lies the biggest problem. Waiting for verification requires a greater destruction of capital than we are willing to endure.
“It’s probably wiser to assume [that God] exists because infinite damnation is much worse than a finite cost.” – Blaise Pascal
October 12, 2018
We have been closely watching this rout and, as noted, have several stop loss violations on various positions. While fundamentally these companies are very sound, the technical price action just isn’t strong enough to warrant the related opportunity cost.
As with all stop-loss violations, by the time the stop is triggered the position is typically already deeply oversold. Therefore, selling the immediate stop violation tends to result in an apparent “whip saw” as the stock bounces before resuming its decline. This is also the case is there is secondary near-term support for the position as well.
Therefore, we will be using this oversold bounce in the market, as noted in our daily commentary today, to lift positions which are under-performing and have broken down technically.
It is unlikely the current rout is over and we will very likely have a retest of recent lows before the next bottom is found. Having some cash on hand will both hedge portfolio risk and provide opportunity to reallocate to equity when the selling pressure is resolved.
October 5, 2018
As noted previously, KLAC, MU, and SU had triggered sell alerts. While we very much like the fundamentals of these companies, the technical backdrop remains challenging. We have moved stops up to recent support levels and it is highly likely we will be stopped out of several positions if the sell-off that started yesterday continues.
Other stocks also threatening stop loss supports are HD, FDX, NKE, PEP, COST, TGT, EW, PG, and RAVN.
There are a couple of important points to understand from this deterioration in the markets. The recent rise in rates is beginning to significantly impact the stocks most impacted by consumer spending. Should rates remain at current levels, or more higher, the impact to economic growth will be noticeable as we move further into Q4.
Secondly, we are trying to give these companies a bit of room here as October tends to be a volatile month but moving into the last two months of the year we would expect to see a bit of a “chase” for performance. This doesn’t mean we are “betting on it,” but rather it is a seasonal tendency and we don’t want to be too underweight equities moving into it.
We are definitely on “high alert” currently, particularly with rates rising, and will take action quickly if needed to protect capital.
September 15, 2018
In the last update we noted that we would be adding exposure to portfolios provide the market held its previous breakout levels. It did, and on September 11th we added seven new holdings the Equity and Equity/ETF portfolios.
The additions of JNJ, CVS, NKE, WMT, DUK, PEP, and FDX bring our portfolios up to almost full weightings as we head into the expected end of year rally. We particularly like FDX for the increase in seasonal year-end activity with Thanksgiving and Christmas “binge” shopping just around the corner.
While NKE has been in a bit of a media war over recent messaging, the fundamentals of the company remain sold and we used the pullback in price to long-term trend support to add the position to the portfolio. Like TGT, which had a similar media-driven push back due to their stance on bathrooms, the public has a short memory and fundamentals rule out over time.
KLAC, MU, and SU are all on SELL ALERTS with stop-loss levels being flirted with. We are trying to give MU and KLAC some room here as the fundamentals of these companies are very strong and valuations are cheap. However, our investment discipline and strategy requires us to act when necessary so both of these positions are on very short leashes.
SU will likely be sold on a break of support or a rally back to previous highs. The energy sector remains challenging and oil prices are at risk potentially as we move into winter. While we like the company fundamentally, it simply hasn’t performed as expected so “opportunity cost” is something we are highly aware of. If we find a better candidate, we will likely execute a swap sooner rather than later.
September 9, 2018
After a rough week for semiconductors, following several reports of slowing DRAM prices, both Micron (MU) and KLA Tencor (KLAC) are very close to triggering stop loss levels. (Read “It’s Make Or Break” for the signal semi’s are potentially sending about the broader market.)
Next week, the market will either hold support and allow us to add new holdings (which will be reported here AFTER we buy them for client accounts) OR the market will start pushing back towards three levels of lower support at 2850, 2825 and lastly 2800.
There are currently plenty of relative risks, think tariffs, which could push the market lower next week. So waiting for confirmation before adding further exposure will likely prove prudent. However, it is important to watch semiconductors as they are an economically sensitive sector and some of the messaging suggests the recent bump in economic growth may be ending.
While we like the fundamentals of KLAC and MU very much, technically they simply aren’t performing currently and a break of stop loss levels requires us to take action. Stay tuned.
August 26, 2018
On August 22nd, we were stopped out of three equity positions in our equity model portfolio.
Chevron (CVX) was sold at 119.26 / share
Constellation Brands (STZ) was sold at 203.12 / share
Eastman Chemical (EMN) was sold at 99.95 / share.
While we still very much like the fundamentals of these businesses, they all violated our stop levels. We waited for an oversold bounce to “sell into” which was provided last week.
We are looking to add 5-6 new equity positions over the next couple of weeks IF the breakout to new highs can hold. As noted in this past weekend’s missive:
“Over the past two weeks, the market did pull back to support at 2800 and subsequently broke out to new highs on Friday. With that, we will look to add equity exposure opportunistically over the next couple of weeks in accordance with the model allocations.”
Equity Model: We sold three laggards last week (CVX, STZ, & EMN) and will replace with new positions opportunistically.
Equity/ETF blended – Same as with the equity model.
ETF Model: We will overweight core “domestic” indices by adding a pure S&P 500 index ETF to offset lack of international exposure. We remain overweight outperforming sectors to offset underweights in underperforming sectors.
It is important to understand that when we add to our equity allocations, ALL purchases are initially “trades” that can, and will, be closed out quickly if they fail to work as anticipated. This is why we “step” into positions initially. Once a “trade” begins to work as anticipated, it is then brought to the appropriate portfolio weight and becomes a long-term investment. We will unwind these actions either by reducing, selling, or hedging, if the market environment changes for the worse.
“Likewise, while we upgraded the “buy signal” last week, we suggested waiting for a correction back to previous support before increasing allocations further.”
Today, the market is pulling back to support at 2800. A violation of 2800 will likely see a test of the cluster of moving averages which are spread between 2740 and 2780. With the market back to short-term oversold we have a few stocks on our watch list we are looking to add.
For now, the bullish trend of the market remains intact. However, given the seasonal weakness of August and September historically, we will be cautious in adding any exposure currently.
August 2, 2018
Overall, the bulk of the portfolio continues to perform as expected. We are closely monitoring Eastman Chemical (EMN) and Constellation Brands (STZ) which have not performed as expected. We currently have stop losses in place which are close to being triggered. Fundamentally, we still like the companies, but the technical risk is rising.
Portfolio Management Rule: Cut losers short, let winners run.
July 13, 2018
Added four new holdings to the portfolio
Buying
SU – Suncor Energy
NSC – Norfolk Southern
UTX – United Technologies
RAVN – Raven Industries.
May 12, 2018
In the RIA Portfolio you will find 6-tabs above the portfolio itself
Open Positions – positions currently open
Closed Positions – positions that have been sold.
Transactions – a complete listing of all transactions in the portfolio (buys and sells)
Fundamentals – a listing of our fundamental measures of each position
Buy/Sell/Hold – a listing of the technical measures of each position
Research – you will find PDF’s of a full REPORT and a one-page SNAPSHOT of each currently open position.
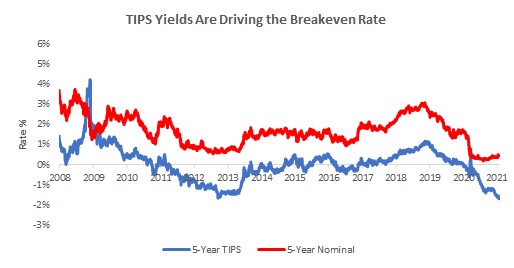
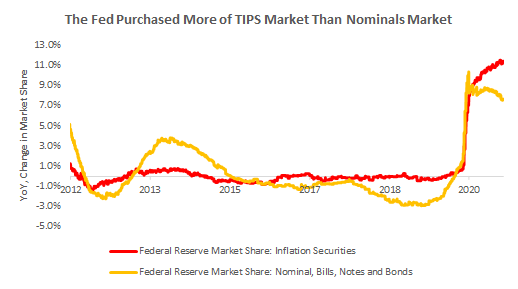
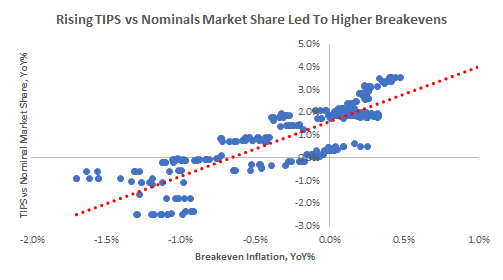


 Late on Friday it was reported April revolving credit for April fell -$55.7 billion, a record decline at -5.4% month over month. That follows a $29.7 billion decline in March. The combination of $1200 CARES Act checks and sharp spending declines are driving this unprecedented drop in revolving consumer debt, such as credit cards and home equity loans.


 The good news is that the latest data from the TSA shows that air travel is slowly improving. The bad news is that air travel is still well below 90% of normal.


 Today’s Chart of the Day, courtesy of Axios, shows that consumer confidence is greater for older people than younger people and to an extent not seen in at least 40 years. Axios attributes the anomaly to the different debt and asset profiles of the two generations. We add that the graph may also help partially explain the younger generation’s rising interest in socialism and populism. The following section is from the Axios link.


 The last two daily Fed’s repo operations were oversubscribed with larger amounts being transacted than the prior few weeks. This bears watching to see if the Fed’s removal of the extra liquidity they provided over the turn of the year is starting to cause problems.


 We elaborate further on labor costs and profit margins in Today’s Chart of the Day, courtesy of John Hussman. His graph shows that profits margins are very well correlated to the ratio of labor costs to prices (GDP price deflator). As labor costs rise faster than general prices, corporate profit margins tend to decline. Simply, labor costs are rising faster than corporations ability to pass on higher prices to consumers.


 Yesterday, the market ran into the 200-dma. As I noted in this past weekend’s missive, another test of the 200-dma was likely. However, what is important is whether the market can close solidly above the 200-dma by Friday’s close.