


Wednesday’s 10-year Treasury auction was met with solid demand. More interestingly, the demand is not coming from the Fed’s 25 primary dealers. The number of bids in the auction outweighed the number of bonds being auctioned by 2.66x. The six-month average is 2.39x. Further, the yield on the auctioned bonds was 3bps below where the bond was trading before the auction.
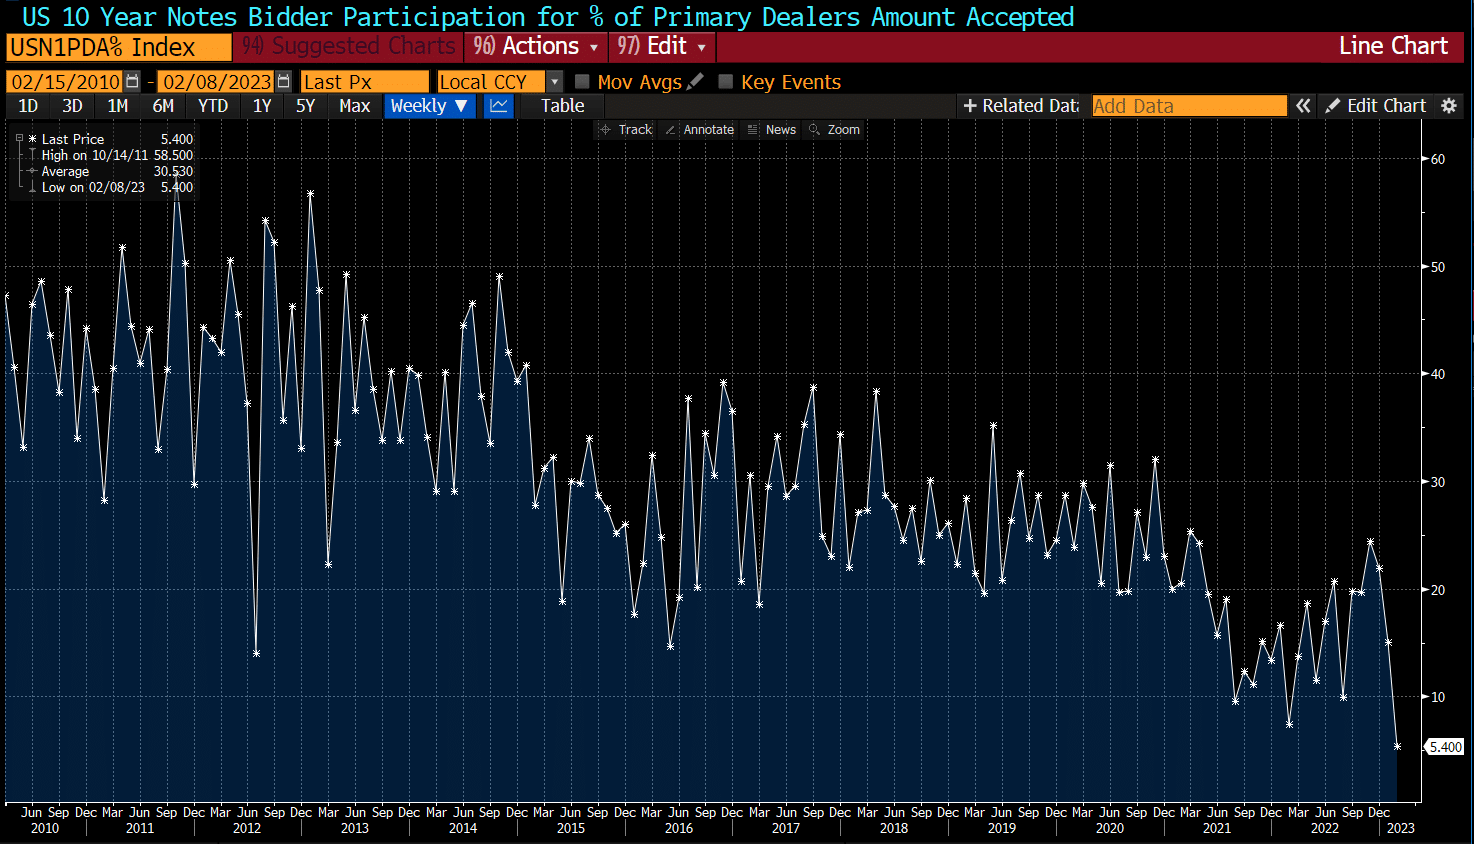
The most intriguing statistic from the auction was that the primary dealers (Wall Street banks and brokers) only took 5.36% of the bonds. Such a percentage is the smallest share of 10-year Treasury notes on record. The graph below shows how low that percentage compares to the last 12 years of auctions. The low share indicates that institutional and individual investors are outbidding Wall Street. Also, indirect bidders won 79.45% of the auction. Indirect bidders are most frequently international buyers. End investors, many of which are foreign investors, clearly see value in 10-year Treasury notes at 3.60%.
What To Watch Today
Economy
- 10:00 a.m. ET: University of Michigan Sentiment, February Preliminary (65.0 expected, 64.9 prior)
- 2:00 p.m. ET: Monthly Budget Statement, January (-$55.0 billion, -$85.0 billion)
Earnings

Has The Short-Term Market Correction Begun?
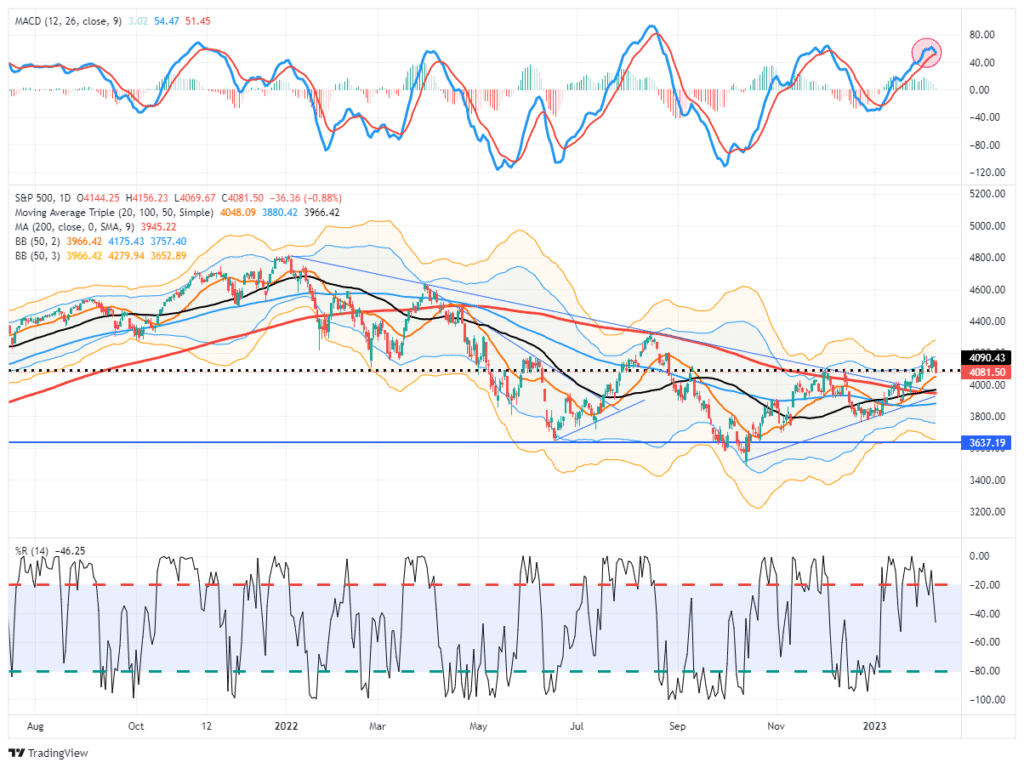
As we have noted over the last week, the market had gotten very extended from its 50-DMA, and a correction was needed to retest the recent breakout. A successful retest of those breakout levels would confirm the breakout’s validity and establish a higher bullish trend. A failure would suggest the recent rally was indeed a “bear market” rally.
Notably, the MACD indicator (top panel) is very close to triggering a sell signal. If the market is down today, that signal will trigger. Such will suggest lower prices over the next couple of weeks to a month and puts a retest of the 50- and 200-DMA crossover as the first target. There is a tremendous amount of support between 3950 and 4000 which should hold, but as stated, failure will change the complexion of this rally back to bearish.
Take profits in stocks that had a big run as of late, and raise cash levels for the correction to come.
What’s The Smart Money Doing?
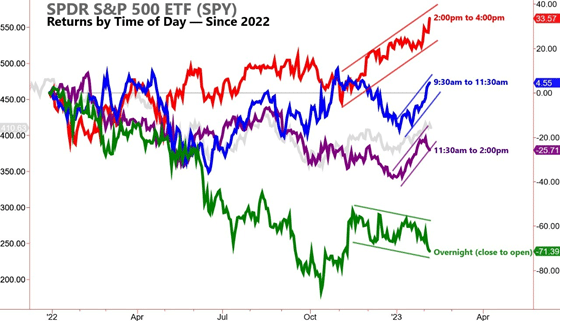
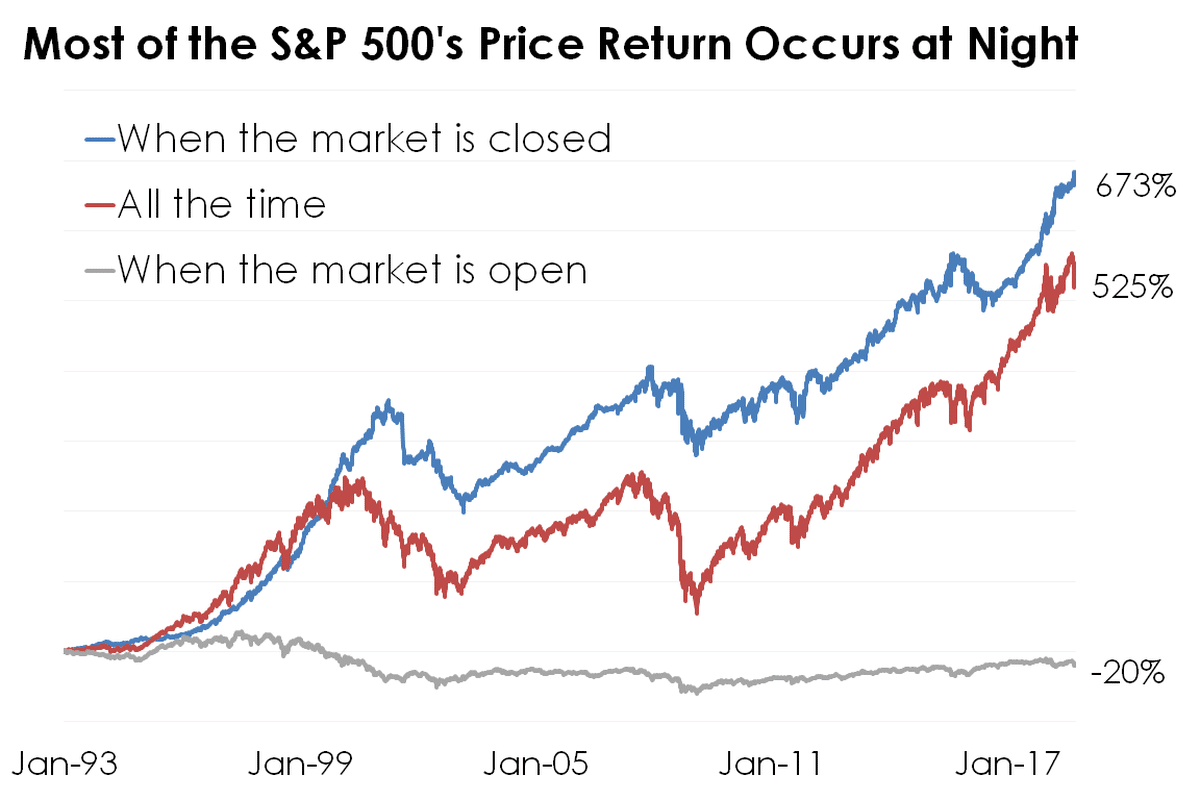
It is often said that the “smart money” buys toward the end of the trading day, and the “dumb money” buys at the open. The second graph below shows that the truly smart money buys when the market is closed (overnight futures sessions). The first graph below shows that trading patterns in 2022 and the beginning of 2023 favor those trading during the day, not overnight.
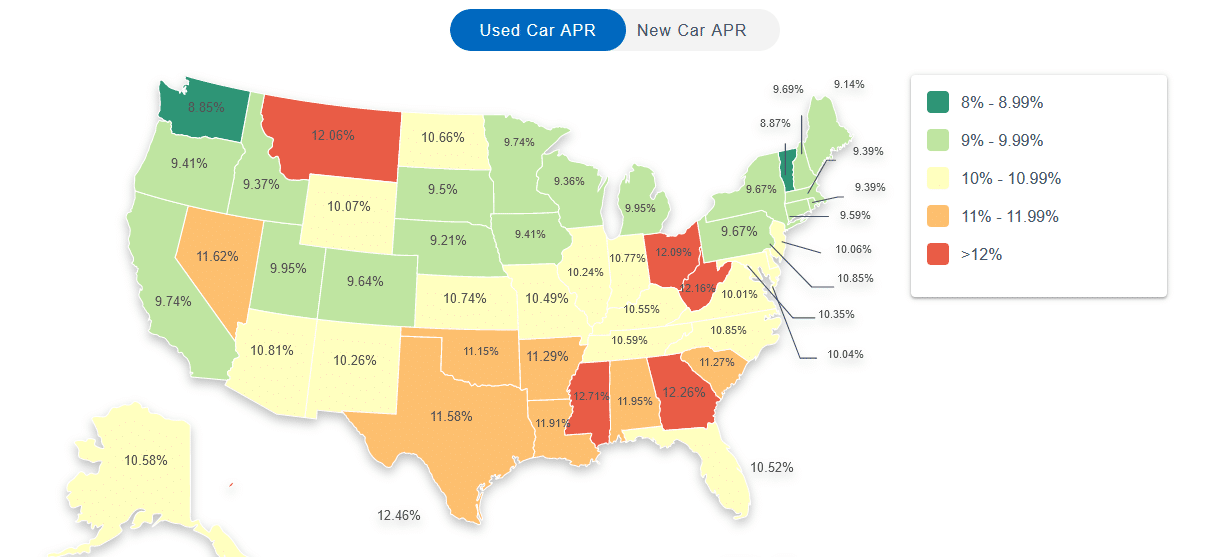
Auto Prices- Where Are They Going?
Much ado was made about the contribution of rising new and used auto prices to last year’s soaring inflation figures. With auto prices starting to ease and pandemic-related supply issues normalizing, it’s worth analyzing the auto market to help gauge where auto prices might be heading. Remember, new and used vehicle prices account for 9% of CPI and slightly less than 4% of the PCE price index.
The demand for new and used cars has been strong. However, rising interest rates for car loans are becoming a hindrance to buying new or used vehicles. The two maps below show used car loan APRs range from 9% to over 12%. New car loan rates range from 6-8%.

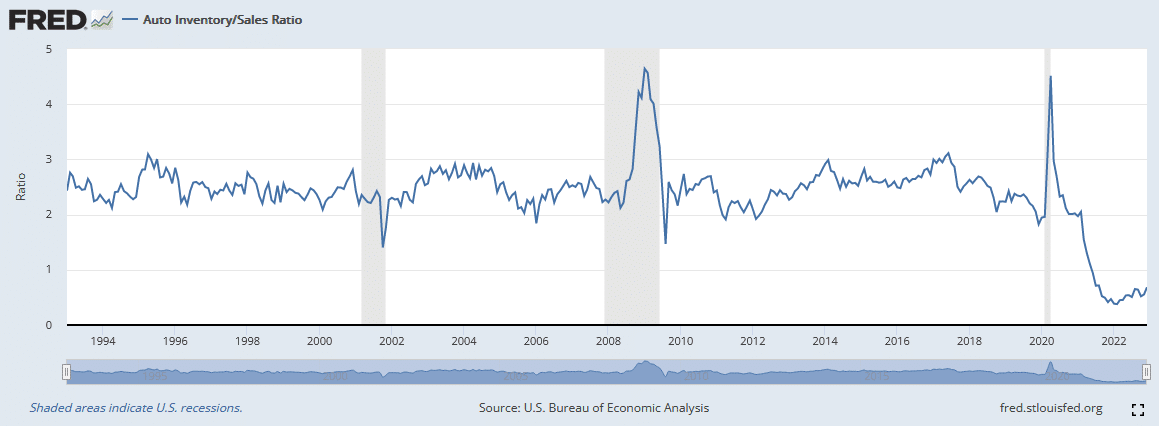
While higher interest rates will curtail demand, domestic auto inventories are still historically extremely low at 118k. Before covid, inventories averaged around 600k. As a result of low inventories, the ratio of auto inventories to sales, as shown below, is increasing but well below the levels of the last 25 years. The data argue that it may take a while for inventory to sales to normalize and, therefore, for prices to normalize, as shown in the second graph.


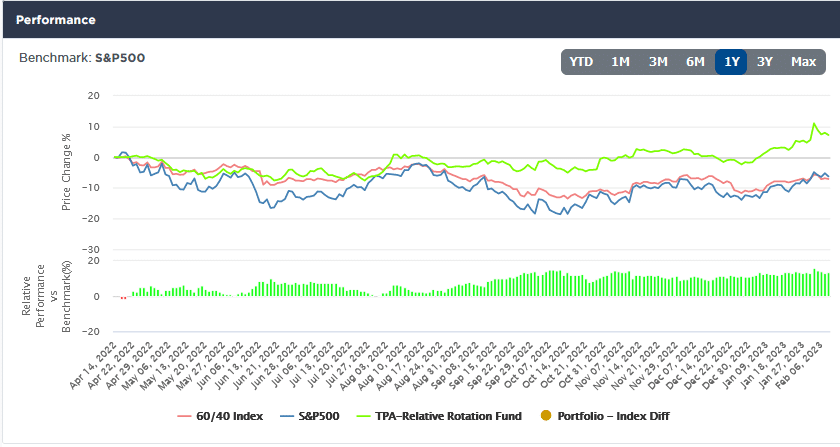
What to Buy and When
Turning Point Analytics (TPA) has provided SimpleVisor subscribers with its unique stock analysis for the last few years. Recently, TPA introduced Relative Rotation Graphs (RRG). RRG uses the combination of relative strength and momentum to isolate those stocks and sectors most likely to out or underperform. TPA uses the RRG data in its propriety algorithms to create a portfolio that has been consistently outperforming the market.

Investors cannot buy the Relative Rotation Fund, but they can receive the TPA-RRG Report every Monday. The report will:
- 1. Identify the Top 20 and Bottom 20 ranked stocks in the Russell 1000
- 2. Rank 27 sectors of the market
- 3. Provide commentary on the market, sectors, and top and bottom-ranked stocks
- 4. Show in RRG videos how stocks and sectors have moved in and out of favor
- 5. Provide scores and rankings for all stocks in the Russell 1000
CLICK HERE to learn more about how TPA and SimpleVisor can help you.
Tweet of the Day

Please subscribe to the daily commentary to receive these updates every morning before the opening bell.
If you found this blog useful, please send it to someone else, share it on social media, or contact us to set up a meeting.