


The S&P 493, which is the S&P 500 excluding the index’s 7 largest stocks, is up about 4% this year. Meanwhile, the S&P 7, also known as the magnificent 7, is up over 50%. The S&P 500 index, including the 7 and 493 stocks, is up 13% this year. The chart below, courtesy of @KobeissiLetter, shows the extreme divergence of returns. In hindsight, investment managers should have bought Apple, Microsoft, Amazon, Nvidia, Google, Tesla, and Meta and sold all other stocks and bonds. In reality, doing so ignores the basic tenets of money management and defies managers’ fiduciary responsibilities.
More importantly than worrying about what could have been, investment managers must now figure out if the trend will continue and, if so, how to best take advantage of it while adhering to their investment policy statements that govern their activities. In this regard, it’s important to remember the old disclaimer that past performance is no guarantee of future results. Asset and sector performance tends to rotate over time. What’s in vogue now will likely not be as popular tomorrow. Conversely, today’s shunned sectors and assets may be the most sought-after tomorrow. Watching the relationships of the 7 stocks versus the broader markets will help investment managers better manage whatever may lie ahead.

What To Watch Today
Earnings
Economy
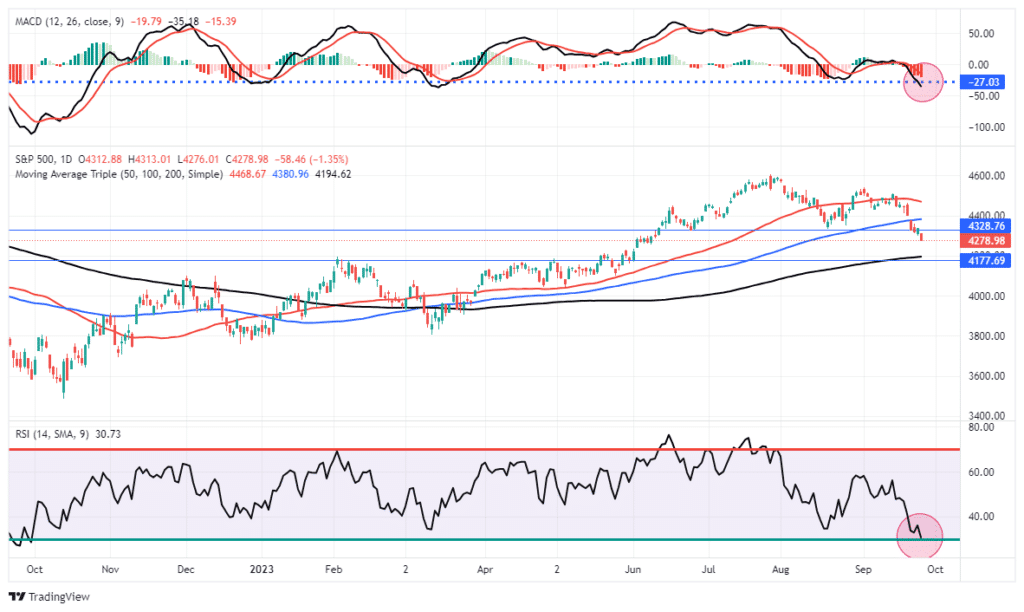
Market Trading Update
As discussed in yesterday’s BEFORE THE BELL video, the risk of a downside break of support would bring the 200-DMA into focus. This correction remains normal within a bull market for now and remains confined to the 3-10% range discussed in July. The market is deeply oversold, and as noted yesterday, this continues to be most likely an end-of-quarter impact due to the fiscal year-end of some fund managers. Also, a good bit of exposure was set to liquidate with the break of support, which showed up yesterday. Continue to expect some volatility and downside risk over the next couple of days, but a rally is likely as early as next week.

Consumers Expect To Tighten Their Belts
As goes excess savings goes discretionary spending. There are many measures that claim the excess savings built up from the pandemic have been exhausted or will be exhausted shortly. The second graph highlights that day may have already come for 80% of low and moderate-income households. With excess savings largely depleted and credit card debt up significantly, all the while wages are not keeping up with inflation, the average consumer will have to make tough spending choices. The table below, courtesy of Morgan Stanley, shows consumers expect to increase their consumption of essential non-discretionary items. Consequently, regarding the other discretionary items, consumers expect to reduce their spending.
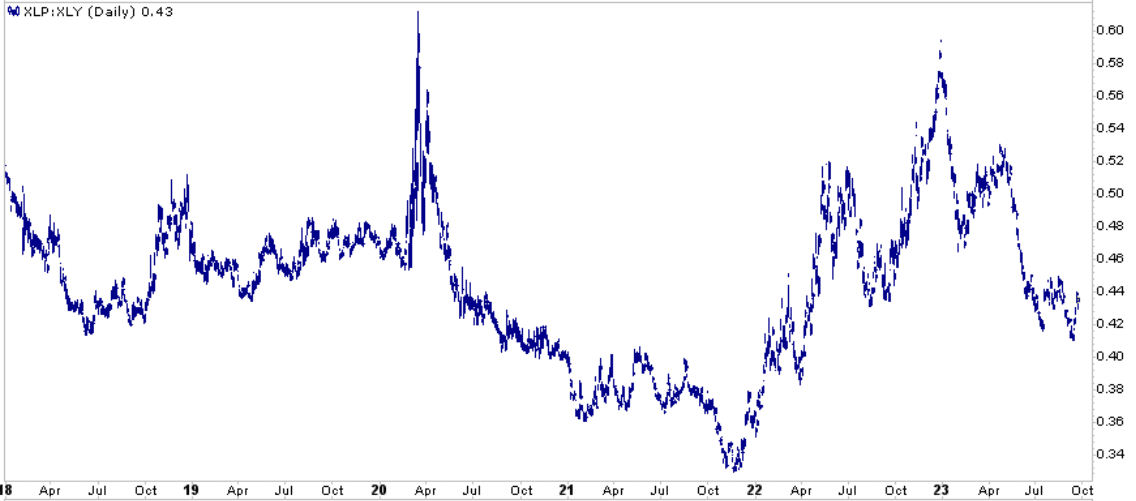
The third graph is the price ratio of consumer staples (XLP) to consumer discretionary (XLY). As it shows, staples have significantly underperformed discretionary since the start of the year. If the spending intention for the next six months proves accurate, staples may likely outperform discretionary stocks.


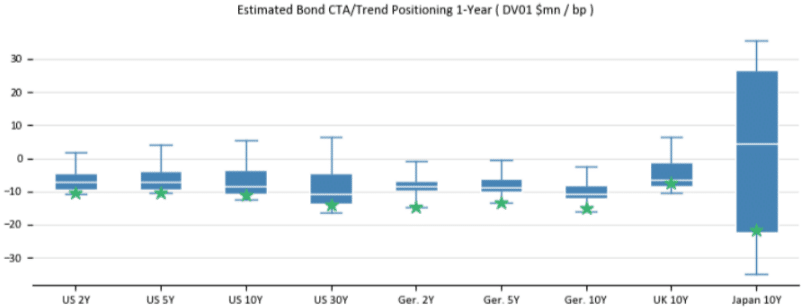
CTAs Will Need To Cover Bond Shorts
The graph below from Gamma Labs is very telling and provides a potential preview of a significant event in the global bond markets.
Commodity Trading Advisors (CTAs) are CFTC-registered firms that primarily use futures and options on commodities, stocks, and bonds. Most of the firms are short-term traders agnostic to being long or short in any position. They often rely on momentum-based proprietary models to direct their trading. Because they tend to follow momentum, CTA model signals often align, leaving many CTAs on the proverbial same side of the boat on a particular investment or investment theme. Consequently, if the market moves adversely to their collective positioning, CTAs must take action at the same. These events have been known to exaggerate already large moves further.
We bring this up because the graph below shows that CTAs are collectively extremely short global bonds. Given the recent poor momentum (lower prices/higher yields), such positioning follows their modus operi. The green stars highlight their current positioning, while the blue candles show the range and averages over the prior year. Gamma Labs writes:
CTA positioning in bonds almost everywhere at the ~0 percentile. Over the 1-week horizon, CTAs could pump $4.7B into U.S. bonds given an up tape, over one month 47B. The numbers for Germany are even more extreme (9.6B and 71B respectively). Important to keep in mind, given the incoming inflation data in the next few days.
Lower-than-expected inflation readings or other bullish bond news could cause a massive short covering in bonds. While CTAs will be happy to sit on their bond shorts or even add if yields continue higher, the potential for a rush of short covering is high.
Tweet of the Day

Please subscribe to the daily commentary to receive these updates every morning before the opening bell.
If you found this blog useful, please send it to someone else, share it on social media, or contact us to set up a meeting.
Post Views: 8
2023/09/27