


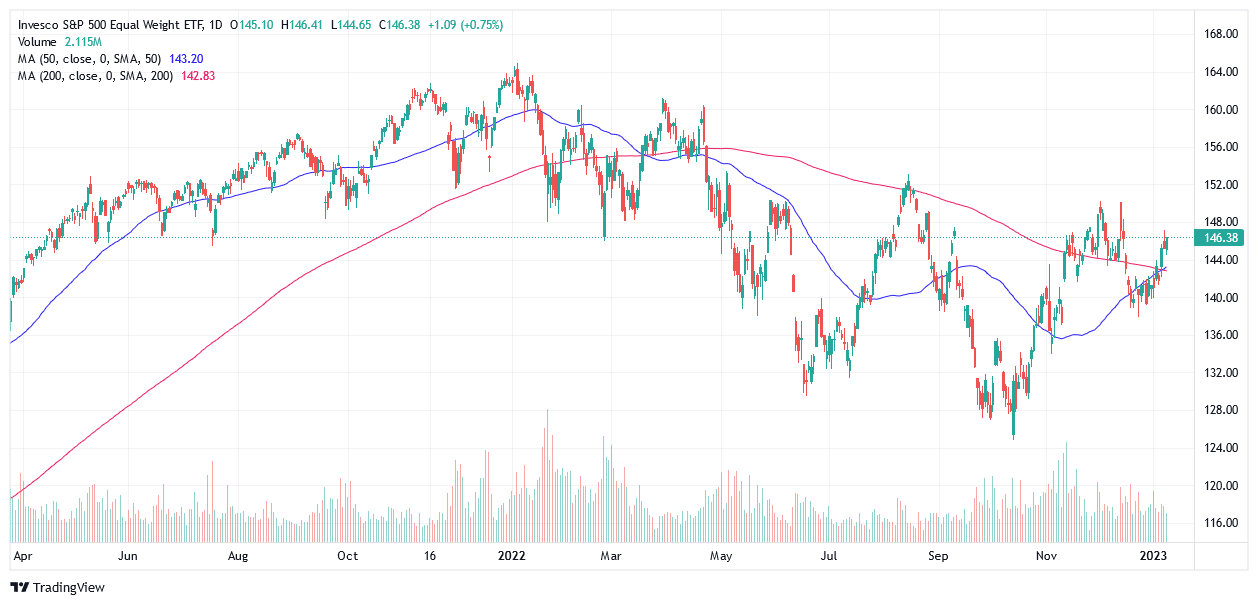
A golden cross occurs when a shorter moving average crosses above a longer moving average. Conversely, a death cross occurs when a shorter moving average falls below a longer moving average. The graph below shows the equal-weighted S&P 500 just experienced a golden cross with the key 50 and 200-day moving averages crossing. The equal-weighted index is not a primary, well-followed index. However, its recent golden cross is a positive sign that the broader market’s breadth is improving. In contrast, the 200- day moving average on the S&P 500 is still 100 points above its 50-day moving average. The S&P 500 must continue to rally for a while to see a golden cross.
Since 1970, the S&P 500 has been returning about 15% gains on average in less than a year after a golden cross’ occurrence. However, golden crosses can result in a false breakout and quickly turn into a death cross. Therefore, one should consider the golden cross pattern but use it alongside other technical indicators for the best results. Additionally, the golden cross may indeed portend a good rally in the coming month or two, but as we saw on three occasions in 2022, double-digit rallies were followed by lower lows.
What To Watch Today
Economy
- 8:30 a.m. ET: Consumer Price Index, month-over-month, December (0% expected, 0.1% prior)
- 8:30 a.m. ET: CPI Excluding Food and Energy, MoM, December (0.3% expected, 0.2% prior)
- 8:30 a.m. ET: Consumer Price Index, year-over-year, December (6.5% expected, 7.1% prior)
- 8:30 a.m. ET: CPI Excluding Food and Energy, YoY, December (5.7% expected, 6.0% prior)
- 8:30 a.m. ET: Real Average Hourly Earnings, year-over-year, December (-1.9% prior)
- 8:30 a.m. ET: Real Average Weekly Earnings, year-over-year, December (-3.0% prior)
- 8:30 a.m. ET: Initial Jobless Claims, week ended Jan. 7 (214,000 expected, 204,000 prior)
- 8:30 a.m. ET: Continuing Claims, week ended Dec. 31 (1.694 million prior)
- 2:00 p.m. ET: Monthly Budget Statement (-$60 billion expected, -$21.3 billion prior)
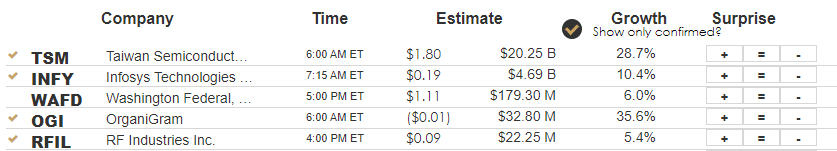
Earnings
Market Trading Update
Today is the big CPI report that all traders will be glued to. Much like Goldilocks, the question, as discussed next, is whether the number is too hot, too cold, or just right. The markets seem to be beating on a just right number as stocks rallied strongly yesterday, with the disinflationary stocks (technology) leading the way. Furthermore, earnings season kicks off next week with the banks, so the question is, how much “gas” does the rally have in it?
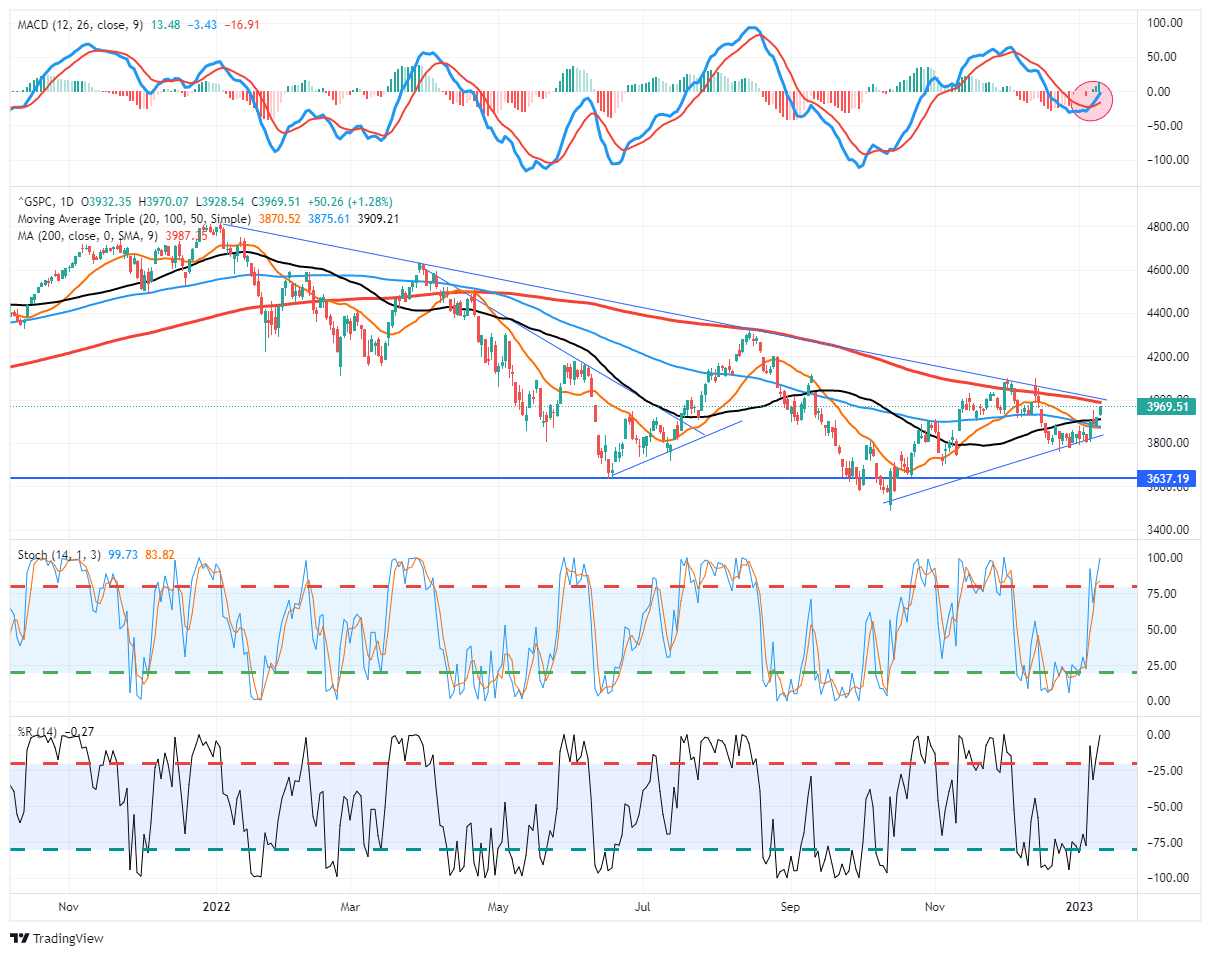
Technically, the bulls are in control for the moment with the MACD buy signal and our money flow signals intact. With the market breaking above the 50-DMA yesterday, such paves the way for a rally to the 200-DMA and the downtrend line from January. A break above that level will suggest a more bullish market near term.
The markets are getting decently overbought short-term, so don’t forget to take some profits along the way. We added a trading position to our portfolios, with a tight stop, yesterday in anticipation of the CPI report tomorrow.
CPI and S&P 500 Speculation
JP Morgan expects extreme volatility in the stock market if today’s CPI data is released. Yes, you read that right- if the BLS releases the data. Regardless of where CPI is reported, JP Morgan thinks the S&P 500 could fall by at least 2.5% or rise by at least 1.5%. The consensus forecast for annual CPI is 6.6%, down from 7.1% last month. JP Morgan estimates the following S&P 500 moves based on its probabilities for a range of CPI prints:
- If CPI is greater than 6.6%, the S&P 500 could be down 2.5% – 3% – 15% probability.
- If CPI meets the estimate or is .1% to .2% lower than consensus (6.4% – 6.6%), the S&P 500 could rally 1.5% to 2% – 65% probability.
- If CPI is below 6.4%, the S&P 500 could rally 3% to 3.5% – 20% probability.
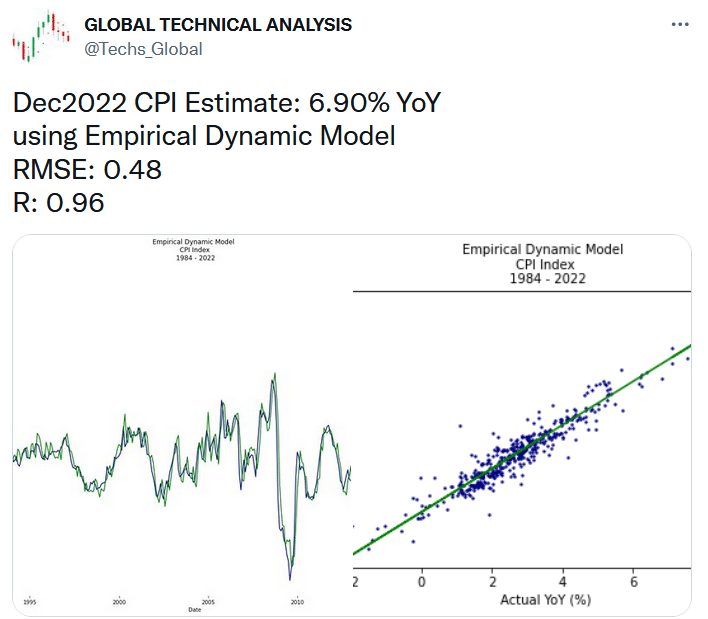
Based on JP Morgan’s price change estimates and the probability of each estimate, investors should expect the S&P 500 to rise by 1.38% today. Based on Brett Freeze’s 6.9% forecast, investors may want to take cover.

Recession? Atlanta Fed Thinks the Economy is Booming
While many economists are concerned about economic growth in 2023, it appears that 2022 may have ended with a bang. The Atlanta Fed GDPNow is forecasting 4.1% real GDP growth in the fourth quarter. The current Wall Street estimate is much less optimistic at a mere 1.1%. If Wall Street is correct, the Fed will be more comfortable taming inflation than if the Atlanta Fed proves prescient. If the Atlanta Fed is close to accurate, we might expect the Fed to raise by 50bps at the coming February 1, 2023, FOMC meeting.


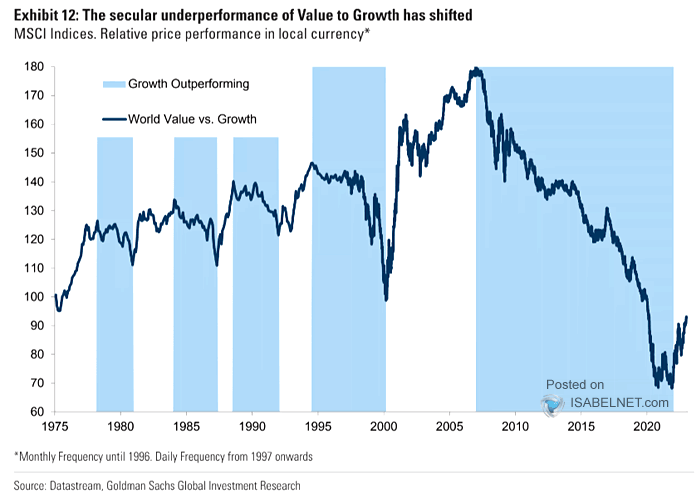
Value vs. Growth
Value outperformed growth last year after a 15-year period in which growth held sway over value. The graph below shows how the price performance of world (not just the USA) value versus growth shifted materially last year. Is this a significant shift, as we saw with the dot com bust of 2000, or just another false signal? For those who believe value stocks will outperform in the coming years, we will release, over the coming weeks, a series of Five for Friday articles in SimpleVisor that screen for value/higher dividend stocks.
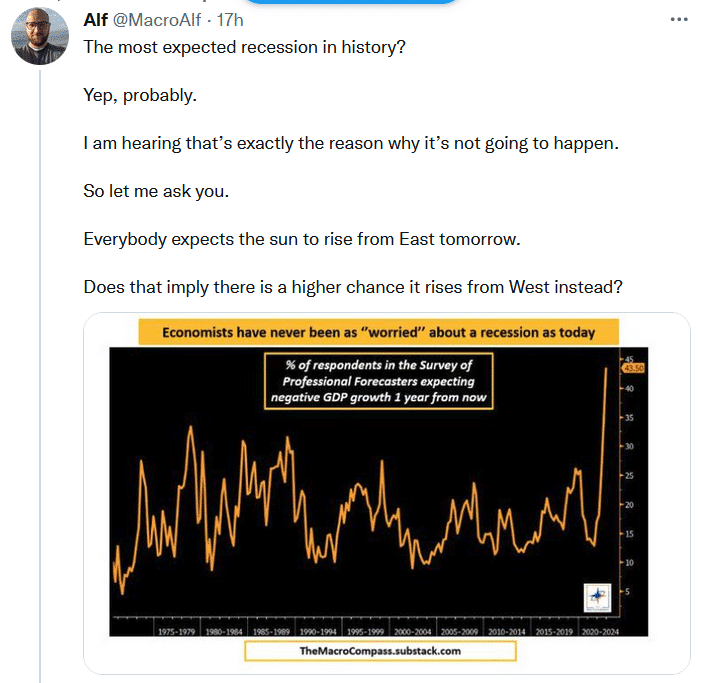
Tweet of the Day
Please subscribe to the daily commentary to receive these updates every morning before the opening bell.
If you found this blog useful, please send it to someone else, share it on social media, or contact us to set up a meeting.