


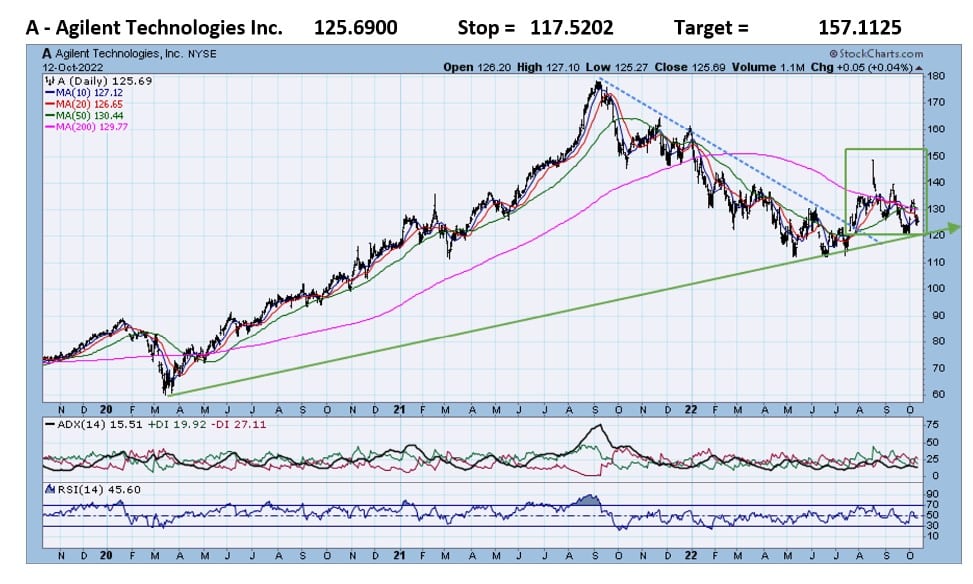
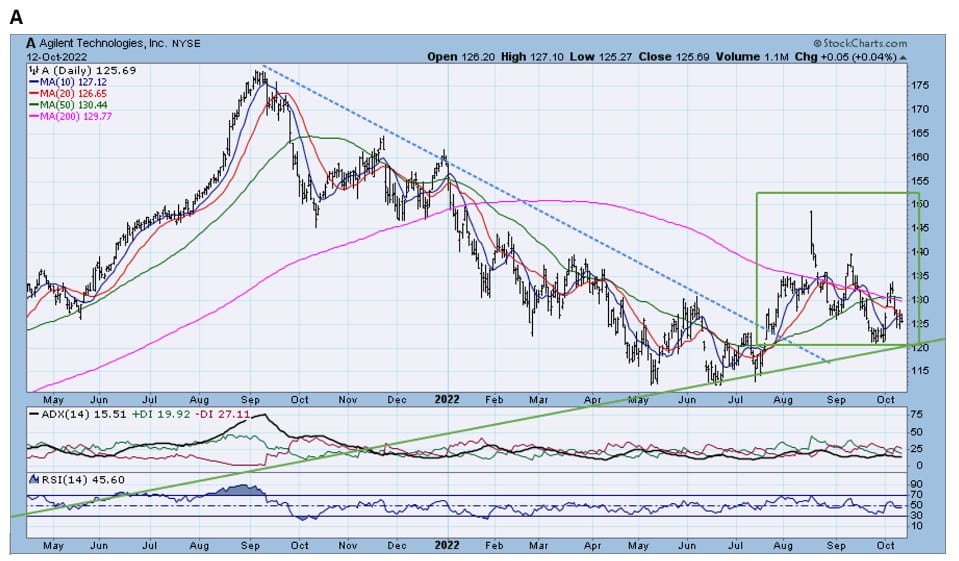
- A is down 30% from its September 2021 highs. In July, A rose above its steep 9-month downtrend line. The recent strength, which is considerable given the market’s weakness, maintained the long-term uptrend from the March 2020 lows. Chart 2 reveals that A has established a pattern of higher lows since June=uptrend.
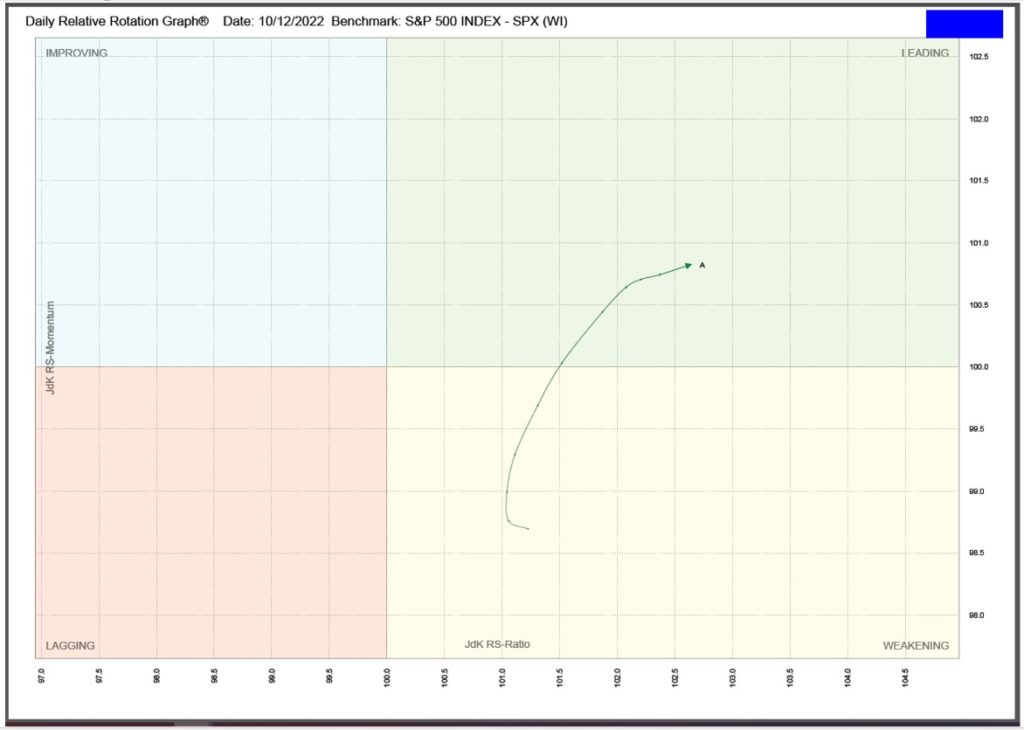
RRG analysis shows that A did fall into the Weakening quadrant, but has made a made a quick return to the Leading quadrant. (see the RRG below).
Relative Rotation Graphs (RRG) – explanation video


Jeff Marcus founded Turning Point Analytics (TPA) in 2009 after 25 years on trading desks and 13 years as a head trader to provide strategic and technical research to institutional clients. Turning Point Analytics (TPA) provides a unique strategy that works as an overlay to clients’ good fundamental analysis. After 10 years of serving only large institutions, TPA now offers its research services to mid and small managers, RIA’s, and wealthy sophisticated individuals looking for a way to increase their returns and outperform their peers.
Subscribe 2 Week Trial
Customer Relationship Summary (Form CRS)