


Three well-followed market indexes provide investors with three different tales. These tales are a function of the narrow market breadth in which a small handful of the largest stocks lead the way higher. The Nasdaq 100 (QQQ), in which these stocks carry the most weight is bullish. It keeps setting higher highs, its 50dma is above its 200dma, and both moving averages trend upwards. The S&P 500 (SPY) is moderately bullish, with its moving averages trending up but failing to hit higher highs. Lastly, the equal-weighted S&P 500 (RSP) is providing bearish indications. It’s been setting a series of lower highs. More concerning, its downward trending 50dma will potentially cross below the 200dma in what technicians call a death cross.
Which tale is the best indicator of what will come? If the market can maintain its bullish bias and a broader array of stocks participate in the upside, RSP should break the downward trend and possibly avoid the death cross. In that scenario, SPY will break above the flat resistance line, which will also be bullish. Conversely, the top ten or so stocks responsible for nearly 100% of this year’s S&P 500 gains could reverse lower. If most stocks in the indexes follow them lower, it would be bearish for all three indexes.

What To Watch Today
Earnings
- No notable earnings releases today
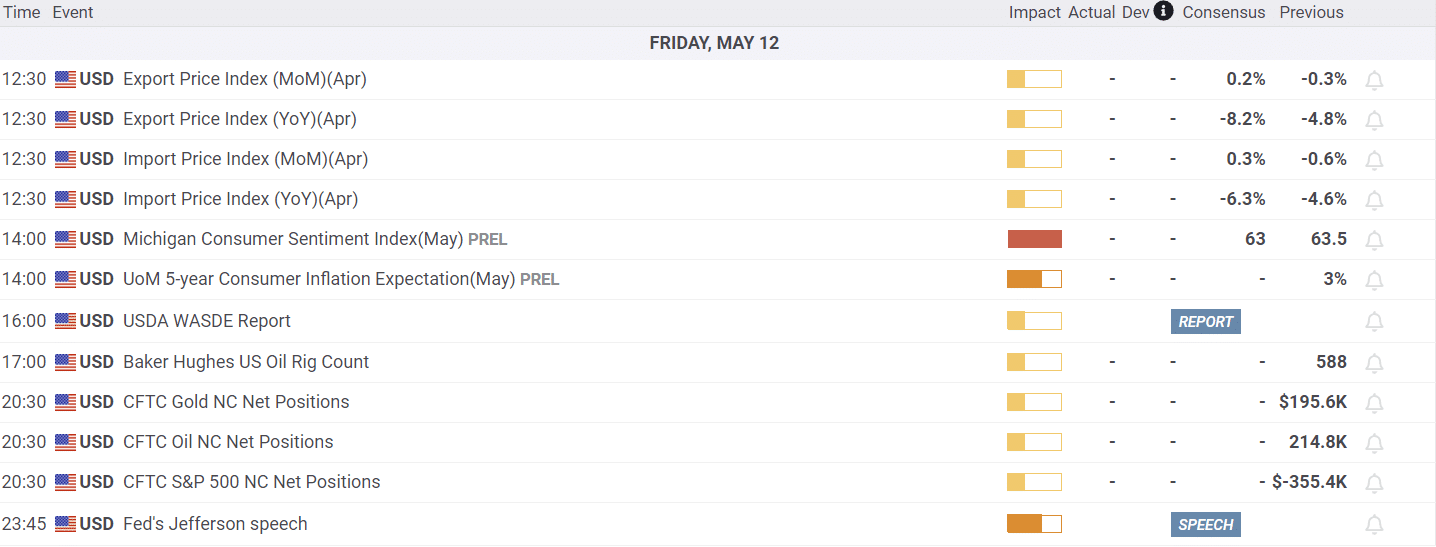
Economy
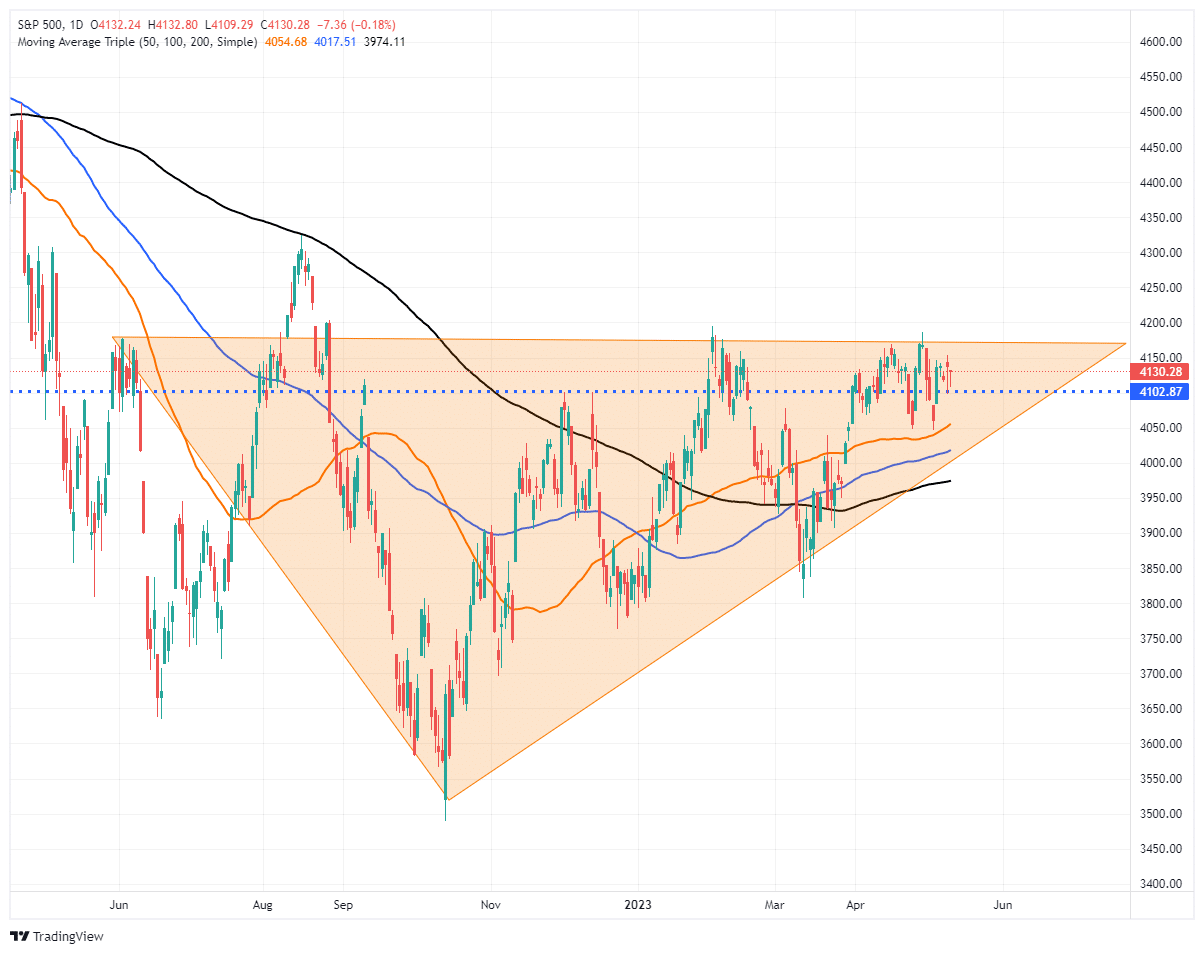
Market Trading Update
With inflation data coming “in line” with expectations, such has not provided any support for the “bullish view” of an imminent “rate cut.” While the inflation data did cool a bit, it remains elevated, suggesting that while the Fed will likely “pause” on further rate hikes to allow the “lag effect” to catch up with the economy, there is no incentive for the Fed to cut rates anytime soon. As such, stocks remain range bound for now.
For investors, however, there is no reason to be overly negative in the near term. The market continues to build on a bullish trend, all major moving averages are now sloping higher, and the compression of the trading range will eventually end. A breakout above 4200 will be a strong bullish signal for a further advance. A break below 4100 will suggest a return of tougher price action. Until the market declares itself in one direction or the other we are stuck in a holding pattern with higher levels of cash and fixed income for now.

Good and Bad News
The graph below shows the stunning surge and decline in the New York Fed’s global supply chain pressure index. The index popped higher as Covid shut down ports and kept many supply chain workers home. Coupled with strong demand due to massive stimulus, inflation took off. Since then, the supply side has normalized, but demand remains strong, accounting for the slowly declining inflation rate. That is the good news.
The bad news is that the index below is approaching levels last seen during the financial crisis. This may indicate that economic growth will falter in the coming quarters as demand for shipped goods is declining. The bottom graph shows the year-over-year decline is unlike anything we have seen in over 25 years. However, like much economic data, the anomaly is the statistical result of the surge higher in 2020 and 2021.

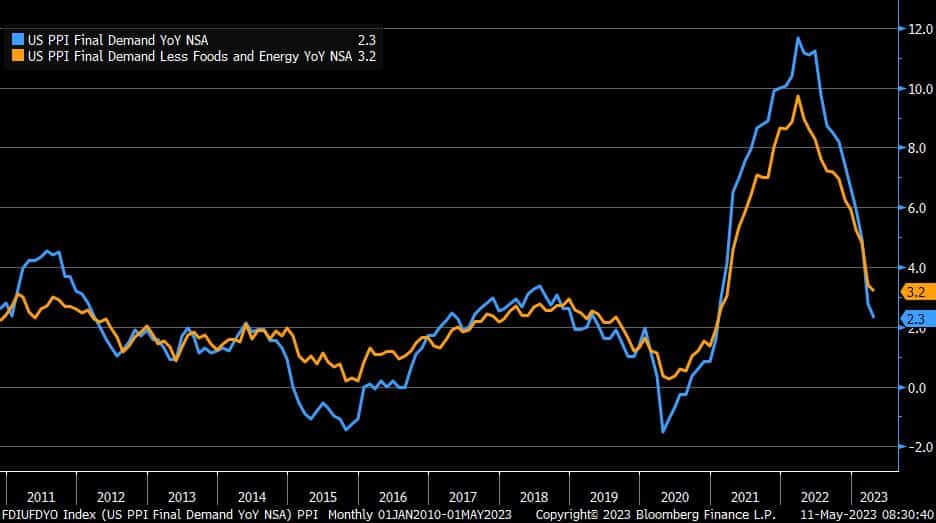
PPI and Jobless Claims
PPI came in below expectations at +0.2%. The core PPI, stripping out food and energy, was also +0.2%. Year over year, PPI is now down to 2.3%. The graph below shows that PPI and Core PPI are not sticky, like CPI. More importantly, they are getting pretty close to pre-pandemic levels. PPI tends to lead CPI. As such, yesterday’s data should comfort the Fed that they have hiked rates enough.
Jobless claims continue to tick higher. They rose to 264k, up from 242k last week and the 182k low last September. Jobless claims are also starting to increase moderately above the pre-pandemic rate. From 2018 through 2019, jobless claims averaged 218k. Continuing claims also continue to rise slowly. Neither indicator is concerning, but they both show discernable trends higher. These indicators will be closely watched as they tend to lead the broader employment data.
Bond Yields Are Stuck
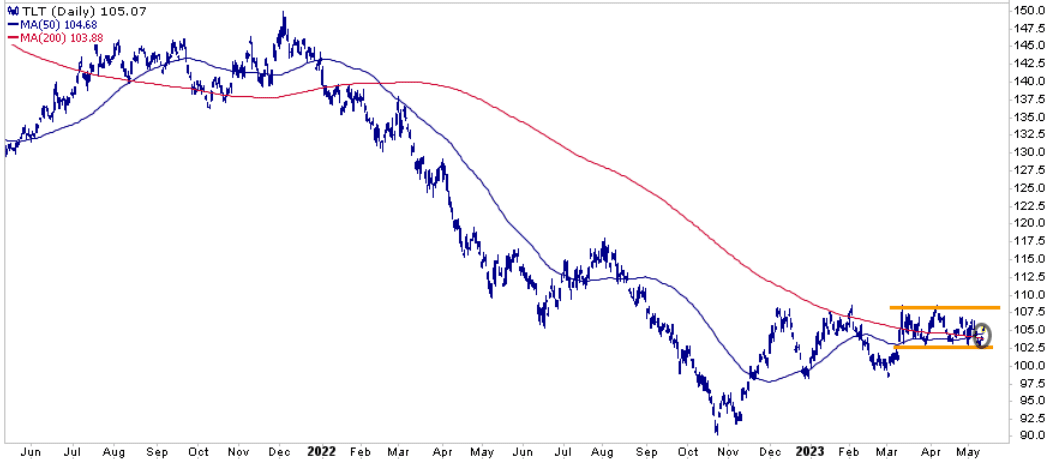
We led with a discussion of how the three equity indexes, RSP, SPY, and QQQ, are sending three distinct tales. We continue by telling the tale of the bond market. As shown below, long-term Treasury bonds (TLT) have been in a tight channel for over two months. They have consistently held support at 102. At the same time, upward progress keeps getting halted around 108.
This tight range may hold until the debt cap is resolved. However, a resolution to the channel may have to wait until the market is clearer on the Fed’s future policy path. The Fed just transitioned to what is widely believed to be a natural policy. Shifting to a more dovish tack or back to a hawkish path may likely determine the direction in which TLT breaks out of the channel.
Tweet of the Day
Please subscribe to the daily commentary to receive these updates every morning before the opening bell.
If you found this blog useful, please send it to someone else, share it on social media, or contact us to set up a meeting.
Post Views: 7
2023/05/12