


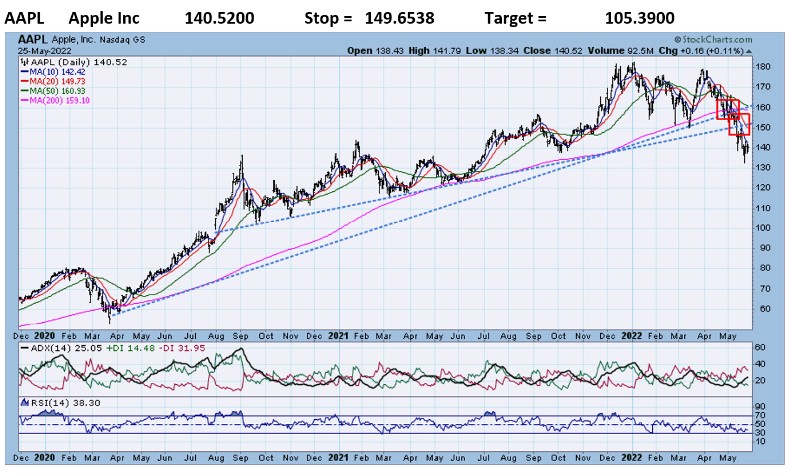
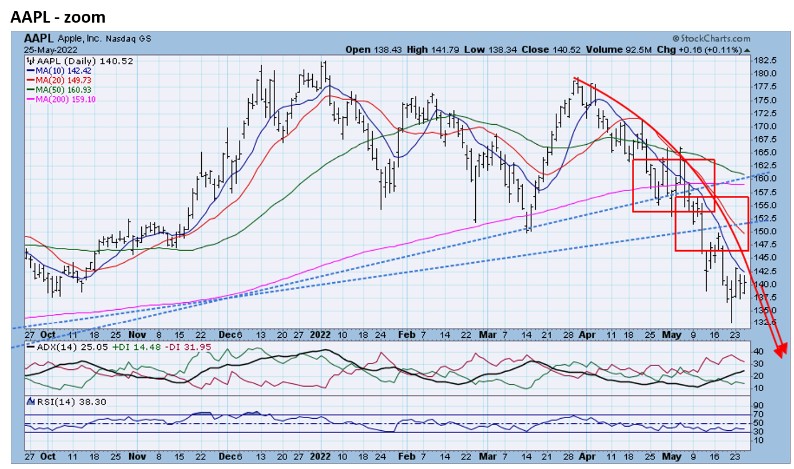
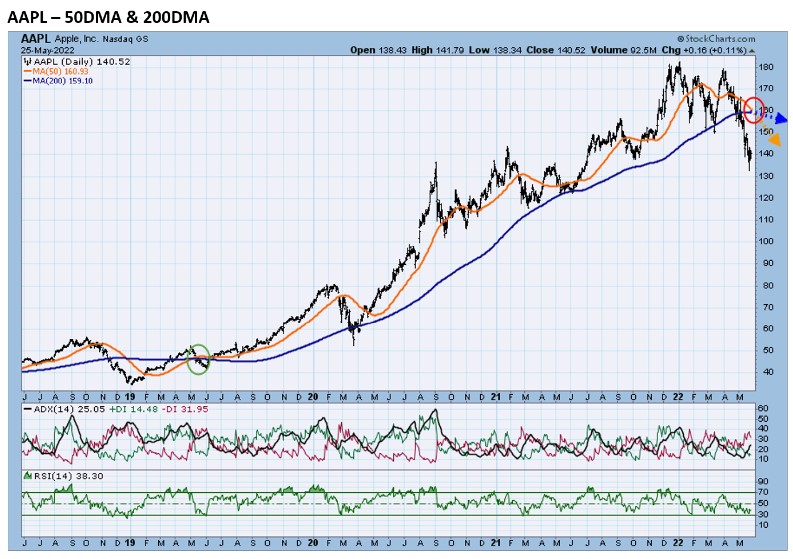
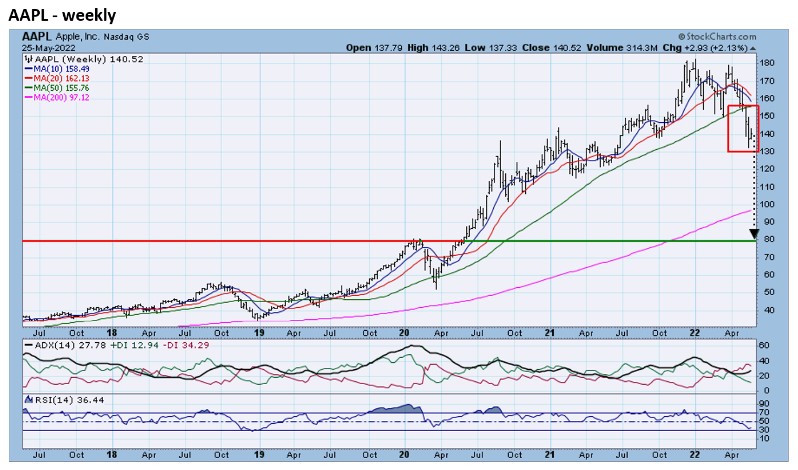
- AAPL fell below its 25-month and 21-month uptrends earlier this month. The zoom chart shows that AAPL is not only in a downtrend, but an accelerating decline. It is probable that this pattern will continue. Chart 3 shows that AAPL’s 50DMA will most likely cross below its 200DMA soon. This will be the first time the AAPL will be in a confirmed long-term downtrend since May 2019. The weekly chart reveals that long-term support for AAPL is now far below Wednesday’s close; at the 2020 breakout level.
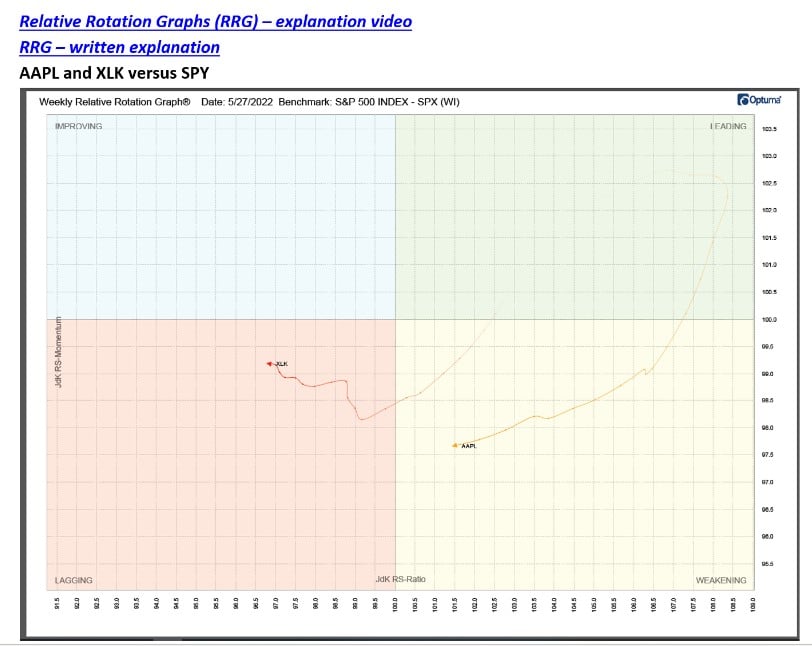
RRG analysis shows that the TECH ETF XLK, whose #2 weight is AAPL at 22%, is well entrenched in the Lagging quadrant even though AAPL has managed to outperform the sector for most of 2022. The RRG shows that AAPL has moved rapidly out of the Leading quadrant and seems to be inexorably headed toward the Lagging quadrant. This points to continued underperformance.


Jeff Marcus founded Turning Point Analytics (TPA) in 2009 after 25 years on trading desks and 13 years as a head trader to provide strategic and technical research to institutional clients. Turning Point Analytics (TPA) provides a unique strategy that works as an overlay to clients’ good fundamental analysis. After 10 years of serving only large institutions, TPA now offers its research services to mid and small managers, RIA’s, and wealthy sophisticated individuals looking for a way to increase their returns and outperform their peers.
Subscribe 2 Week Trial
Customer Relationship Summary (Form CRS)