


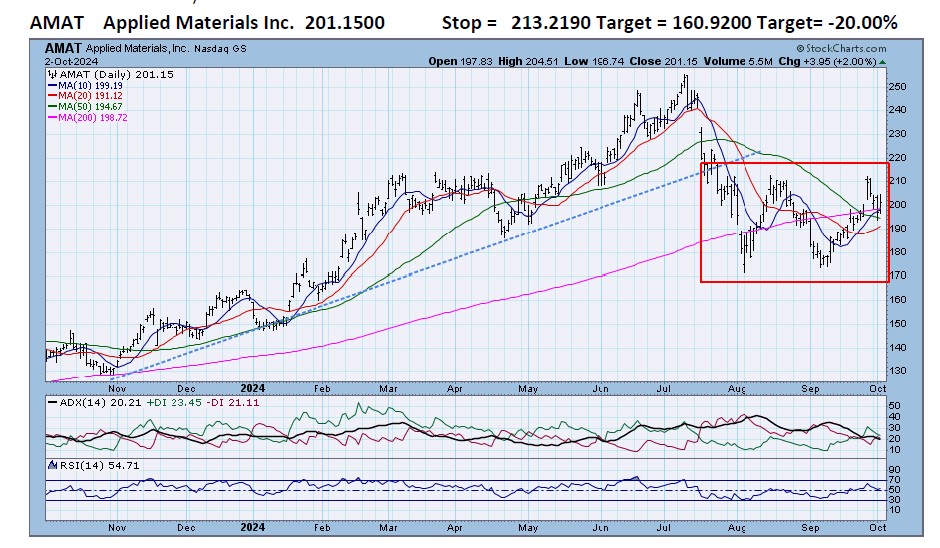
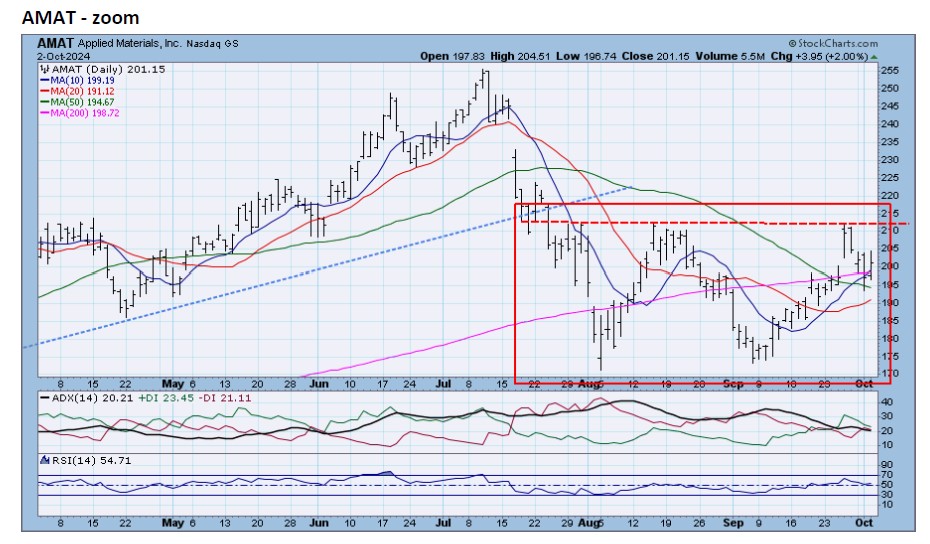
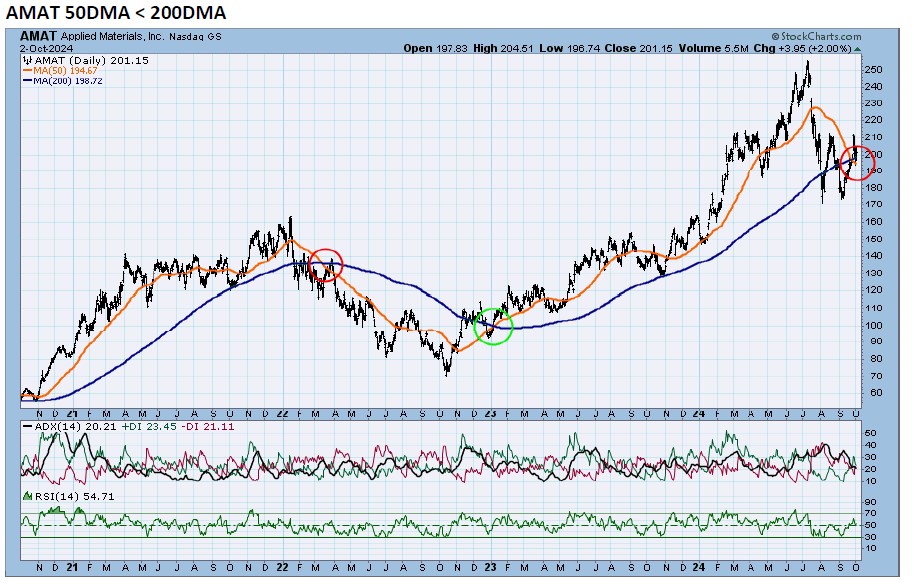
- AMAT fell below its 8-month uptrend line in July after sustaining a large gap-down day. AMAT had struggled with and failed to surpass breakpoint resistance around the 212 level 3 times since the July break (Zoom chart below). Chart 3 shows that AMAT’s 50DMA had fallen below its 200DMA, indicating a long-term downtrend has been established. 50DMA – 200DMA crosses have been good indicators of direction since 2020.
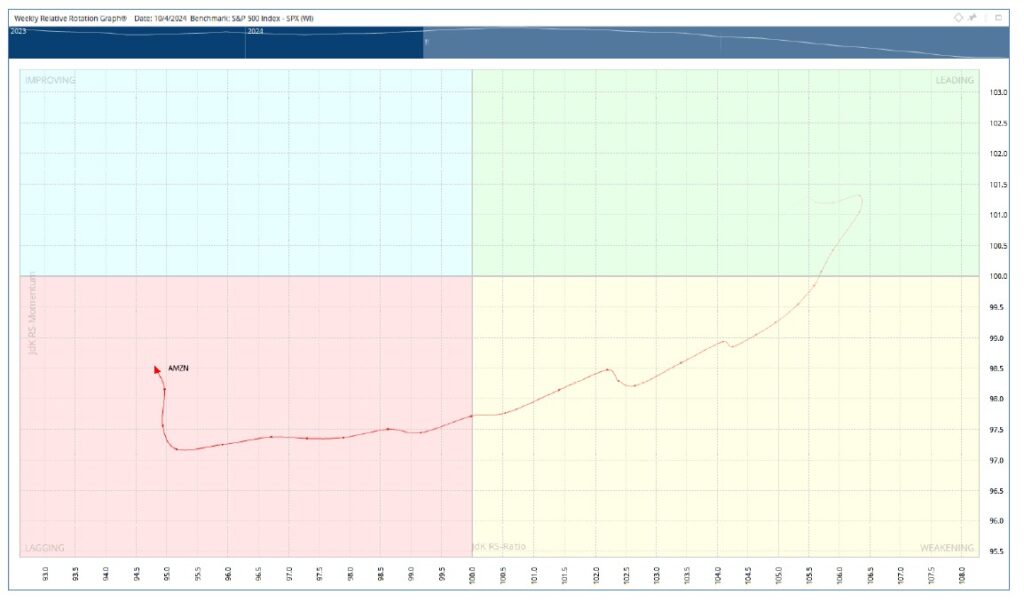
RRG analysis shows that AMAT has lost relative strength and relative momentum moving from the Leading quadrant, through the Weakening quadrant and into the Lagging quadrant. (See RRG below)
Relative Rotation Graphs (RRG) – explanation video


Jeff Marcus founded Turning Point Analytics (TPA) in 2009 after 25 years on trading desks and 13 years as a head trader to provide strategic and technical research to institutional clients. Turning Point Analytics (TPA) provides a unique strategy that works as an overlay to clients’ good fundamental analysis. After 10 years of serving only large institutions, TPA now offers its research services to mid and small managers, RIA’s, and wealthy sophisticated individuals looking for a way to increase their returns and outperform their peers.
Subscribe 2 Week Trial
Customer Relationship Summary (Form CRS)