


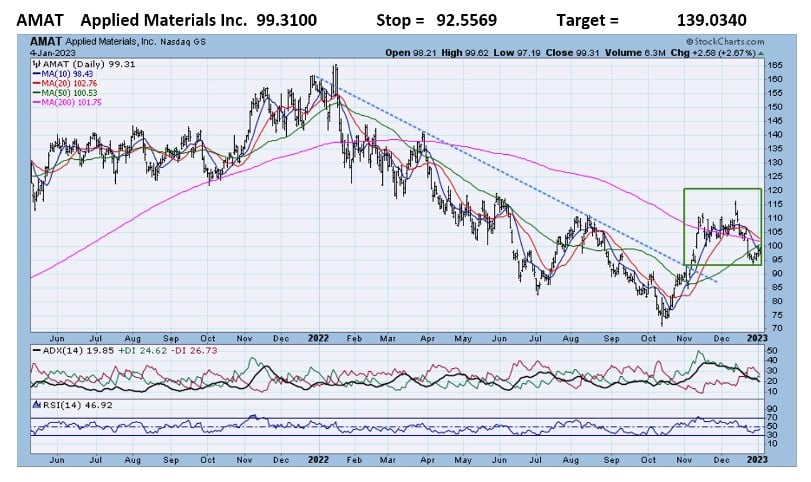
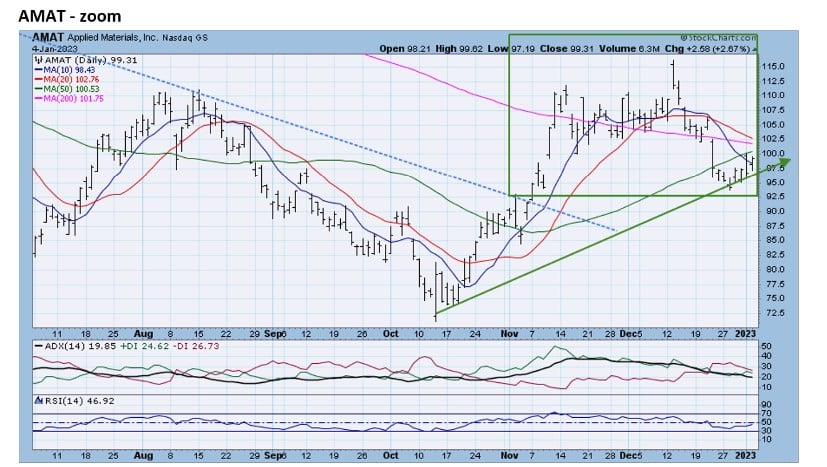
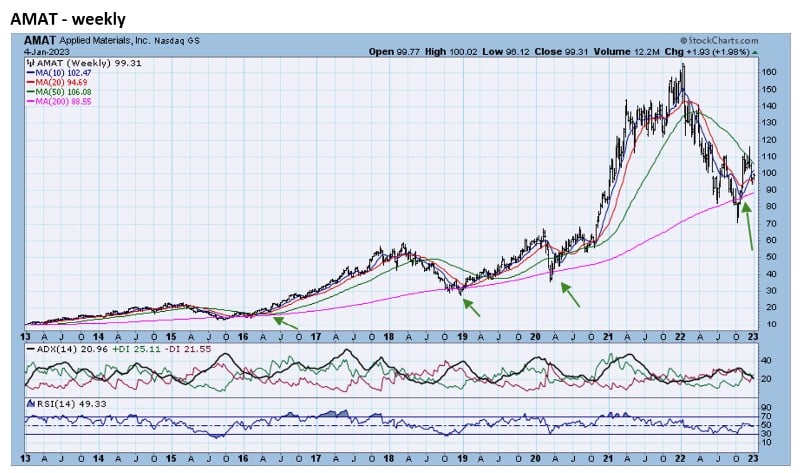
- AMAT rose above its 12-month downtrend line in November. AMAT fell 55% from the January highs to the October lows. The zoom chart reveals that AMAT has recently established a pattern of higher lows=uptrend. The weekly chart shows that the AMAT very long-term moving average (200-week) was only temporarily violated in October. This long-term MA has kept AMAT on an upward trajectory since 2016. This pattern should continue.
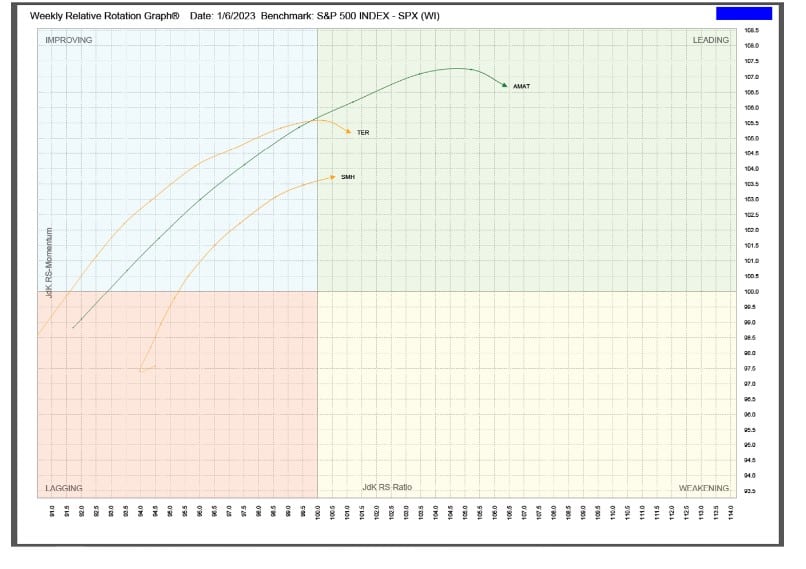
RRG analysis reveals that AMAT is now solidly in the Leading quadrant. (RRG below)
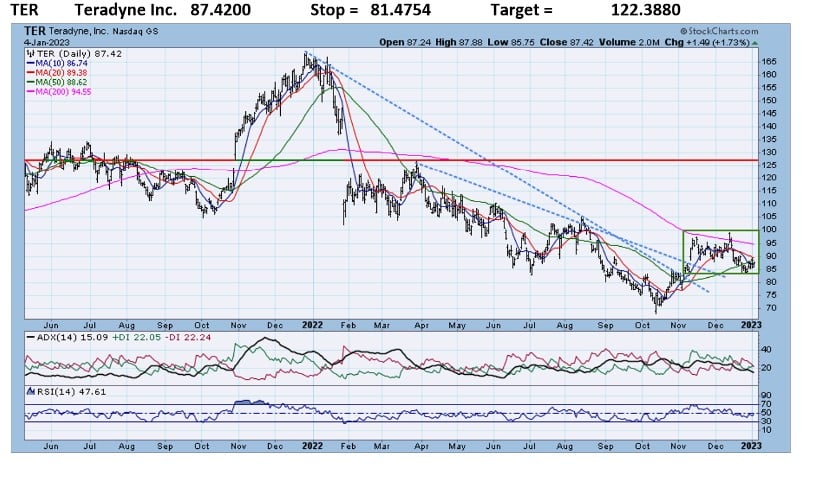
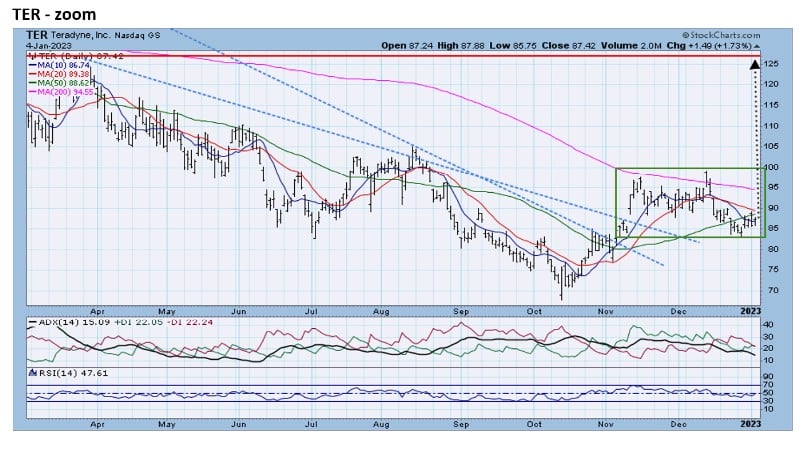
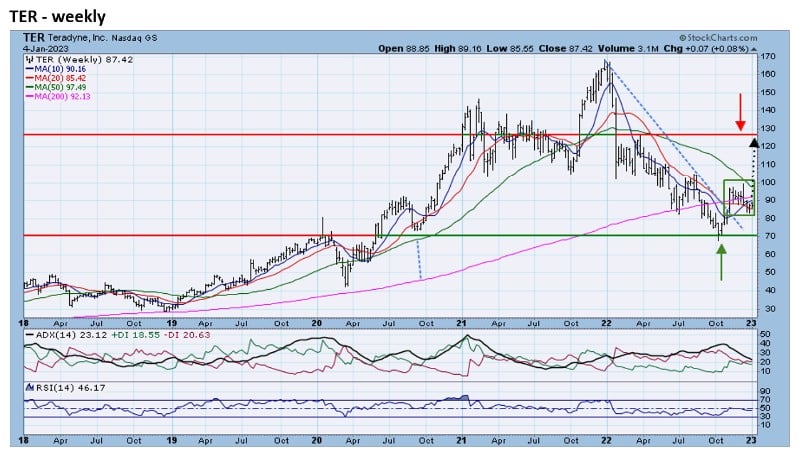
- TER rose above its 2022 and 7-month downtrend lines in November. Resistance is back to the January breakdown level or close to 125 (over 40% above Wednesday’s close) See the zoom chart. The weekly shows that the recent turnaround for TER confirms long-term support at the 70 level. Again, the long-term resistance is near 125.
RRG analysis reveals that TER has moved into the Leading quadrant. (RRG below)
Relative Rotation Graphs (RRG) – explanation video


Jeff Marcus founded Turning Point Analytics (TPA) in 2009 after 25 years on trading desks and 13 years as a head trader to provide strategic and technical research to institutional clients. Turning Point Analytics (TPA) provides a unique strategy that works as an overlay to clients’ good fundamental analysis. After 10 years of serving only large institutions, TPA now offers its research services to mid and small managers, RIA’s, and wealthy sophisticated individuals looking for a way to increase their returns and outperform their peers.
Subscribe 2 Week Trial
Customer Relationship Summary (Form CRS)