


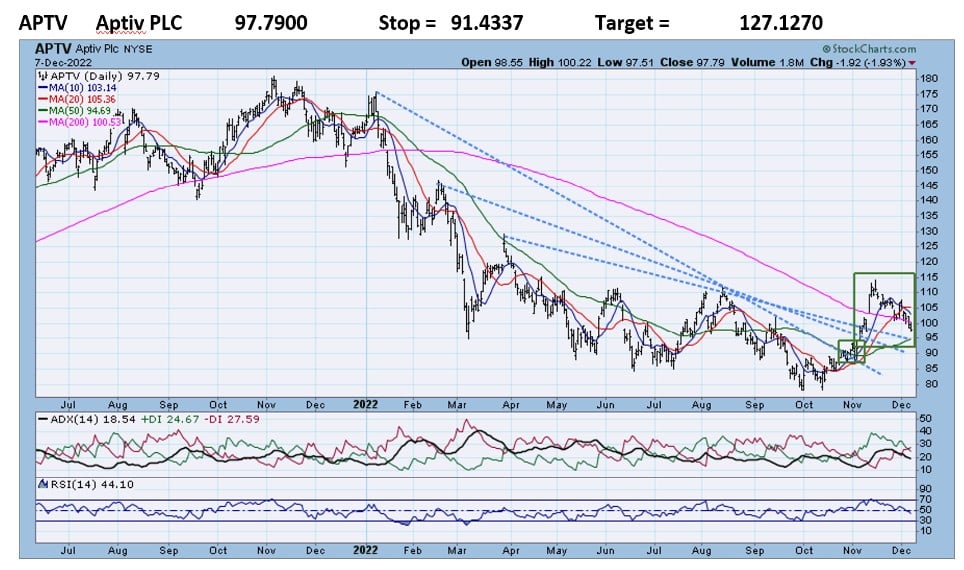
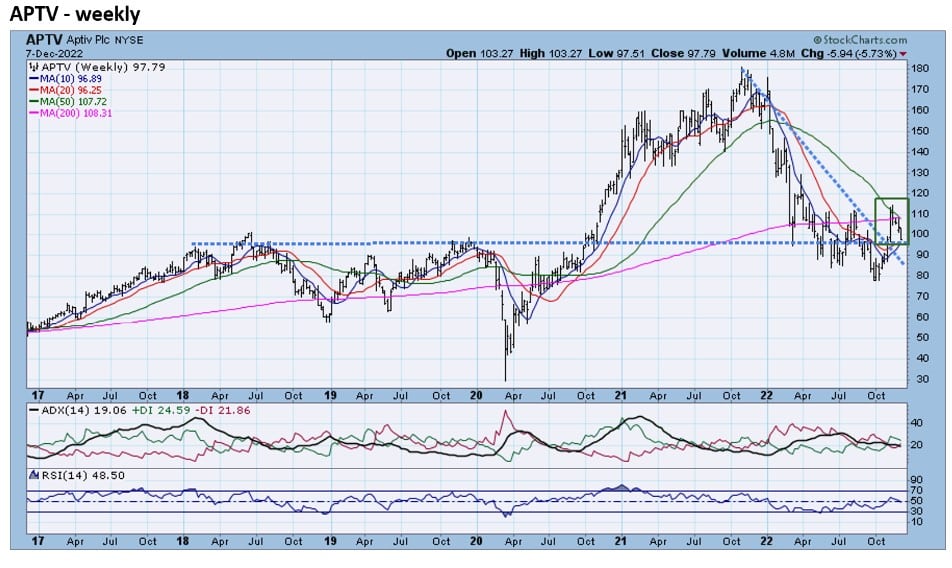
- APTV rose above its 2022, 10-month, and 9-month downtrend lines in November. APTV was down over 55% from its November 2021 highs to its October 2022 lows. The zoom chart reveals that APTV has established a pattern of higher lows=uptrend. The weekly chart shows that Wednesday’s close is near long-term support.
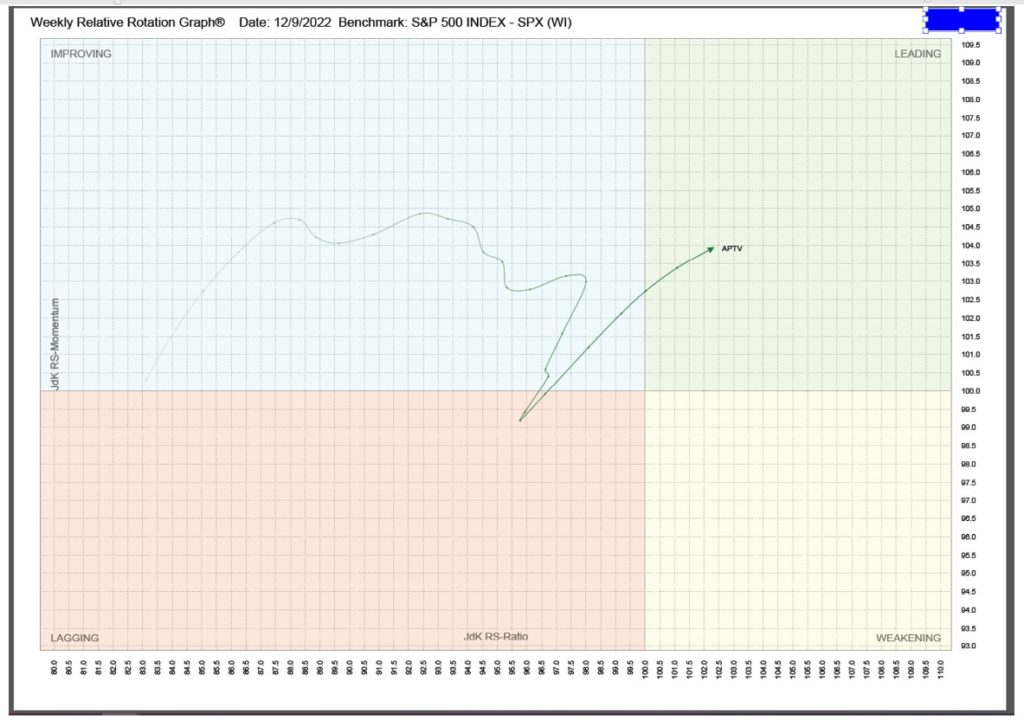
- RRG analysis shows that APTV has moved comfortably into the Leading quadrant, but we also know that it is 45% below its 2021 peak, and its 14-day RSI is only 44.

Relative Rotation Graphs (RRG) – explanation video


Jeff Marcus founded Turning Point Analytics (TPA) in 2009 after 25 years on trading desks and 13 years as a head trader to provide strategic and technical research to institutional clients. Turning Point Analytics (TPA) provides a unique strategy that works as an overlay to clients’ good fundamental analysis. After 10 years of serving only large institutions, TPA now offers its research services to mid and small managers, RIA’s, and wealthy sophisticated individuals looking for a way to increase their returns and outperform their peers.
Subscribe 2 Week Trial
Customer Relationship Summary (Form CRS)