


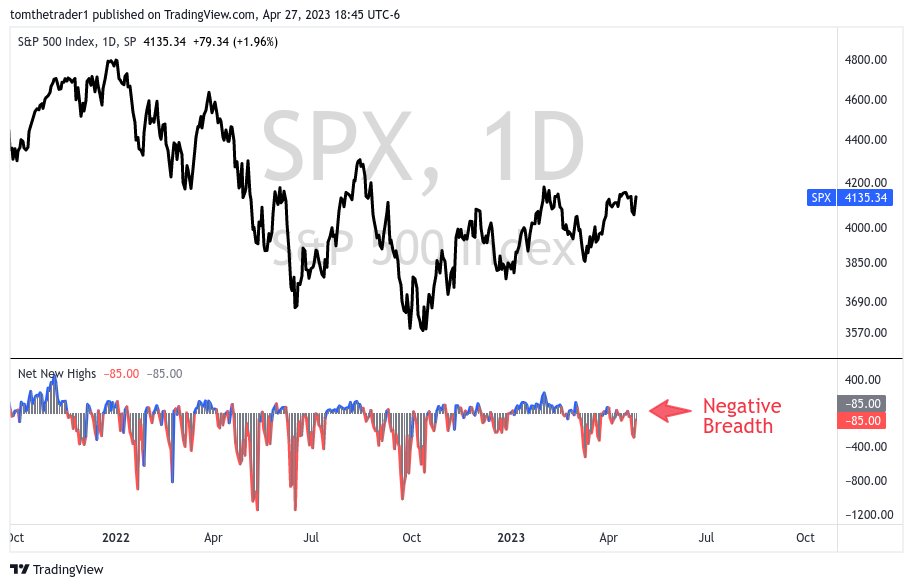
The equity markets surged last Thursday and continued upward on Friday on poor economic news and bad breadth. GDP was 1.1%, well below the 2% expectation. The miss was due to higher-than-expected inflation and a drop in personal consumption. Consequently, Fed Funds imply investors are confident of a rate hike this week and a good chance of another in June. The market’s breadth behind the rally was not healthy. Despite jumping nearly 2%, there were a net 85 more new lows than new highs in the S&P 500.
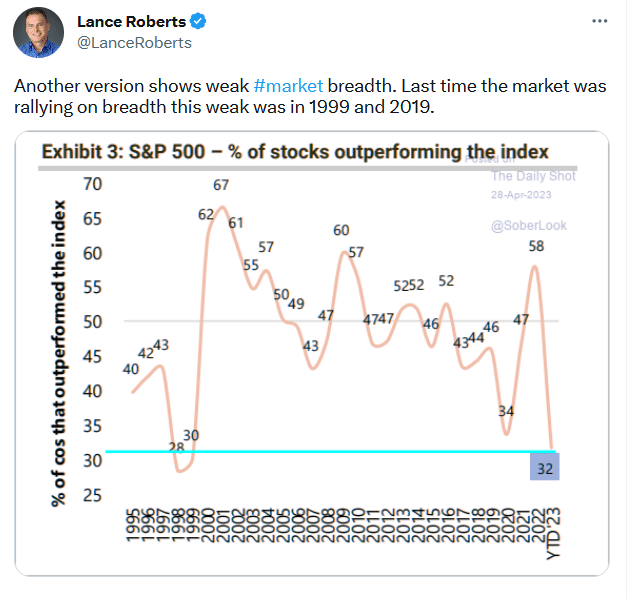
The Tweet of the Day at the bottom shows that only 32% of the stocks in the S&P 500 are beating the index year to date. You must go to the dot com bubble to find similar bad market breadth. This is unhealthy market behavior. We suspect that either more stocks will join the rally, causing breadth to normalize, or last week’s rally may be short-lived. A section below, entitled More Bad Breadth, argues the latter.
What To Watch Today
Economy

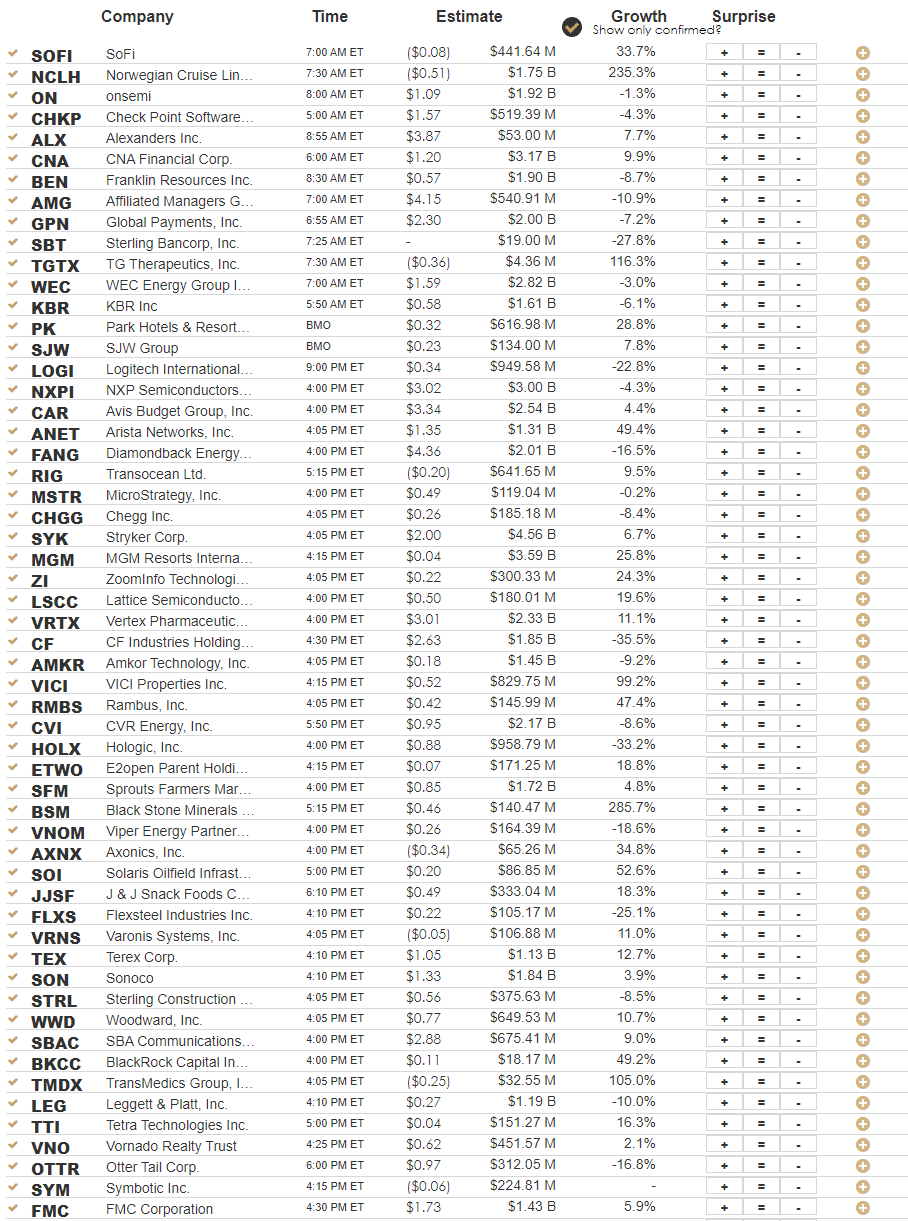
Earnings
Market Trading Update
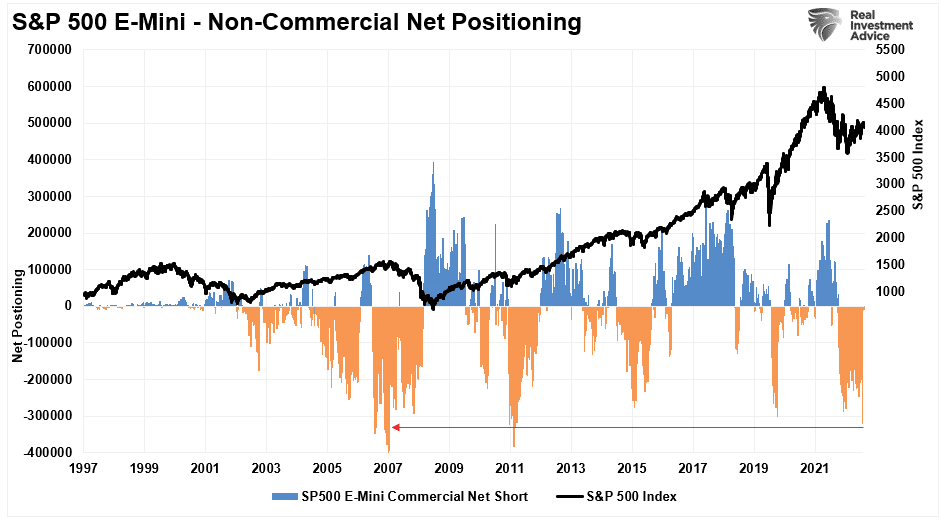
Last week, the market mustered a rally as corporate earnings were not as “terrible as expected.” Part of that rally came from short-term oversold conditions and a massive short position in the S&P 500 index.
However, selling early in the week triggered our “sell” signals as expected.
The MACD buy signal remains intact but is very close to triggering a sell signal which could occur next week.
With such a significant short position on the index, rallies can be sharp as investors are forced to cover their positions. Furthermore, it is not uncommon for the market to rally during a consolidation or correction when sell signals are intact. As shown below, we have seen several such rallies during corrective periods since November 2021.
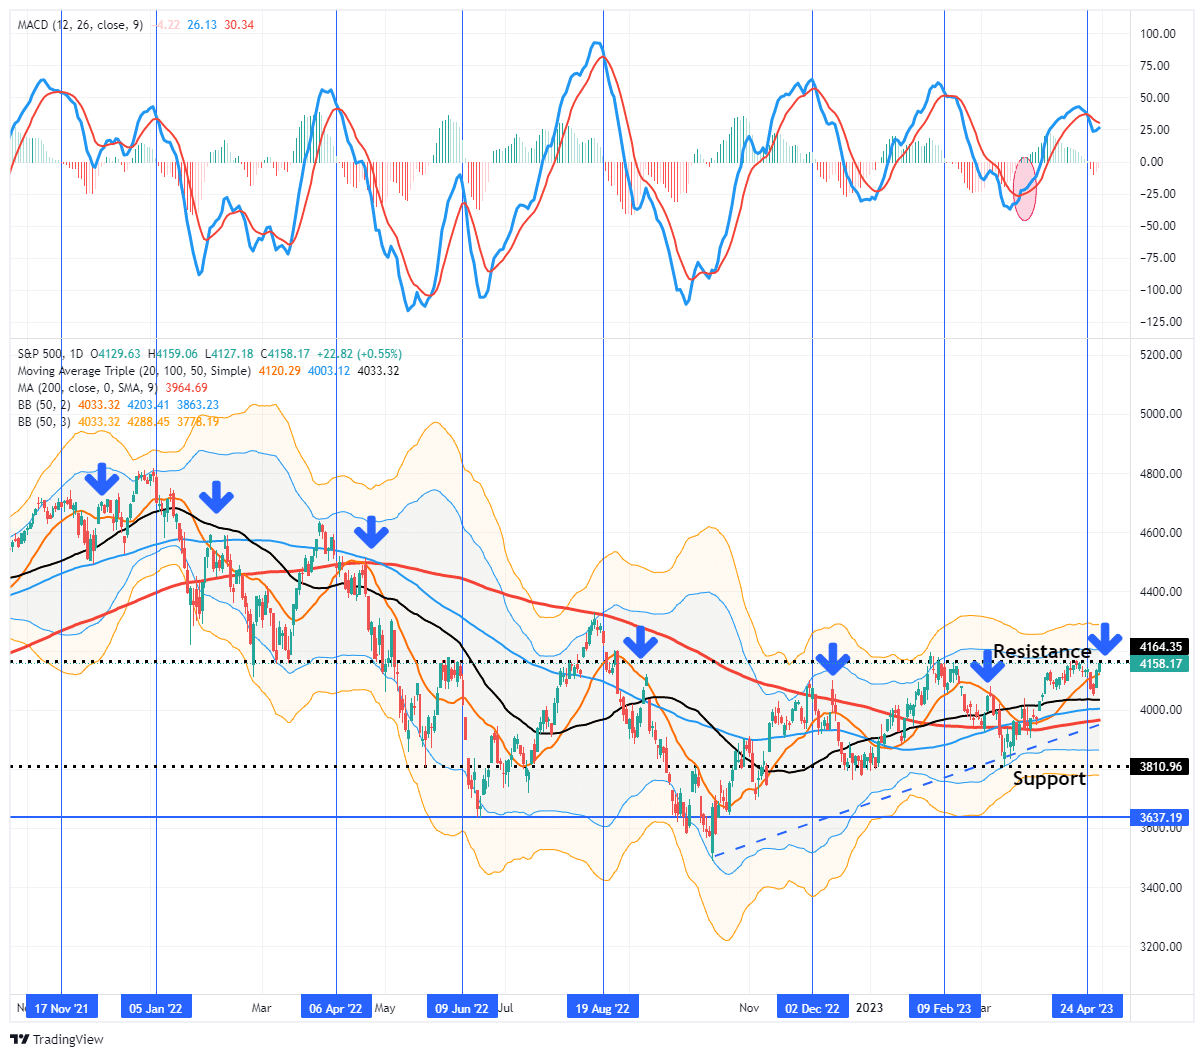
Given that the MACD “sell signal” turned from a lower level than the three previous peaks, we could see a short-term reversal to a buy signal. However, should such occur, there is likely limited upside. Therefore, we suggest using the current rally to reduce risk, rebalance portfolios and raise cash levels moderately is still advisable.
While the markets are rallying on earnings not being as “terrible” as expected, that still isn’t saying much considering the massive reduction in estimates from June last year. The risk to earnings remains with the consumer under pressure and economic growth slowing. Since consumption is where revenues come from, the recent economic data does not wholly support expectations of an earnings resurgence.

The Week Ahead
We have a busy week ahead between economic data, the Fed, and more corporate earnings.
The week starts with the ISM Manufacturing Survey. Analysts expect a slight uptick despite most of the regional surveys coming in moderately below expectations. The ISM Services survey will follow on Wednesday. Of utmost importance will be employment data. JOLTs on Tuesday, ADP on Wednesday, and the BLS employment report on Friday will help assess whether the jobs market is weakening. Given the uptick in jobless claims, expectations are for the BLS to report 190k new jobs, down from 236k last month.
On Wednesday, the Fed is widely expected to hike Fed Funds by .25% to 5%. Given inflation appears sticky and economic activity remains relatively healthy, we so no reason they will not continue with the “higher for longer” narrative. Compared to prior meetings, this one could be a sleeper.
Earnings will continue this week, with Apple, the last of the mega-cap stocks, on Thursday. While Exxon reported on Friday, the week will see most other energy companies report earnings. Regarding earnings thus far, Michael Kramer notes:
Based on data from Bloomberg, 262 companies in the S&P have reported, sales growth in 1Q is 4% and earnings growth is -2.69%
Bad Nasdaq Market Breadth
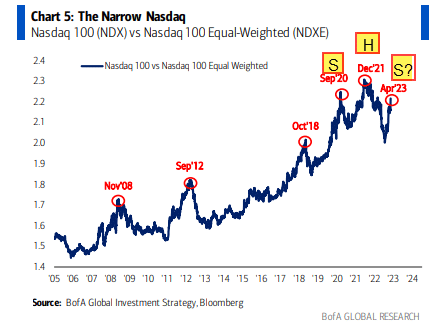
The BofA graph below, as annotated by Samantha LaDuc, shows the price ratio of the weighted Nasdaq 100 to the equal-weighted Nasdaq 100. Microsoft and Apple comprise 25% of the Nasdaq. Further, the top ten stocks account for over 50% of the index. Therefore the index is heavily skewed toward the prices of a handful of stocks. The price gains of the top holdings have significantly been outperforming the majority of the Nasdaq stocks. As we led this Commentary, the market has bad breadth.
The one and three-month returns following the circled peaks are shown in the table below to put context to what we might expect from the current surge.

Freight Recession
One of the themes from last week’s Commentaries was the sharp slowdown in freight traffic and packaging. The graph adds to the evidence. It shows that inbound container volume at the top ten U.S. ports has fallen steadily since early 2022. Such is not surprising, but what is concerning is that volume is now at the lowest level since the pandemic started. Like data we shared from UPS, JB Hunt, and the Packaging Corporation of America, the chart below further confirms a freight recession.

Tweet of the Day
Please subscribe to the daily commentary to receive these updates every morning before the opening bell.
If you found this blog useful, please send it to someone else, share it on social media, or contact us to set up a meeting.
Post Views: 3
2023/05/01