


Warren Buffett’s firm, Berkshire Hathaway, continues to amass a large position in Occidental Petroleum (OXY). In just the last week Berkshire bought 3.7 million more shares, raising its ownership percentage of OXY to 23.6%. Berkshire Hathaway has the approval of the U.S. Federal Energy Regulatory Commission to buy up to 50% of the company’s stock. So what do Warren Buffet and Berkshire Hathaway see in OXY?
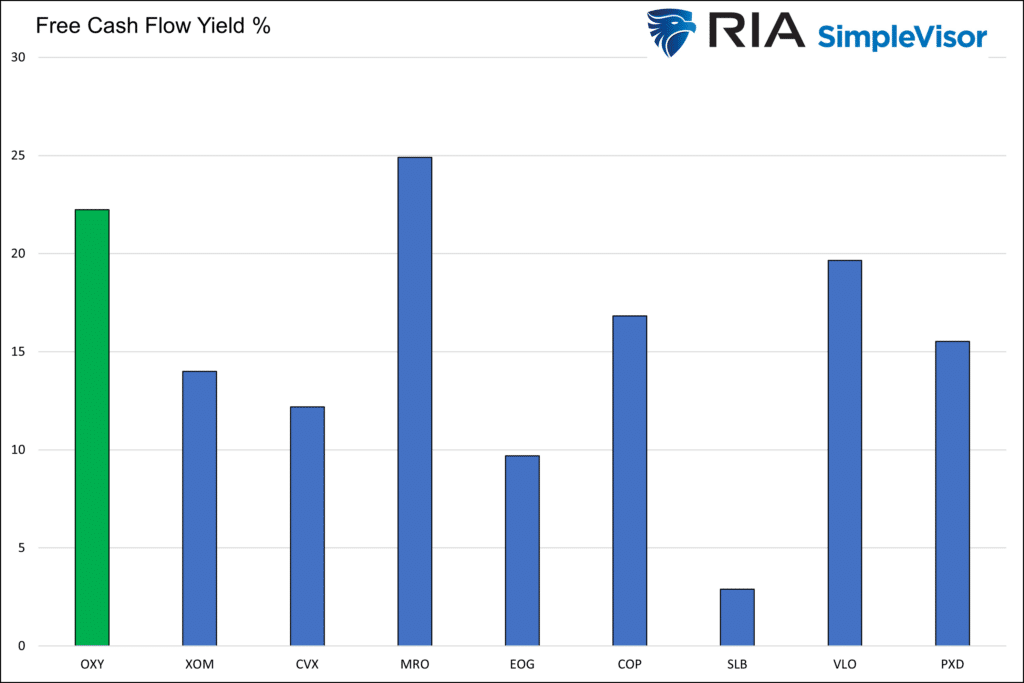
Occidental is a large international oil and gas exportation company headquartered in Houston, Texas. OXY is smaller than competitors like Exxon and Chevron offering shareholders more flexibility in managing its balance sheet. To this end, OXY has been reducing its debt and plans to use some of its free cash flow to repurchase shares. Berkshire Hathaway is a big fan of companies with strong free cash flows and share repurchases when said shares are “cheap.” OXY has a P/E of 5, almost half of those of XOM and CVX. As we share below, OXY has the highest free cash flow yield (free cash flow divided by market cap) amongst the U.S. largest oil and gas exploration and production companies. Free cash flow indicates the resources available for a company to reinvest in its operations and buy back shares.
What To Watch Today
Earnings

Economy

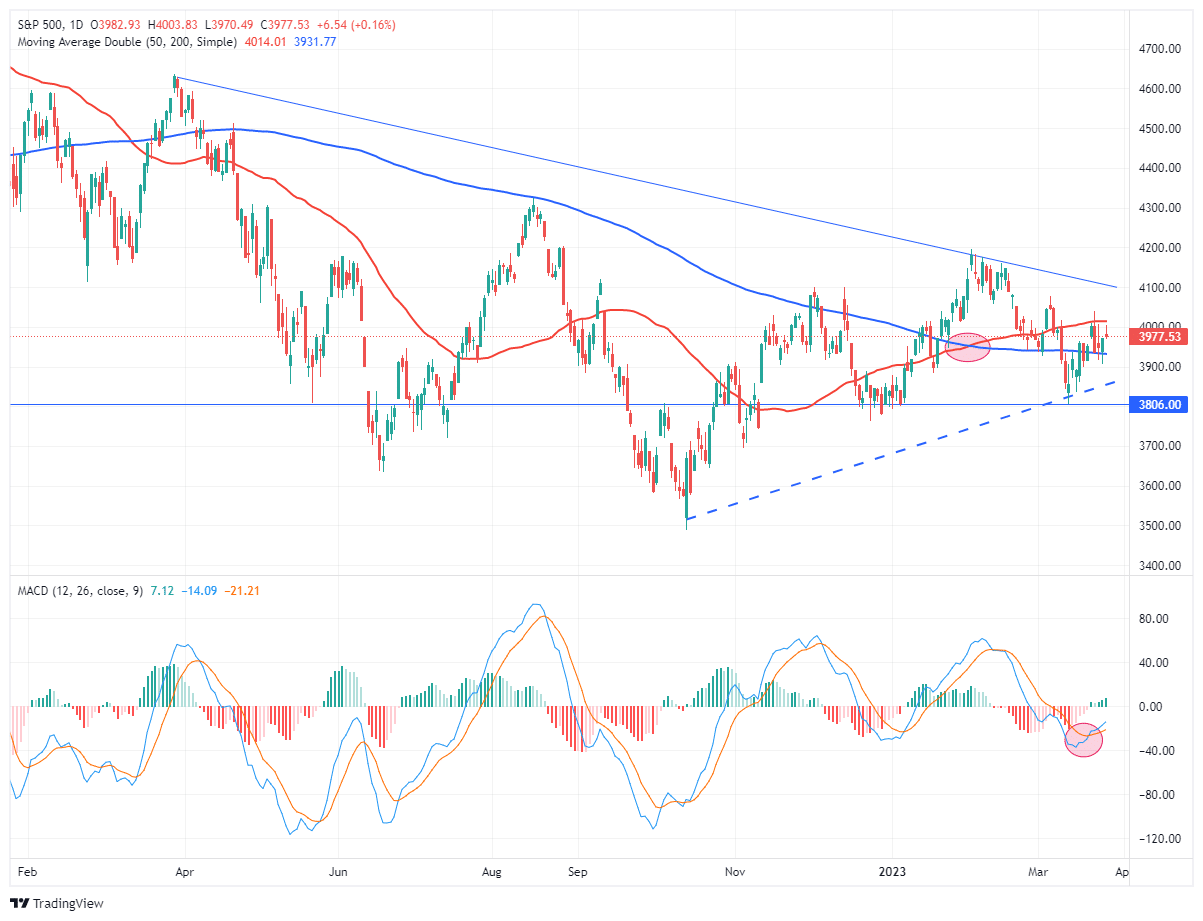
Market Trading Update
We usually cover the S&P 500 in our daily trading update, but not much has changed from yesterday. Therefore, take a look at the major industrialized and emerging market indices.
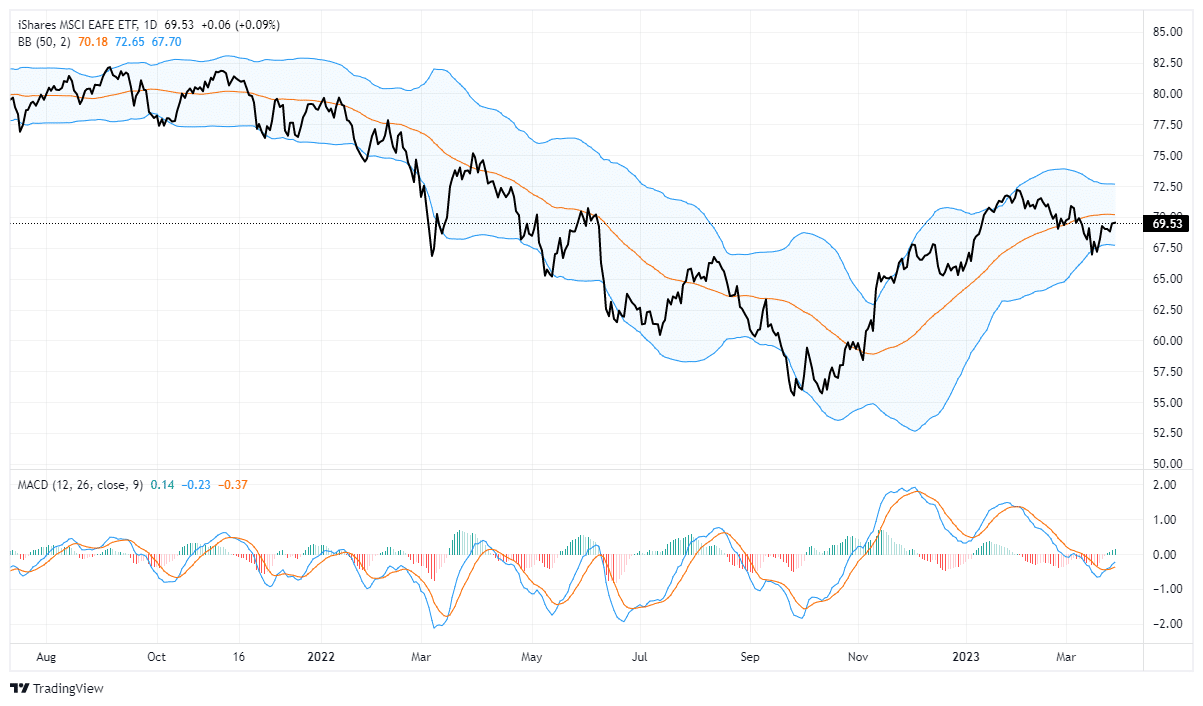
We use the MSCI EAFE ETF (EFA) as our proxy for international markets. Like the S&P, international stocks have declined over the last 2-months as global economies come under pressure from slower growth. However, in the short-term, international stocks are trigging a MACD buy signal which suggests a near-term trade back toward $72.50.
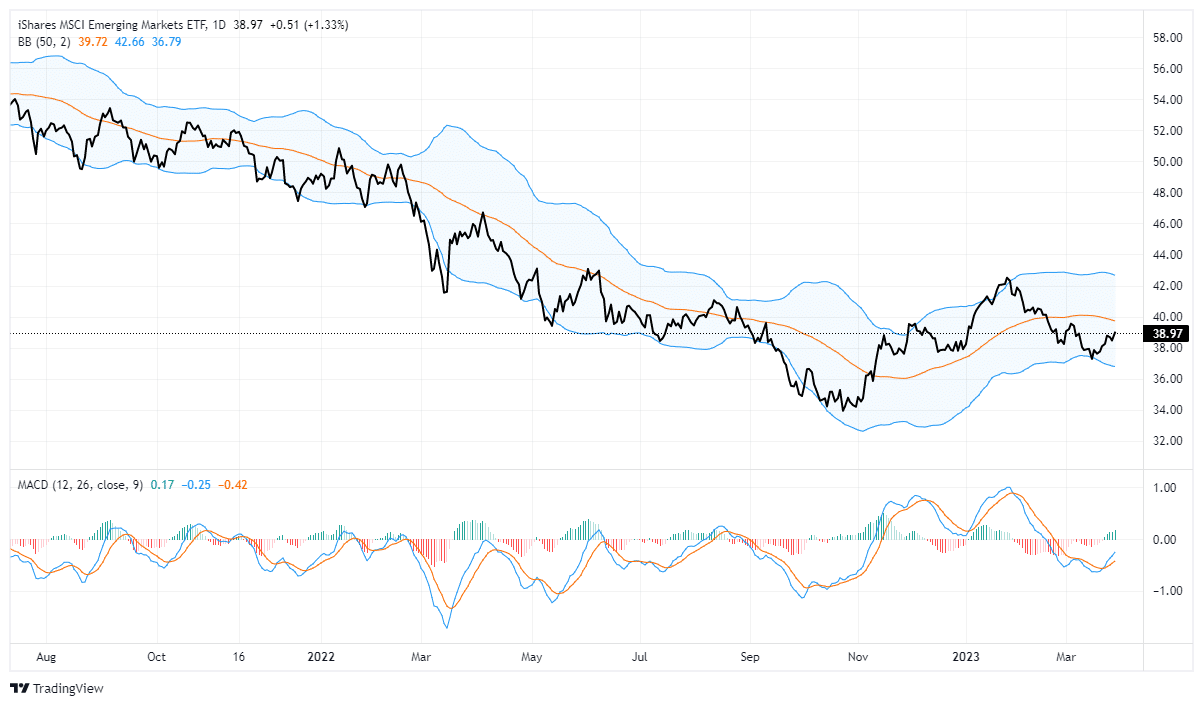
We use the MSCI Emerging Markets ETF (EEM) for emerging markets. Like EFA, it to is turning up onto a MACD buy signal following a decent decline from early March.
While both of these issues have a bullish trade setup short-term, I would be very cautious of the narrative these markets are cheap relative to U.S. stocks and are therefore set to outperform significantly. We heard much the same coming out of the financial crisis, and having an allocation to international and emerging market stocks has been a drag on portfolio performance for the last decade.
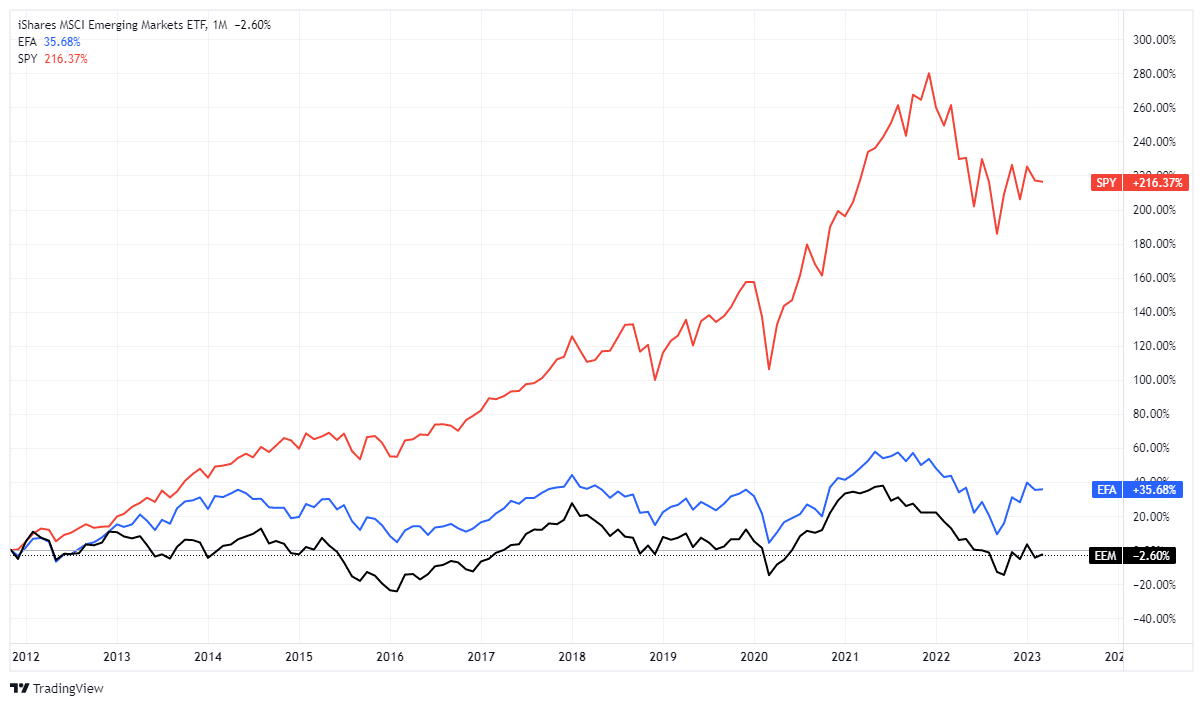
Diversification of portfolios is fine in theory until you attach “boat anchors.” That drag on performance over the long-term can significantly impair your ability to reach your financial goals.

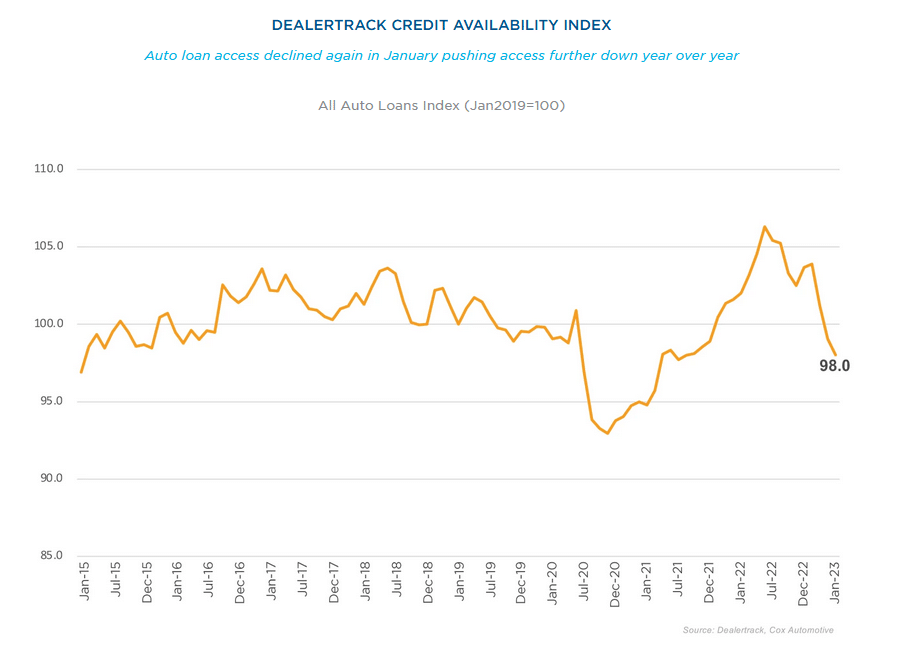
Auto Loan Delinquencies on the Rise
Auto loan delinquencies in the United States have reached a record high per commentary and data from Cox Automotive’s latest update.
Auto loan performance in January saw further deterioration. The delinquency rate for loans 60 or more days past due increased by 2% and was up 20.4% from a year ago. Of delinquent auto loans, 1.89% were severely delinquent, an increase from 1.84% in December and the highest rate in the data series back to 2006.
The high level of severe delinquencies has not led to equivalent growth in defaults, but defaults are growing. Loan defaults increased 6.2% from December and were up 33.5% from a year ago. The annualized auto loan default rate in January was 2.72%, which was lower than the 3.24% rate in January 2019. The default rate in 2022 was 2.28%, up from a low of 1.98% in 2021 but still below the 2.90% rate in 2019.
Typically auto loan defaults follow a few months after serious delinquencies. The second graph shows that credit conditions are tightening for auto loans. The data is two weeks old, so it has yet to reflect additional tightening by banks in light of recent events.

Why Are We Buying Equities?
A reader recently asked the question below. We share the answer to help you appreciate why we are buying stocks.
As of last week or so, having followed your views on the market for quite some time, I am a bit puzzled with your recent take on equities. I get the short term buy signals are in place and you are increasing your low exposure a tad but for the mid term outlook you now sound more optimistic in face of Fed accommodation due to banking bailout expectations, and left aside the more bearish Fed trap comments and evident recession. Aren’t we now closer to more severe recession/crisis fed having broken something, i.e. facing that ultimate trouble that has been brewing which you have also spoken at length and which in itself is bearish for equities?
Our short-term technical indicators are very bullish, so we bought stocks via trading positions in equity index ETFs. Additionally, the S&P 500 is above its 200dma. Since 1970, the S&P 500 has annualized 25.45% returns when trading above its 200dma. That is about 16% above the average market return over the period.
We still think that a recession and lower stock prices are likely. However, markets and economies are dynamic, with nothing set in stone. While we attribute a smaller probability, there are scenarios in which a bullish soft landing occurs, and stocks race to new highs.
It turns out that when most investors were very bearish accompanying the gloom of the pandemic in late March 2020, that was the best time to get bullish. Similarly, the market rallied for two months after Bear Stearns was bailed out, despite the writing being on the wall for more problems to come. Markets tend to have an optimistic bias and often are slow to price in negative events until they become apparent.
The bottom line is we make fundamental longer-term trades and manage our exposure with shorter-term trades and hedges at times. We also focus on the type and volatility of the stocks and sectors we own and their correlation to equity indices. Many stocks were up last year despite the lower trend in stock indices. We maintain stop losses on all positions and will not hesitate to sell if our technical analysis proves wrong.
Investing is very humbling. As such, avoiding a single-track mindset about what you think might happen is essential.
Tape the following quote onto your monitor as a reminder that markets don’t do what most people think.
“The main purpose of the stock market is to make fools of as many people as possible.” – Bernard Baruch
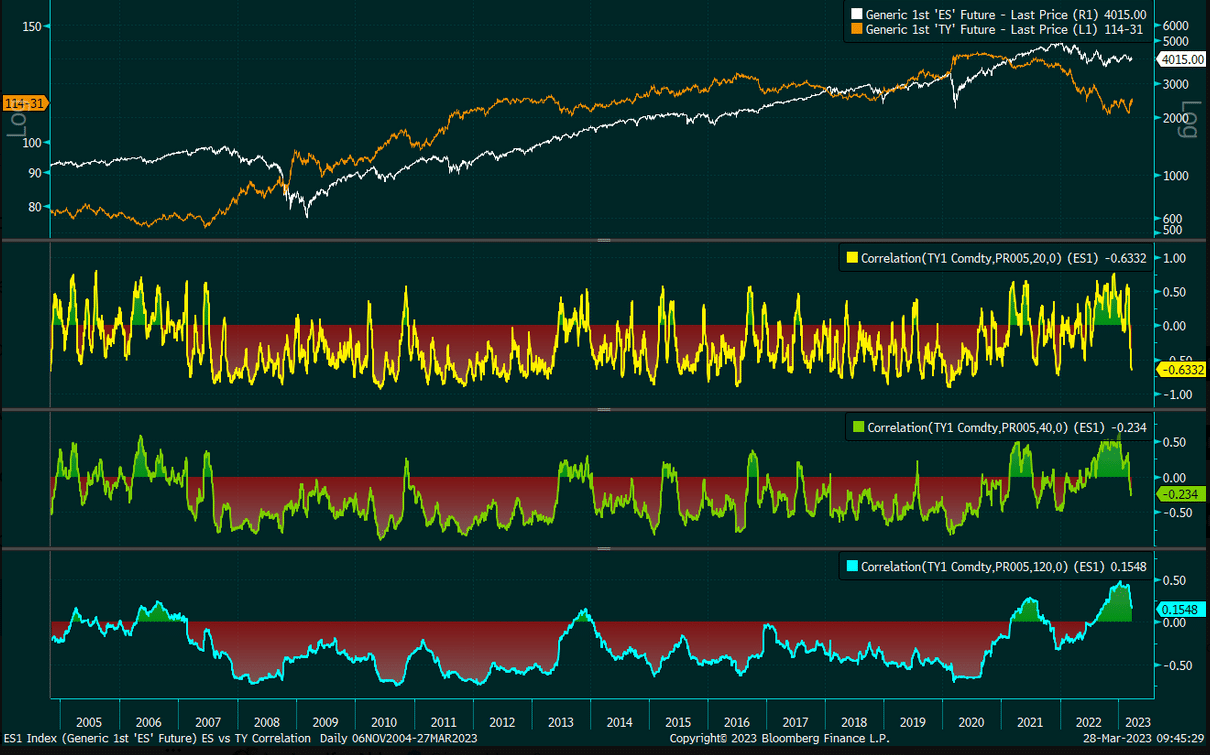
Statistical Correlations Between Stocks and Treasury Bonds
The Bloomberg graph below, courtesy of @allbullnobear8, charts the correlation of stock and bond prices over rolling 20, 40, and 120-day periods. Starting in late 2020, the correlation between stocks and bonds rose from its normal negative relationship to a positive one. In other words, it was becoming more common for stock prices to rise as ten-year note prices rose (yields declined). The relationship strengthened through 2022 as stock and bond prices registered approximately 20% declines.
In recent months, the relationship is starting to work its way toward a more historically negative relationship. If the negative relationship continues, hedging stocks with bonds should prove much more fruitful than the previous few years.
Tweet of the Day

Please subscribe to the daily commentary to receive these updates every morning before the opening bell.
If you found this blog useful, please send it to someone else, share it on social media, or contact us to set up a meeting.