


Inside This Week’s Bull Bear Report
- Bull Rally Fails As Bears Regain Control
- Yes, Valuations Matter
- How We Are Trading It
- Research Report – Small Business Sales Send A Warning
- Webinar – Everything You Need To Know To Retire Well
- Stock Of The Week
- Daily Commentary Bits
- Market Statistics
- Stock Screens
- Portfolio Trades This Week
Bull Rally Fails As Bears Regain Control
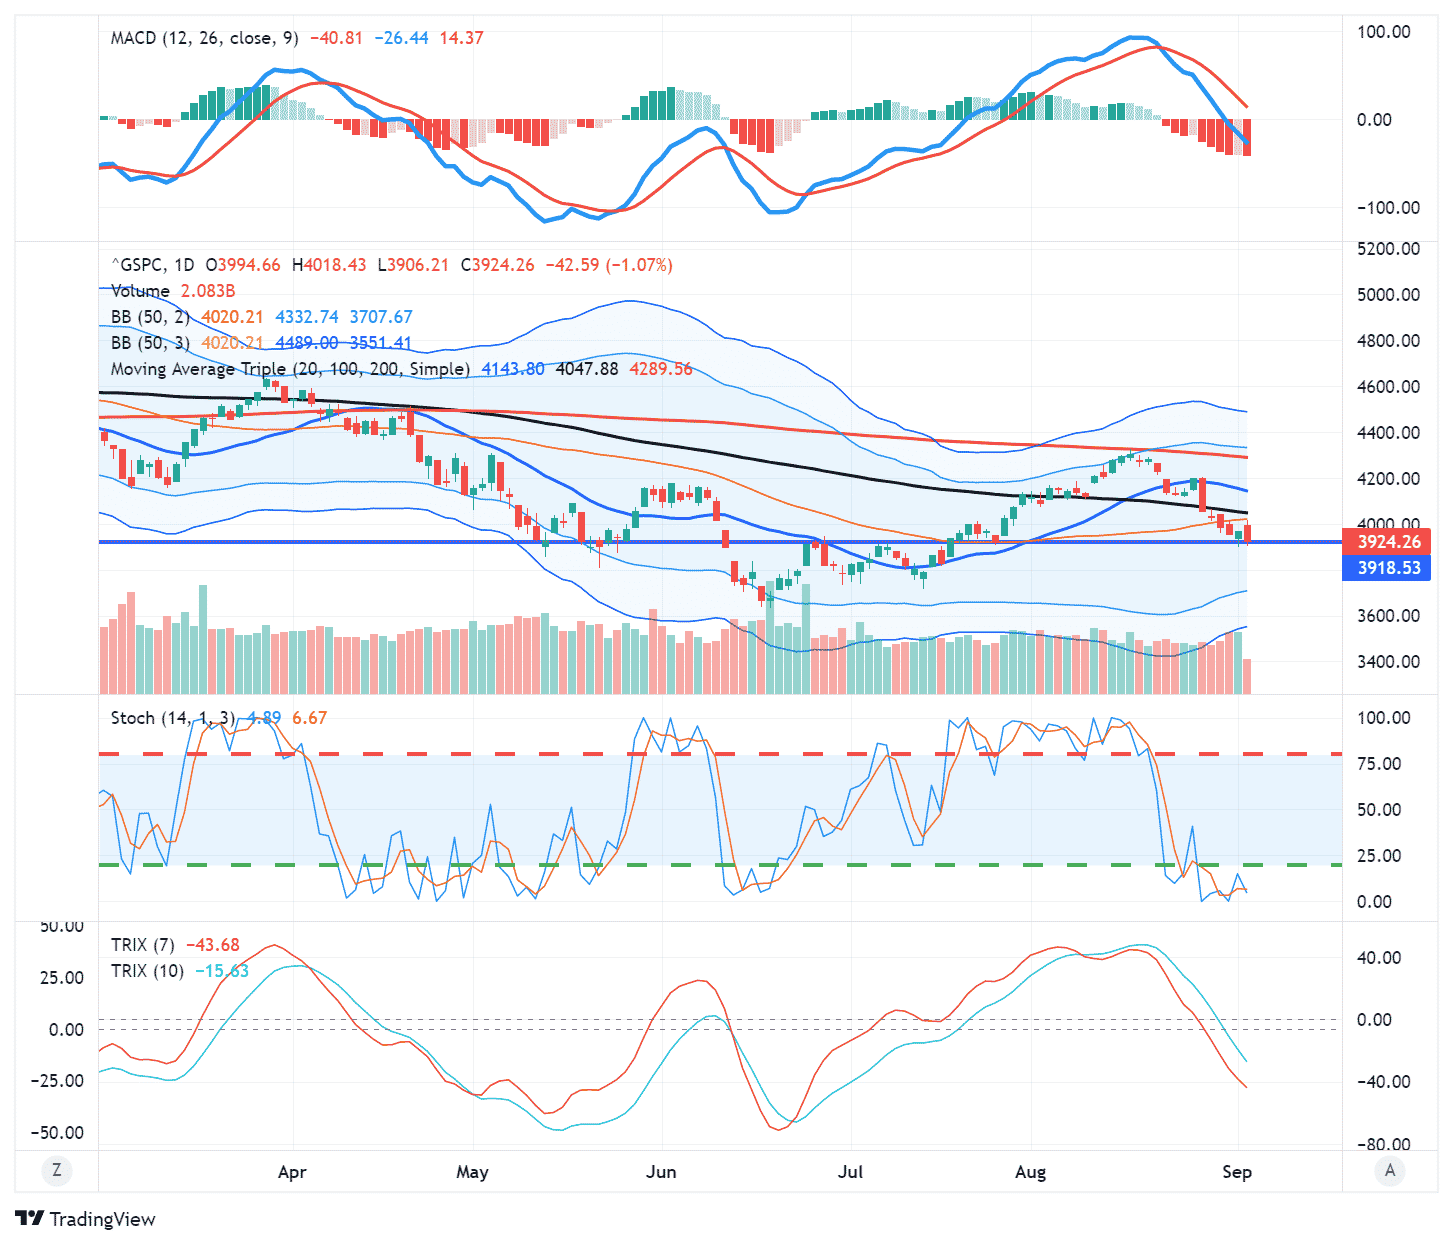
The bull rally failed as those stating the rise from the July lows was a “bear market rally” were proven correct. As we stated last week:
The break of the 100-dma also sets the market up for a retest of the 50-dma next week. Given the sharp market sell-off on Friday, some follow-through selling on Monday would be of no surprise.”
That was the case as the market sold off sharply all week, taking out the important 50-day moving average. However, with the markets deeply oversold, a reflexive bounce is likely. On Friday, the market attempted a test to break above the 50-dma, but failed. With the market sitting on important support, an attempt at a rally next week is likely. However, with the MACD on a “sell signal,” we continue to suggest selling any rallies to reduce risk.
Unfortunately, the bull rally’s failure suggests more challenges for the stock market. As noted by Yahoo Finance:
“The historically volatile month of August lived up to its reputation.
Call it par for the course for 2022, as the Federal Reserve’s resolve to fight inflation again beat back the most optimistic bulls holding out for the elusive Powell pivot.
By the numbers: The Nasdaq Composite sank another 4.6% in August, bringing its year-to-date return to -24.5%. Meanwhile, the Dow is now off 4,828 points for the year, or 13.2%, and the S&P 500 is 17% in the hole.”
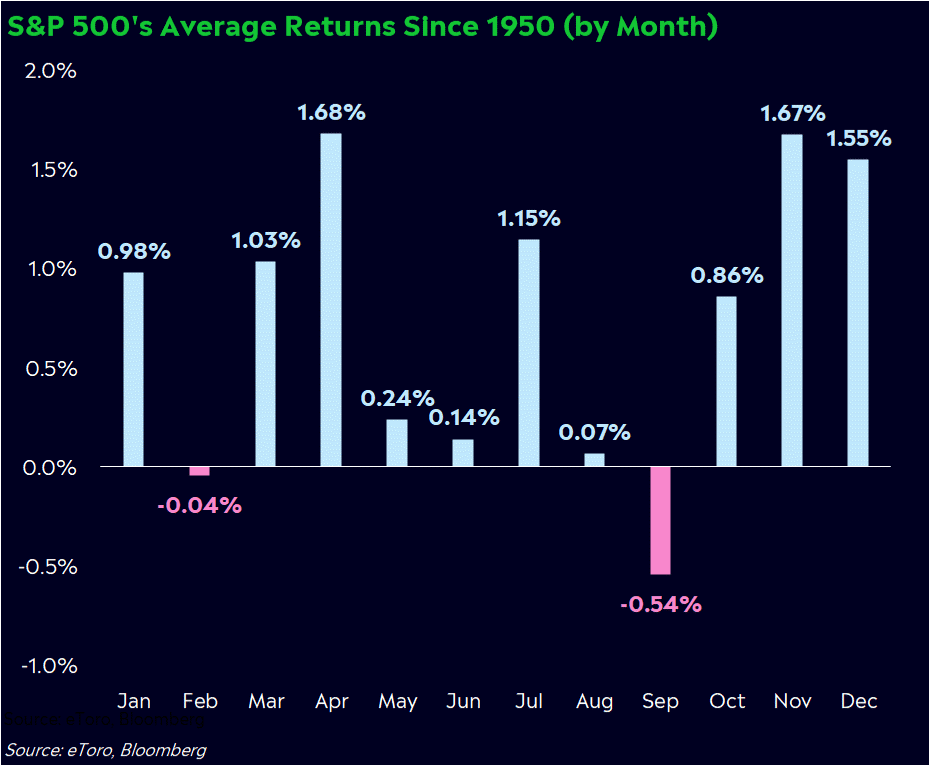
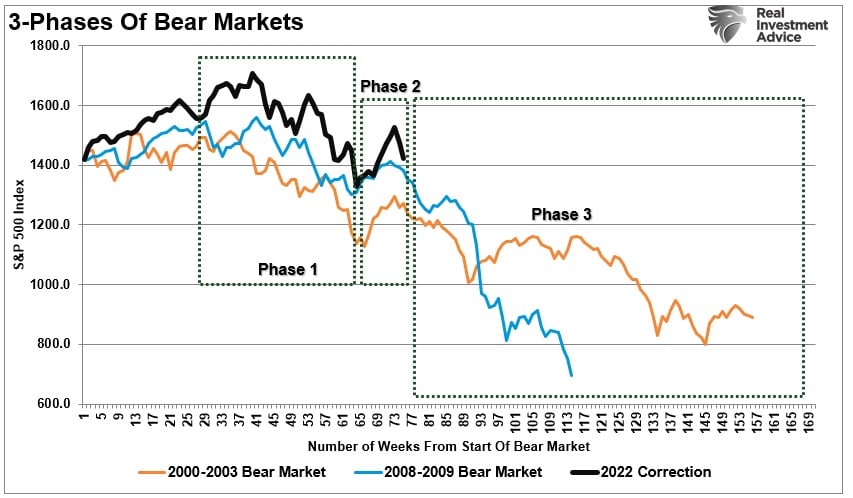
Unfortunately, for investors, the market history books suggest that when markets have negative returns this far into the year, it portends more weakness and volatility into year-end.
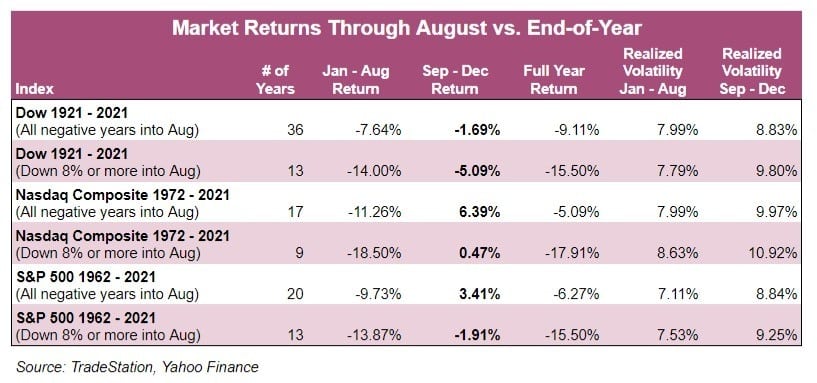
Furthermore, while we could certainly see another bull rally from currently very oversold conditions, the month of September offers little hope. October tends not to be kind, either.
While the market is focused on Federal Reserve rate hikes, little attention is paid to the “elephant in the room.”
That elephant is the $95 billion in “Quantitative Tightening” that started this month.
QT Hits Full Strength
In our Daily Market Commentary (subscribe for free daily email) we discussed the Fed’s balance sheet unwind, aka Quantitative Tightening (QT), which is now at $95 billion a month.
“The plan is to allow 60 billion in U.S. Treasury bonds and 35 billion of mortgages to mature monthly. The Fed may let additional Treasury Bills mature to reach their 95 billion goals if there are not enough mortgages maturing or paying down in a given month. With the step up in QT comes reduced liquidity for the banking system and financial markets.
The 2018 episode of QT taught us that liquidity dries up over time, and the effects take a while to be felt. The more illiquid markets and market participants relying heavily on leverage will feel the impact first. Given the 95 billion monthly paces of QT is almost double the rate of 2018, the adverse liquidity effects may occur sooner this time. Below we provide a summary of an important white paper on QT presented at the Jackson Hole Conference.”
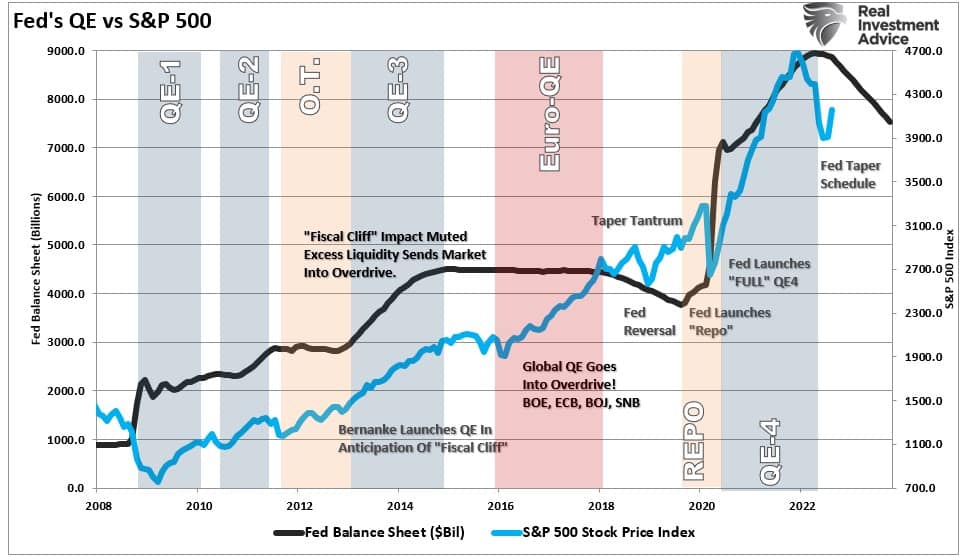
It is important to look back at 2018 when the Fed last tried to reduce its balance sheet. The market response was a sharp selloff into December, leading to a Fed bailout of hedge funds and banks through “reverse repurchases operations” in 2019.
As noted, the rate of QT is twice that of any previous period in history. With the Fed increasing rates, it’s worth noting how QT negatively impacts liquidity. The 58-page Fed white paper by Viral V. Acharya on the topic of QT and liquidity got presented at the recent Jackson Hole Conference. Cross Border Capital highlights a few of the paper’s key points.
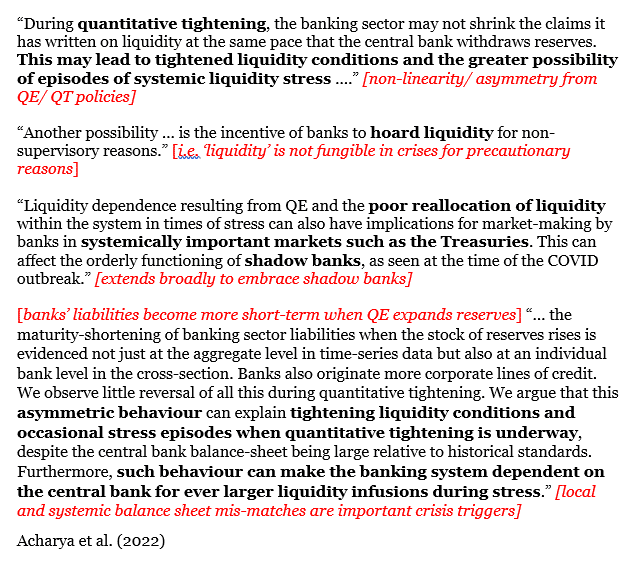
To summarize:
- Point 1– Banks may use the excess liquidity during QE to make loans, including those like margin debt used for speculative purposes. During QT, however, they may not reduce their loan book, thus effectively reducing net liquidity available to others.
- Point 2– Banks, understanding that liquidity is declining, may “hoard” excess liquidity. Such actions reduce system-wide liquidity.
- Point 3– Liquidity is allocated poorly during QE. When removed, it can have unequal stress on Treasury markets, where banks rely heavily on liquidity to maintain balanced two-way flows.
- Point 4– During QE, banks tend to loan money for shorter time periods. This can be for speculative purposes and short-term loans. In many cases, the short loans need to roll over once they mature. With QT draining liquidity, stress can occur as the borrowers may struggle to borrow to pay off the original loans. Such can result in the forced liquidation of assets to repay the original loan.
The bottom line is that another primary support of the bull market rally since 2009 is now removed.
The Buffett Indicator
I am writing a longer discussion of the “Buffett Indicator,” but the following note from Chartr is a good primer.
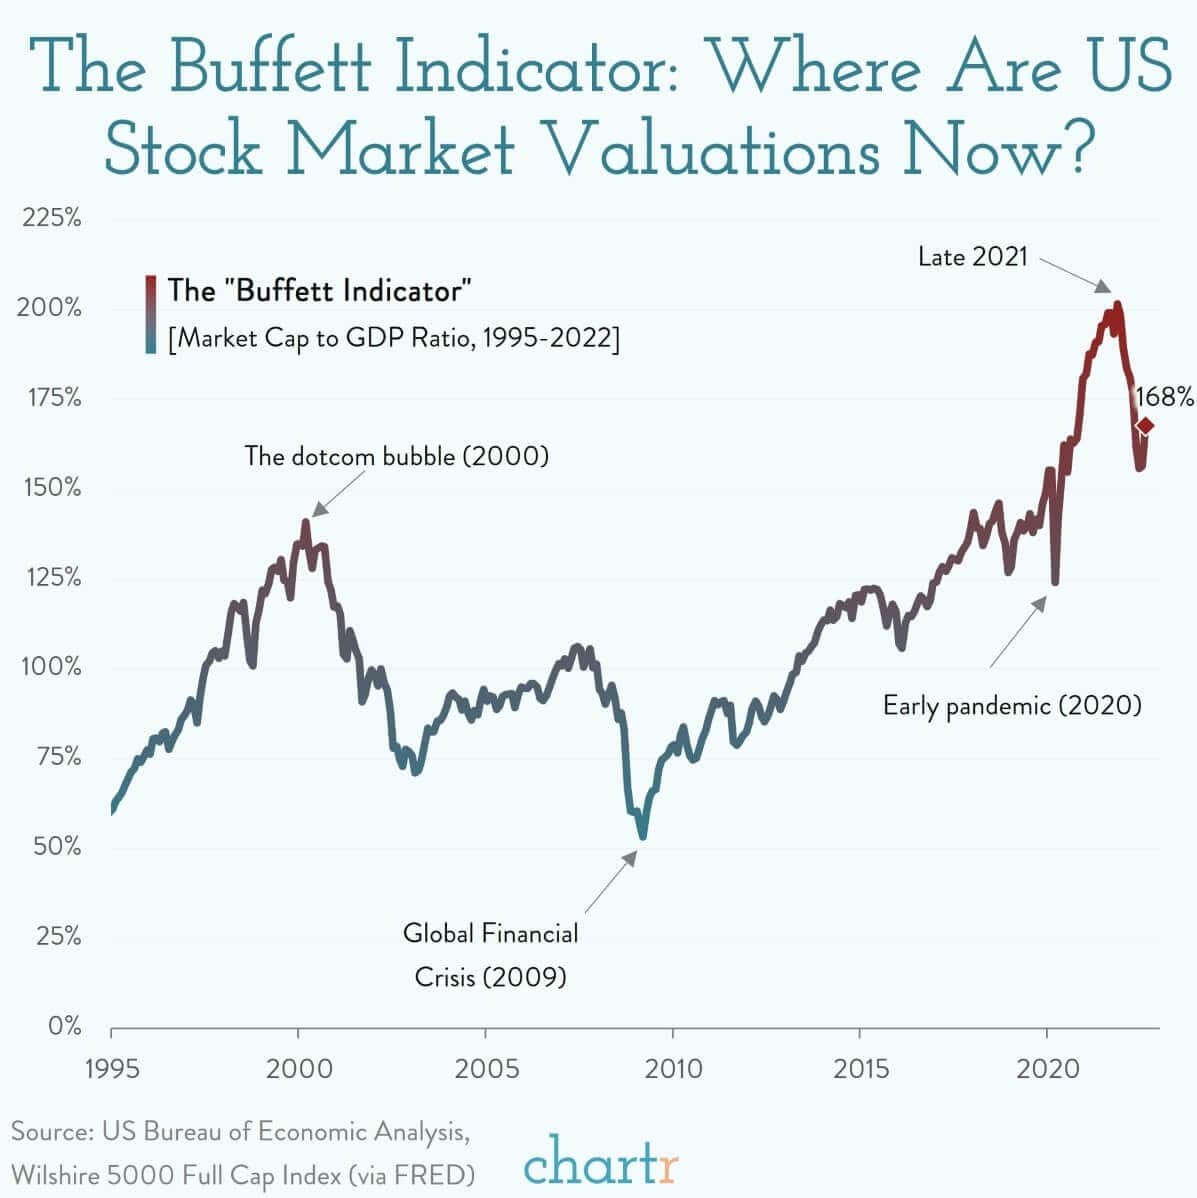
“The recent stock market moves left us wondering where equity valuations were. With hundreds of different ways to value stocks, we settled on arguably the simplest: the ratio of total market cap. to GDP. It’s a simple metric that compares the total value of public equities with the actual economic output of the country as a whole.
A favorite of a certain Warren Buffett, the indicator currently sits just shy of 170%. That number doesn’t mean much on its own, but when placed in historical context, it’s striking. Even after the recent fall in markets, the ratio is still one of the highest on record, north of the ~140% recorded during the dot-com bubble of 2000, and considerably elevated compared to the average since 1995 (109%).” – Chartr
Since 2009, repeated monetary interventions and zero interest rate policies led many investors to dismiss any measure of “valuation.” The reasoning is that since there was no immediate correlation, the indicator is wrong.
The problem is that valuation models are not, and were never meant to be, “market timing indicators.” The vast majority of analysts assume that if a measure of valuation (P/E, P/S, P/B, etc.) reaches some specific level it means that:
- The market is about to crash, and;
- Investors should be in 100% cash.
Such is incorrect. Valuation measures are simply just that – a measure of current valuation. More importantly, when valuations are excessive, it is a better measure of “investor psychology” and the manifestation of the “greater fool theory.”
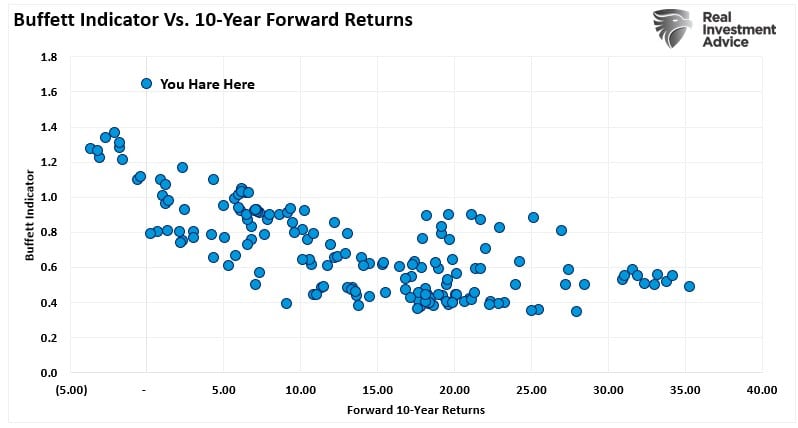
What valuations do provide is a reasonable estimate of long-term investment returns. It is logical that if you overpay for a stream of future cash flows today, your future return will be low.
The chart below uses the Willshire 5000 Market Capitalization versus GDP and is calculated on quarterly data versus 10-year forward returns. Foreward returns over the next 10 years could be disappointing at current valuation levels.
The Rule Of 20
The “Rule Of 20” further confirms what the “Buffett Indicator” suggests.
To calculate the “Rule Of 20″ we combine the P/E ratio and inflation rate. Over the years, markets have shown a distinct tendency to revert to a sum of 20 for these two metrics. In other words, the stock market is undervalued when the sum is below 20 and overvalued when the sum is above 20. This seemingly simplified insight is nonetheless surprisingly effective, as noted by Evercore ISI:
- Markets rarely trade at equilibrium, so it’s no surprise that the “Rule of 20” is seldom precise.
- The combined P/E ratio and inflation rate have ranged from a low of 14 to a high of 34.
- Over the last 50 years, the average P/E is just below 16, the average inflation rate is 4%, and the average sum of P/E and inflation, as expected, is close to 20.
The rule peaked at the 2nd highest level in history earlier this year. Such levels suggest the market is more than “fully priced.” Regardless of what definition you choose to use.

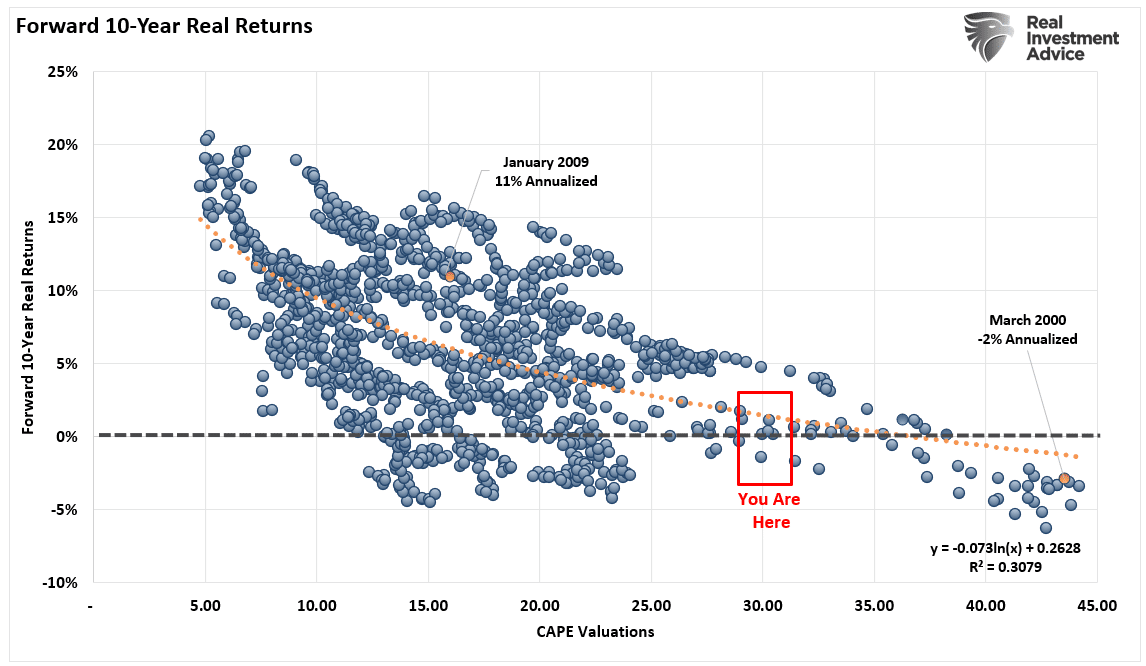
As Howard Marks noted, the math suggests forward 10-year returns will be substantially lower than the last.
In a market where momentum drives an ever smaller group of participants, fundamentals become displaced by emotional biases.
With the “Rule Of 20” very elevated, the Fed reversing monetary accommodation, and inflation and wages impacting earnings and margins, the risk of a further “bear market” decline is not entirely unreasonable.
As monetary policy becomes more restrictive and high inflation erodes economic growth, the market will have to reprice for lower sales, margins, and earnings. As such, if we are indeed in a “bear market” and not just a “correction,” then we have more work to do.
Not Getting The Bull Bear Report Each Week In Your Mailbox? Subscribe Here For Free.
Everything You Need To Know To Retire Well
Subscribe To Our Youtube Channel To Get Notified Of All Our Videos
How We Are Trading It
The failure of the bull rally was not surprising. With the Fed tightening monetary policy to combat inflationary pressures, the hopes for a “pivot” were premature. The bull rally did reverse some of the extremely negative sentiment, which was needed for the bear market to reassert itself.
The discussion on valuations and forward returns should not be dismissed. The Fed has been clear that inflicting “some pain” on the economy and, ultimately, the markets should be expected. As the Fed tightens monetary policy, slower economic growth will make currently elevated valuations much more difficult to justify. Consequently, lower prices should be expected, particularly if a recession takes hold.
While we made no changes to our portfolio last week, we are looking for a short-term rally to increase our cash levels and reduce overall portfolio risk.
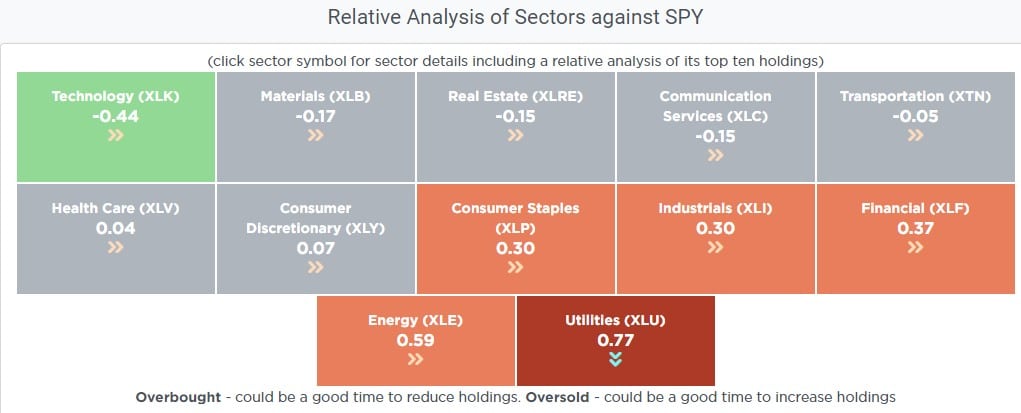
Looking at our Relative Sector Analysis in SimpleVisor.com, Utilities are overbought relative to the overall market. Such suggests that if we get a short-term sellable rally, we could see some selling in the Utilities sector and some buying in Technology which is currently oversold relative to the market.
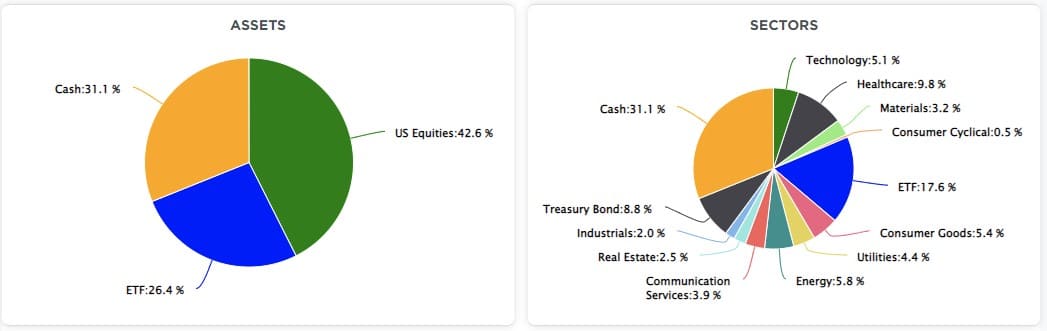
Given that we had no trades this past week, our portfolio allocation remains the same, with an overweight position in cash and underweight in both bonds and stocks. Again, as noted, we will likely raise additional cash on any rally next week.
Stick To Your Process
There is a sizable contingent of investors, and advisors, who have never been through a real bear market. Therefore, it remains important to follow your investment discipline. If you don’t have one, here is the process we follow during tough markets.
- Move slowly. There is no rush to make dramatic changes. Doing anything in a moment of “panic” tends to be the wrong thing.
- If you are overweight equities, DO NOT try and fully adjust your portfolio to your target allocation in one move. Again, after big declines, individuals feel like they “must” do something. Think logically above where you want to be and use the rally to adjust to that level.
- Begin by selling laggards and losers. These positions were dragging on performance as the market rose, and they led on the way down.
- Add to sectors, or positions, that are performing with or outperforming the broader market if you need risk exposure.
- Move “stop-loss” levels up to recent lows for each position.
- Be prepared to sell into the bull rally and reduce overall portfolio risk. There are many positions you will sell at a loss simply because you overpaid for them to begin with. Selling at a loss DOES NOT make you a loser. It just means you made a mistake. Sell it, and move on with managing your portfolio. Not every trade will always be a winner. But keeping a loser will make you a loser of both capital and opportunity.
- If none of this makes sense to you, please consider hiring someone to manage your portfolio. It will be worth the additional expense over the long term.
I hope this helps.
Need Help With Your Investing Strategy?
Are you looking for complete financial, insurance, and estate planning? Need a risk-managed portfolio management strategy to grow and protect your savings? Whatever your needs are, we are here to help.

Research Report

Stock Of The Week In Review – Got Newmont?
Newmont Mining (NEM) is the largest gold miner sporting a market cap of $32 billion. The chart below shows the price of NEM which is down 50% over the last few months and is back to levels last seen during the Covid meltdown in 2020. It is also approaching a major support line. The previous time NEM traded at $40, gold was nearly $300/ounce cheaper than it is today.

Investing in gold is problematic given that real rates are rising and the Fed remains aggressive. Such circumstances have not boded well for gold in the past. That said, NEM and other miners are down much more than gold over the last month or two. Might they be approaching a bottom even if gold continues to decline? NEM has an attractive risk/reward setup, especially with a stop loss limit slightly below the trend line. Additionally, the dividend yield on NEM is up to 5.3%.

Login to Simplevisor.com to read the full 5-For-Friday report.
Daily Commentary Bits
Bear Market Wealth Management
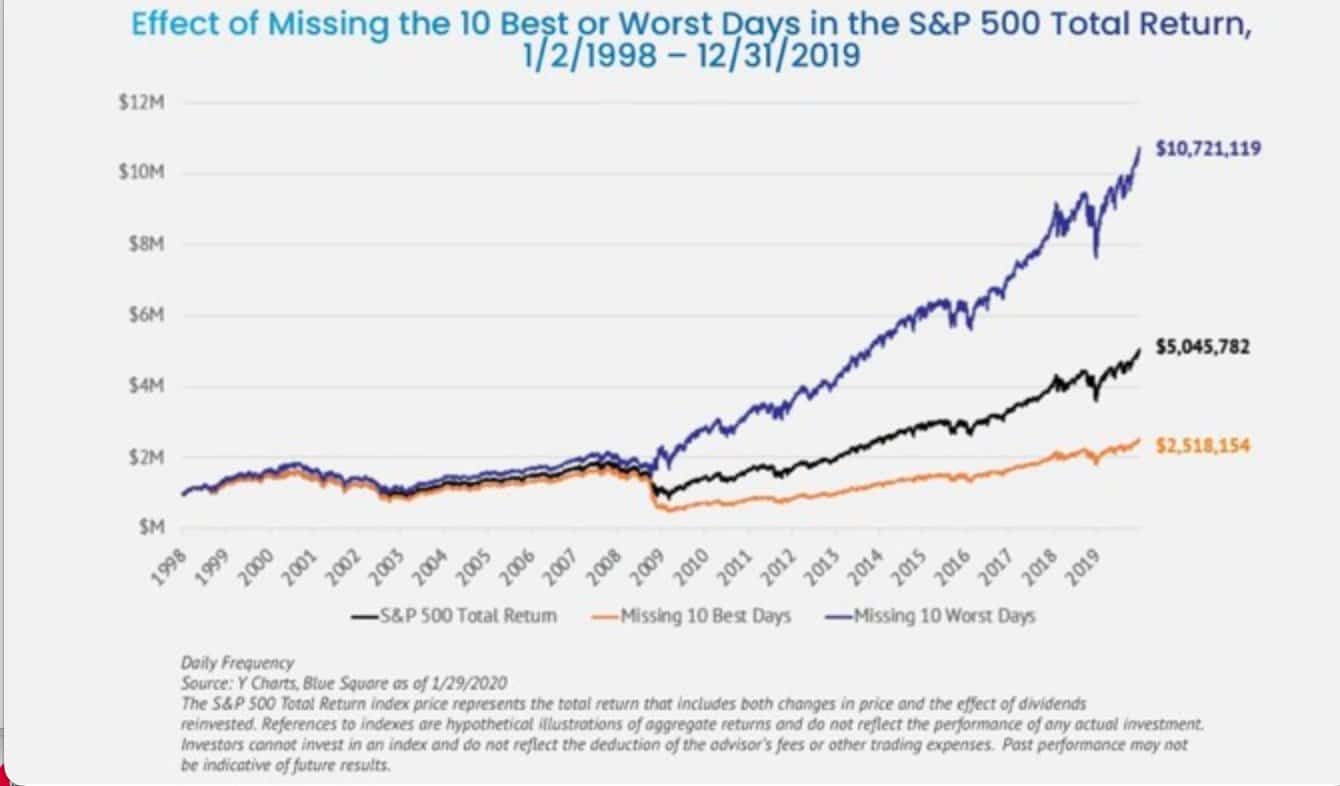
On Wednesday, we published Bear Market Wealth Management. The article served as a simple reminder that limiting losses in a bear market greatly benefits growing long-term wealth. Unfortunately, we stumbled upon the graph below after we published it. The chart further highlights the benefit of reducing stock holdings in a bear market. As it shows, if one only missed the ten worst days in the last 20 years, their wealth would be double that of a simple buy-and-hold S&P 500 strategy. Realize, however, that sitting out for too long can also be a problem. Missing the ten best days would leave you with half the wealth of the S&P 500 buy-and-hold strategy.
Click Here To Read The Latest Daily Market Commentary (Subscribe For Pre-Market Email)
Bull Bear Report Market Statistics & Screens
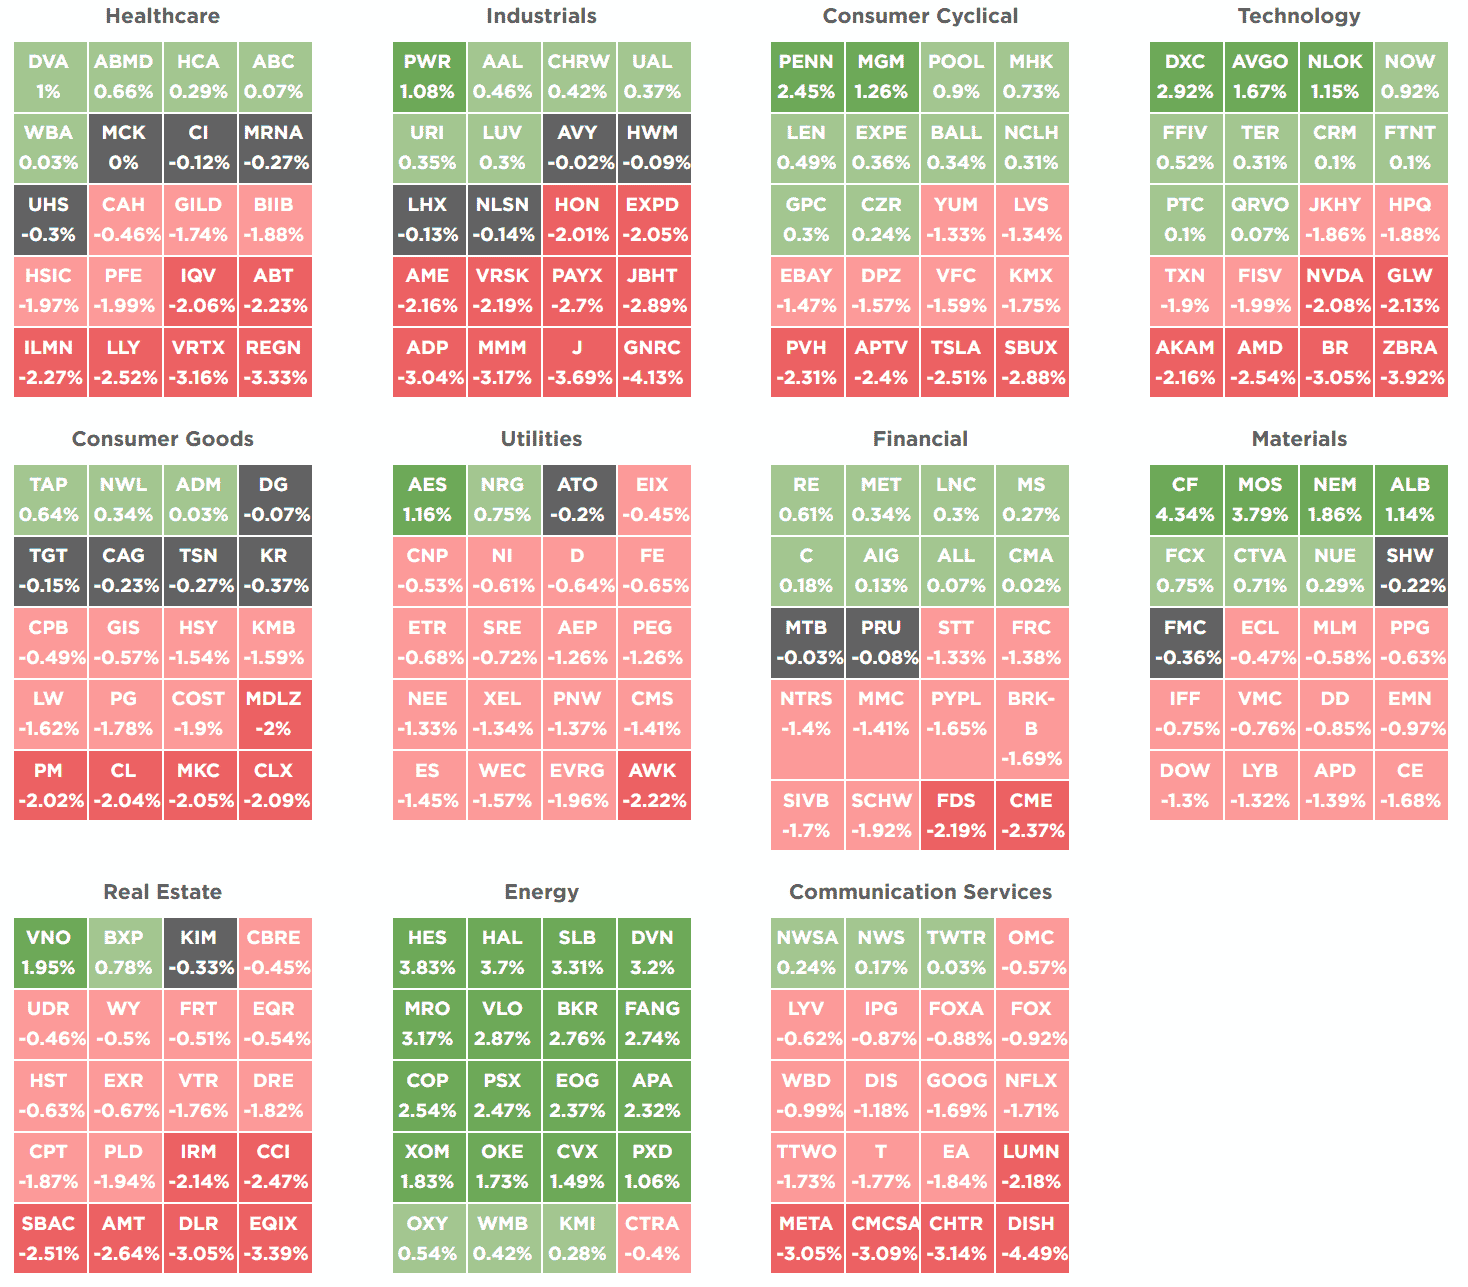
SimpleVisor Top & Bottom Performers By Sector
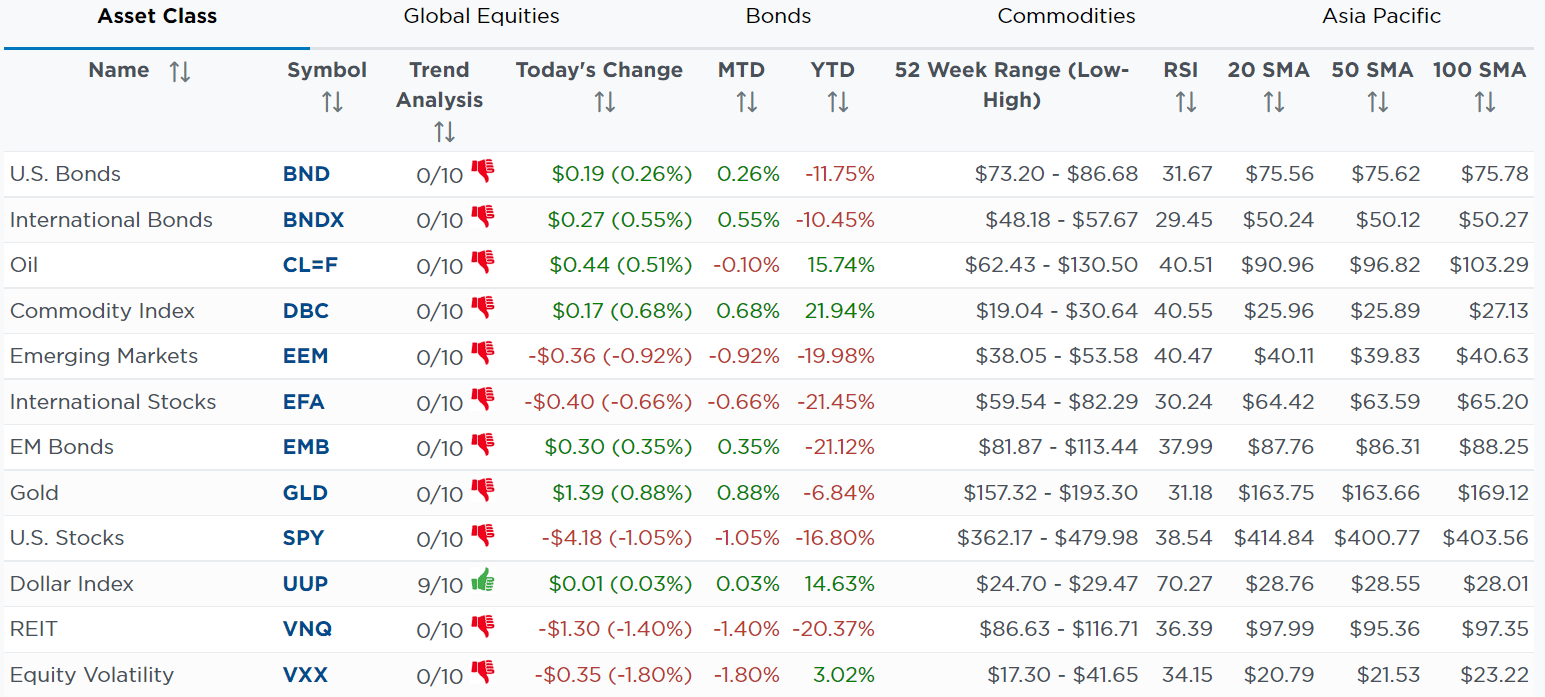
SimpleVisor Asset Class Trend Analysis
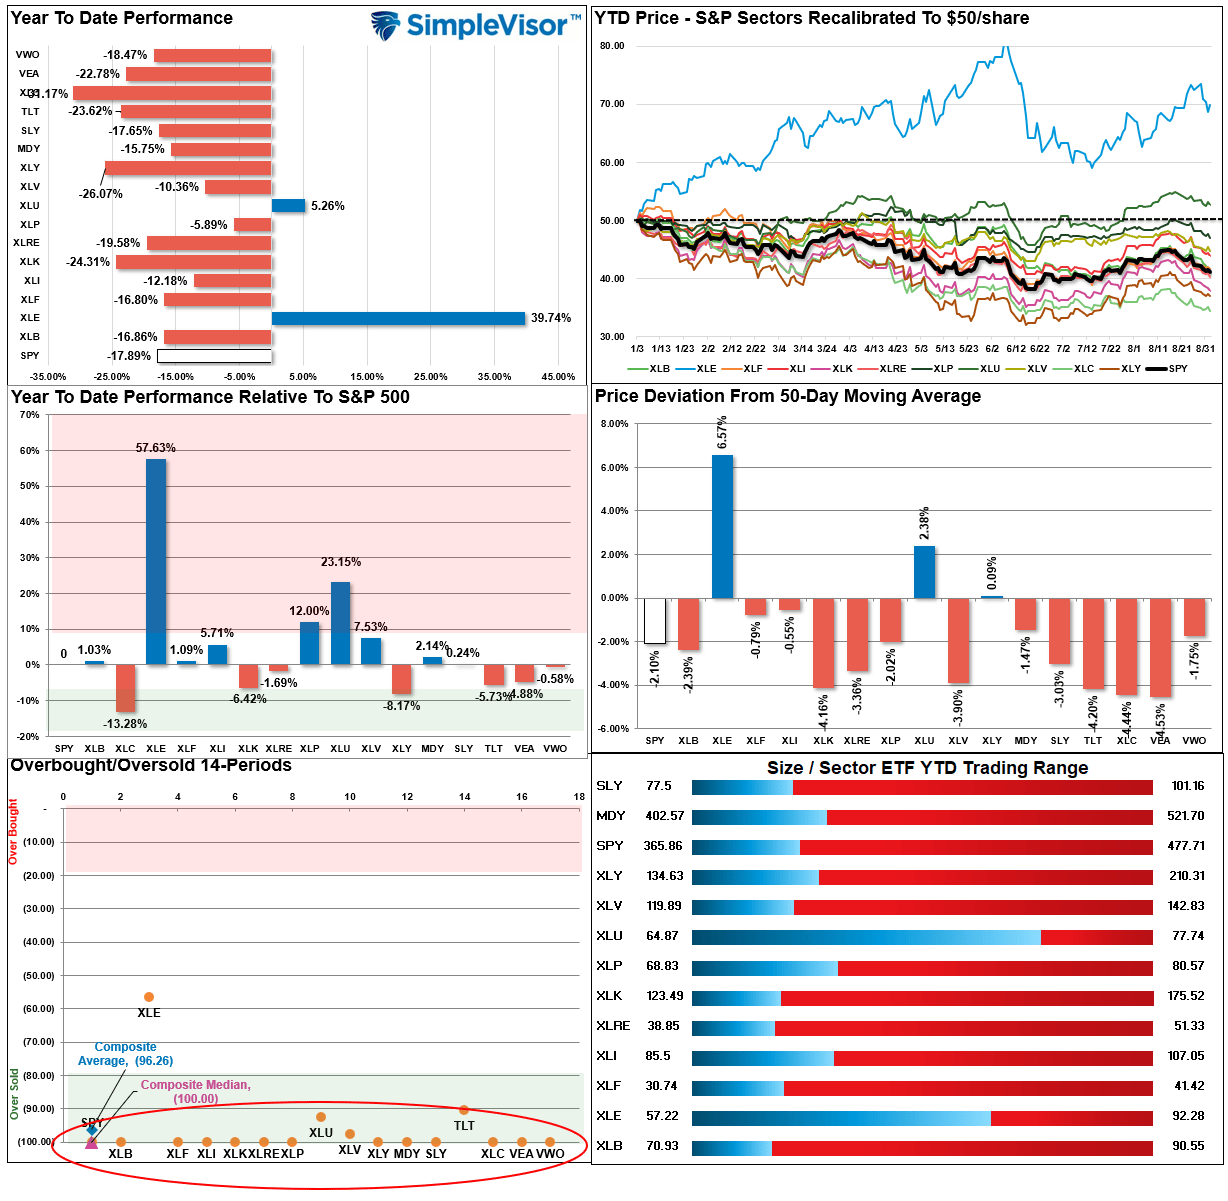
Relative Performance Analysis
In just the last two weeks, the market has fully reversed the bull rally and pushed back into an extreme overbought condition. Such was what our previously analysis suggested would happen.
“The market surge pushed EVERY MARKET and SECTOR into extreme overbought territory. As is usually the case, this analysis indicates the market has likely extracted the majority of the rally, so taking profits remains a profitable strategy.“
Last week, we stated that “price deviations from the 50-dma (middle right panel) remain very extended, suggesting this correction may have more work to do.”
We are likely due for a decent counter-trend rally as almost every sector and market are now extremely OVERSOLD and deviations are reduced. Use rallies to take profits and rebalance risk.
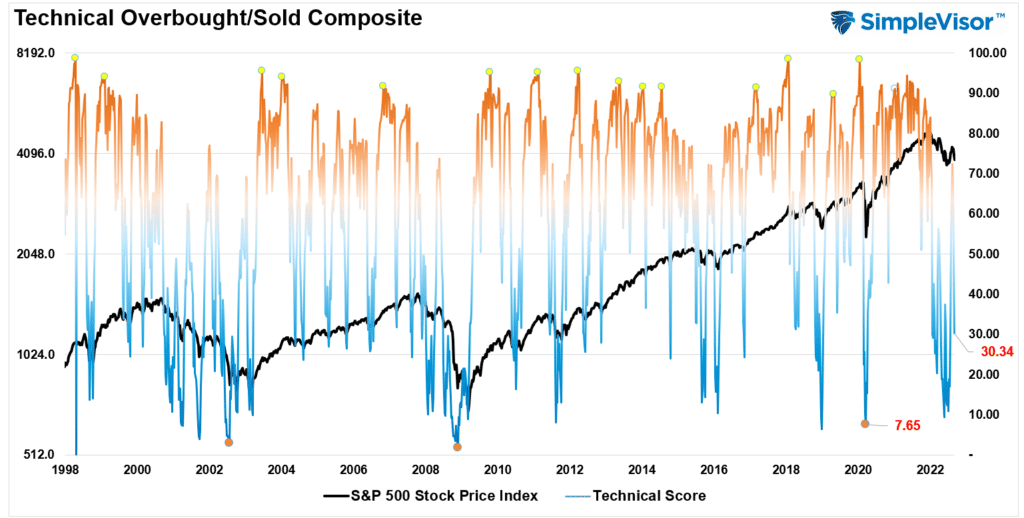
Technical Composite
The technical overbought/sold gauge comprises several price indicators (RSI, Williams %R, etc.), measured using “weekly” closing price data. Readings above “80” are considered overbought, and below “20” are oversold. Markets tend to peak when readings are at 80 or above, which suggests profit taking and risk management are prudent. The best buying opportunities exist when readings are 20 or below.
The current reading is 30.34 out of a possible 100 and rising. Remain long equities for now.
Portfolio Positioning “Fear / Greed” Gauge
The “Fear/Greed” gauge is how individual and professional investors are “positioning” themselves in the market based on their equity exposure. From a contrarian position, the higher the allocation to equities, to more likely the market is closer to a correction than not. The gauge uses weekly closing data.
NOTE: The Fear/Greed Index measures risk from 0 to 100. It is a rarity that it reaches levels above 90. The current reading is 56.68 out of a possible 100.

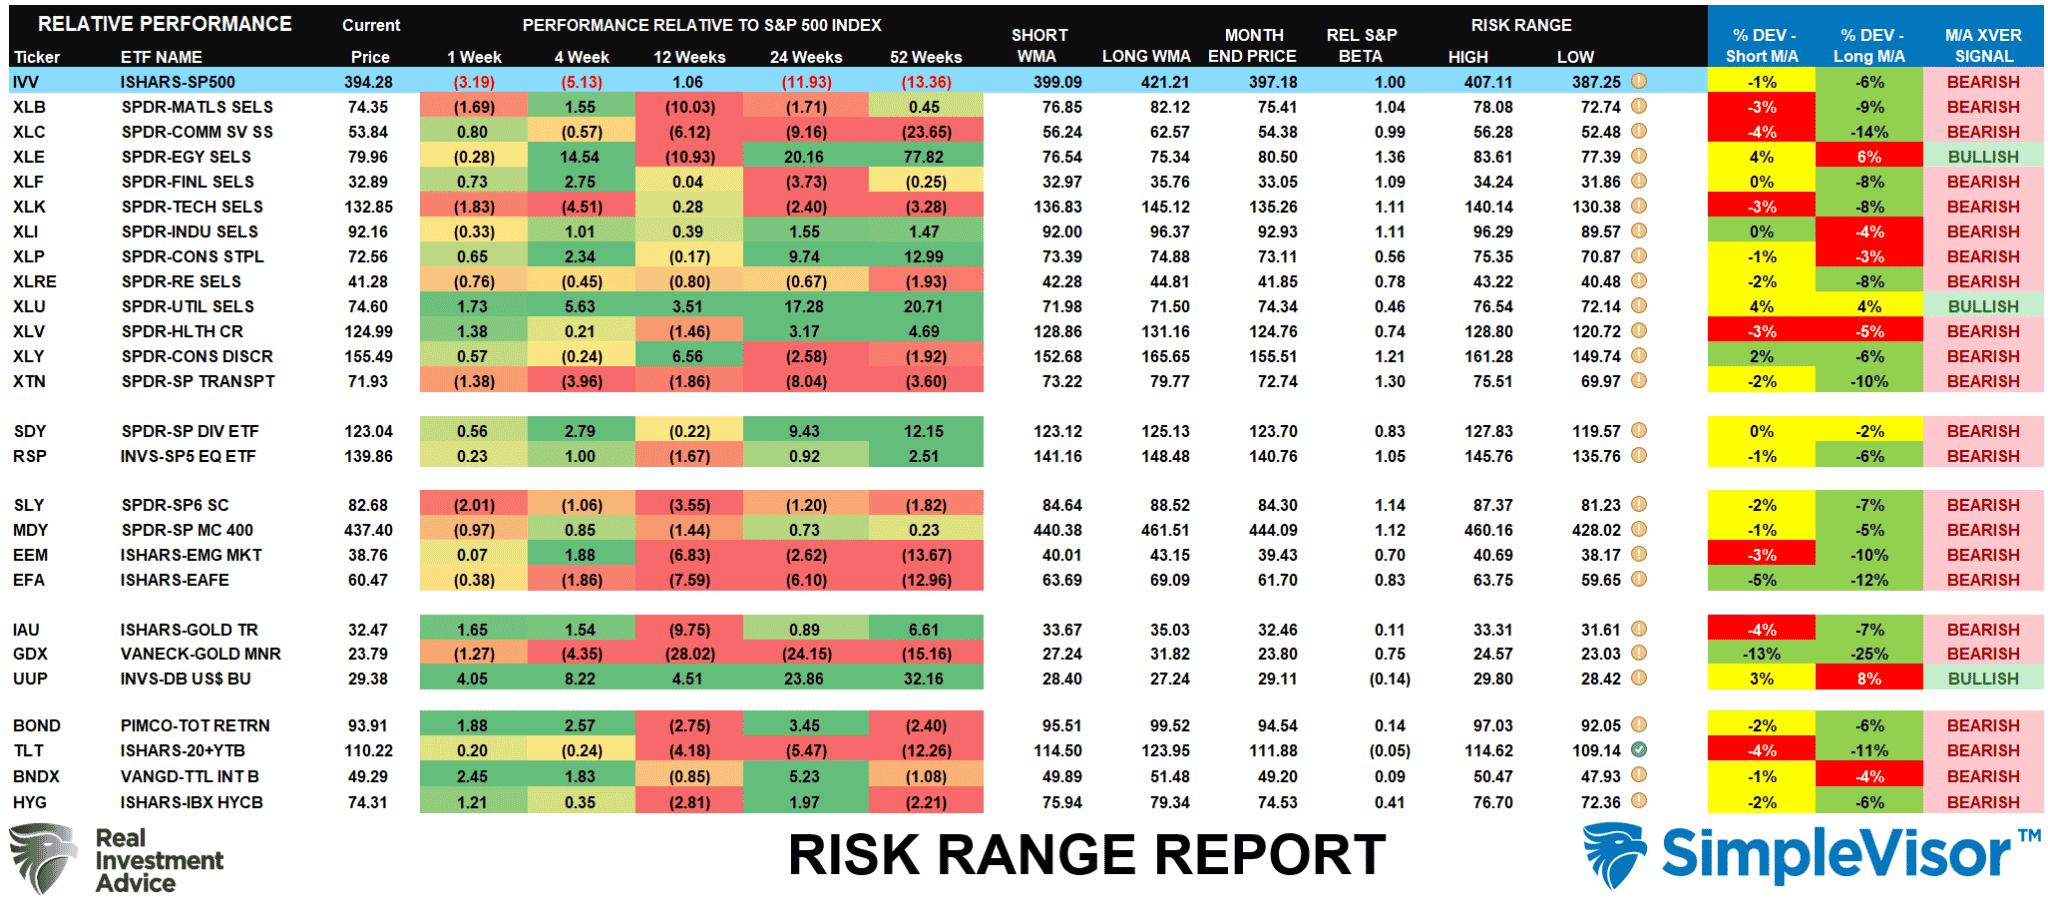
Sector Model Analysis & Risk Ranges
How To Read This Table
- The table compares the relative performance of each sector and market to the S&P 500 index.
- “M/A XVER” is determined by whether the short-term weekly moving average crosses positively or negatively with the long-term weekly moving average.
- The risk range is a function of the month-end closing price and the “beta” of the sector or market. (Ranges reset on the 1st of each month)
- The table shows the price deviation above and below the weekly moving averages.
Two weeks ago we stated that with “just two weeks into the month, many markets and sectors are trading well above their historical monthly trading ranges. Such usually is not sustainable.” We also stated that a pullback was likely this past week from that analysis.
The risk/range report has reset for the month of September. However, there are still sectors at risk that are trading double-digit deviations from their respective long-term means. Bonds, Communications and International holdings may see some rotational inflows as they remain grossly oversold.
Weekly SimpleVisor Stock Screens
Each week we will provide three different stock screens generated from SimpleVisor: (RIAPro.net subscribers use your current credentials to log in.)
This week we are scanning for the Top 20:
- Relative Strength Stocks
- Momentum Stocks
- Technically Strong With Strong Fundamentals
These screens generate portfolio ideas and serve as the starting point for further research.
(Click Images To Enlarge)
RSI Screen

Momentum Screen

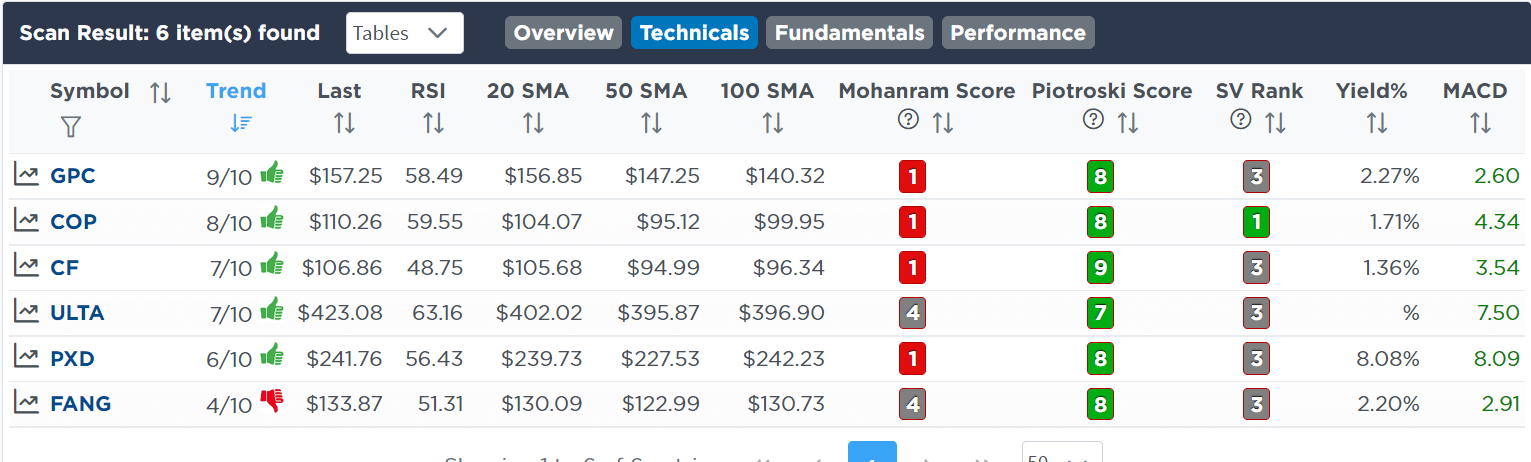
Technical & Fundamental Strength Screen
SimpleVisor Portfolio Changes
We post all of our portfolio changes as they occur at SimpleVisor:

Lance Roberts, CIO
Have a great week!


Lance Roberts is a Chief Portfolio Strategist/Economist for RIA Advisors. He is also the host of “The Lance Roberts Podcast” and Chief Editor of the “Real Investment Advice” website and author of “Real Investment Daily” blog and “Real Investment Report“. Follow Lance on Facebook, Twitter, Linked-In and YouTube
Customer Relationship Summary (Form CRS)