


J. Brett Freeze and his firm Global Technical Analysis (GTA) provides RIA Pro subscribers Cartography Corner on a monthly basis. Brett’s analysis offers readers a truly unique brand of technical insight and risk framework. We personally rely on Brett’s research to help better gauge market trends, their durability, and support and resistance price levels.
GTA presents their monthly analysis on a wide range of asset classes, indices, and securities. At times the analysis may agree with RIA Pro technical opinions, and other times it will run contrary to our thoughts. Our goal is not to push a single view or opinion, but provide research to help you better understand the markets. Please contact us with any questions or comments. If you are interested in learning more about GTA’s services, please connect with them through the links provided in the article.
The link below penned by GTA provides a user’s guide and a sample of his analysis.
September 2022 Review
E-Mini S&P 500 Futures
We begin with a review of E-Mini S&P 500 Futures (ESZ2) in September 2022. In our September 2022 edition of The Cartography Corner, we wrote the following:
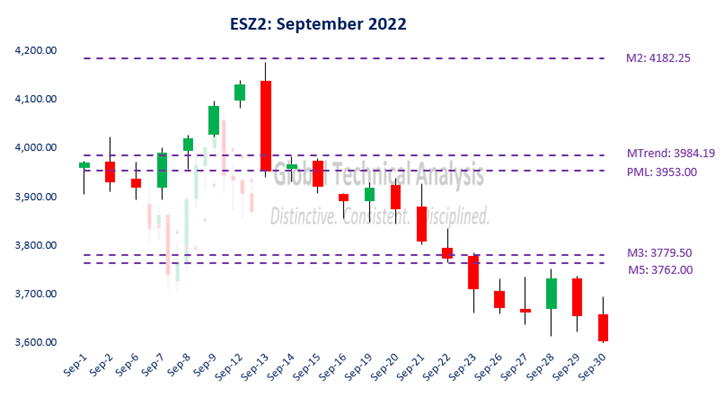
In isolation, monthly support and resistance levels for September are:
o M4 4931.25
o M1 4511.00
o PMH 4327.50
o M2 4182.25
o MTrend 3984.19
o Close 3956.50
o PML 3953.00
o M3 3779.50
o M5 3762.00
Active traders can use PML: 3953.00 as the pivot, maintaining a long position above that level and a flat or short position below it.
Figure 1 below displays the daily price action for September 2022 in a candlestick chart, with support and resistance levels isolated by our methodology represented as dashed lines. The second and third trading sessions saw the market price descend and settle below our isolated pivot at PML: 3953.00. In the fourth trading session the market price reversed higher, surging, and settling above clustered resistance at PML: 3953.00 / MTrend: 3984.19. The following four trading sessions saw the market ascend higher towards our isolated resistance level at M2: 4182.25.
On September 13th, early in New York trading hours, the market price peaked for September at 4175.00. The market price then reversed, settling that trading session at 3950.25, below our isolated pivot level at PML: 3953.00. Over the following seven trading sessions, the market price descended to our isolated Monthly Downside Exhaustion level at M5: 3762.00. The final six trading sessions saw the market price consolidate, within a wide range, below our isolated Monthly Downside Exhaustion.
Active traders following our analysis, conservatively, realized a profit of +7.3%.
Figure 1:
Random Length Lumber
We continue with a review of Random Length Lumber Futures (LBX2) during September 2022. In our September 2022 edition of The Cartography Corner, we wrote the following:
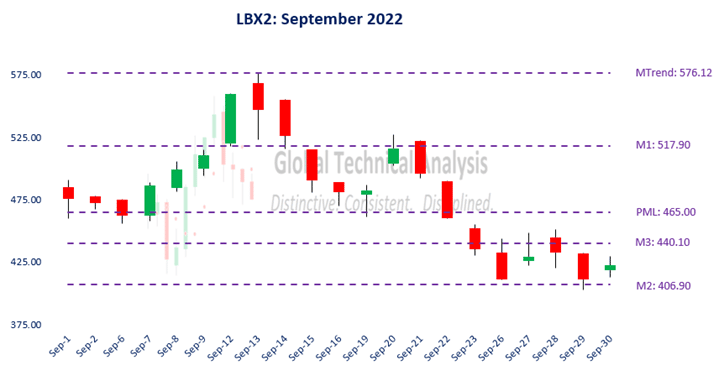
In isolation, monthly support and resistance levels for September are:
o M4 744.30
o PMH 633.70
o MTrend 576.12
o M1 517.90
o Close 483.60
o PML 465.00
o M3 440.10
o M2 406.90
o M5 180.50
Active traders can use PML: 465.00 as the initial pivot, maintaining a long position above that level and a flat or short position below it.
Figure 2 below displays the daily price action for September 2022 in a candlestick chart, with support and resistance levels isolated by our methodology represented as dashed lines. The first three trading sessions saw the market price descend to, and settle below, our isolated pivot level at PML: 465.00. In the fourth trading session the market price reversed higher, surging, and settling above PML: 465.00. The following four trading sessions saw the market ascend higher towards our isolated resistance level at MTrend: 576.12.
On September 13th, early in New York trading hours, the market price peaked for September at 576.70. The market price then reversed, settling that trading session at 546.60. Over the following four trading sessions, the market price descended back to our isolated pivot level at PML: 465.00. The final seven trading sessions saw the market price descend to, and consolidate above, our isolated support level at M2: 406.90.
Active traders following our analysis, conservatively, realized a profit of +24.9%.
Figure 2:
October 2022 Analysis
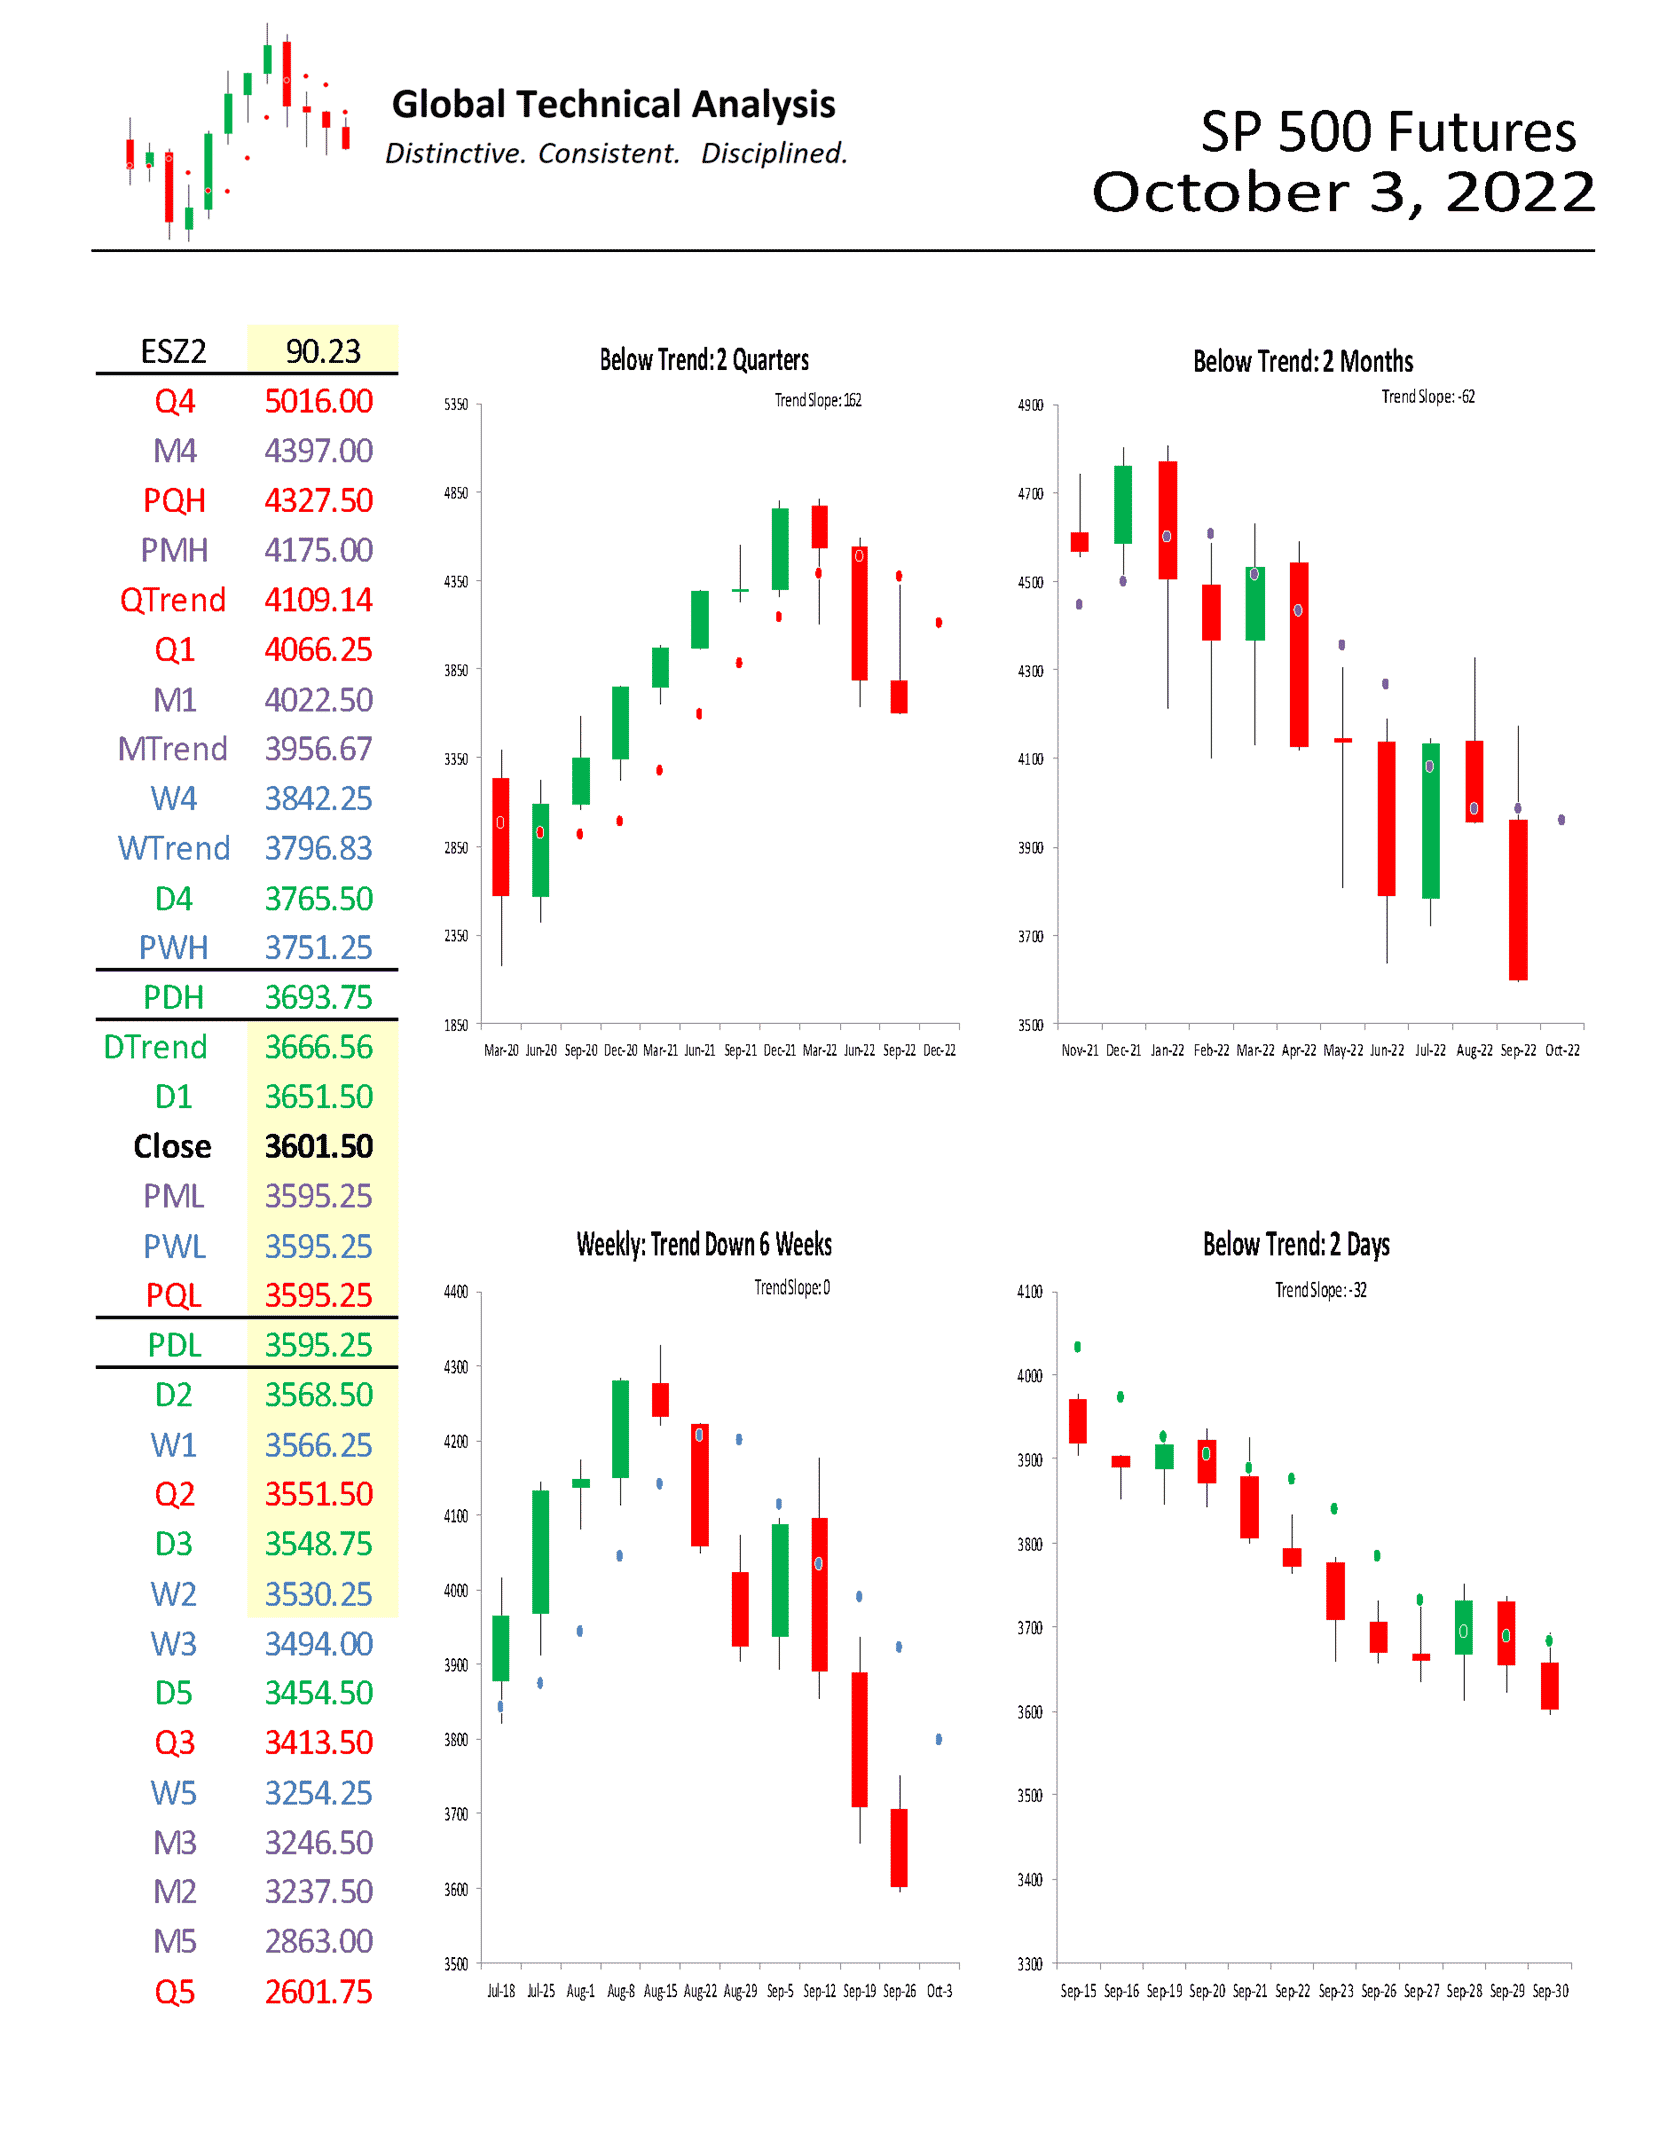
We begin by providing a monthly time-period analysis of E-Mini S&P 500 Futures (ESU2). The same analysis can be completed for any time-period or in aggregate.
Trends:
o Quarterly Trend 4109.14
o Monthly Trend 3956.67
o Weekly Trend 3796.83
o Daily Trend 3666.56
o Current Settle 3601.50
The relative positioning of the Trend Levels is maximum bearish. Think of the relative positioning of the Trend Levels like you would a moving-average cross. In the quarterly time-period, the chart shows that E-Mini S&P 500 Futures are “Below Trend: 2 Quarters”, after having been above Quarterly Trend for eight quarters. Stepping down one time-period, the monthly chart shows that E-Mini S&P 500 Futures are “Below Trend: 2 Months”. Stepping down to the weekly time-period, the chart shows that E-Mini S&P 500 Futures are “Trend Down: 6 Weeks”.
One rule we have is to anticipate a two-period high (low), within the following four to six periods, after a Downside (Upside) Exhaustion level has been reached. A signal was given in September to anticipate a two-month high within the next four to six months. That high can be achieved in October with a trade above 4327.50.
Monthly Momentum, which measures the distance of the market price from where all the trading activity has occurred over a specific number of months, is neutral. Trend Persistence, which measures the strength of the trend across multiple periods, is neutral as well. (Neutral is defined as not being in the tails of the distribution.) Our clients can view those charts on our website.
In isolation, monthly support and resistance levels for October are:
o M4 4397.00
o PMH 4175.00
o M1 4022.50
o MTrend 3956.67
o Close 3601.50
o PML 3595.25
o M3 3246.50
o M2 3237.50
o M5 2863.00
Active traders can use PML: 3595.25 as the pivot, maintaining a long position above that level and a flat or short position below it.
Bitcoin Futures
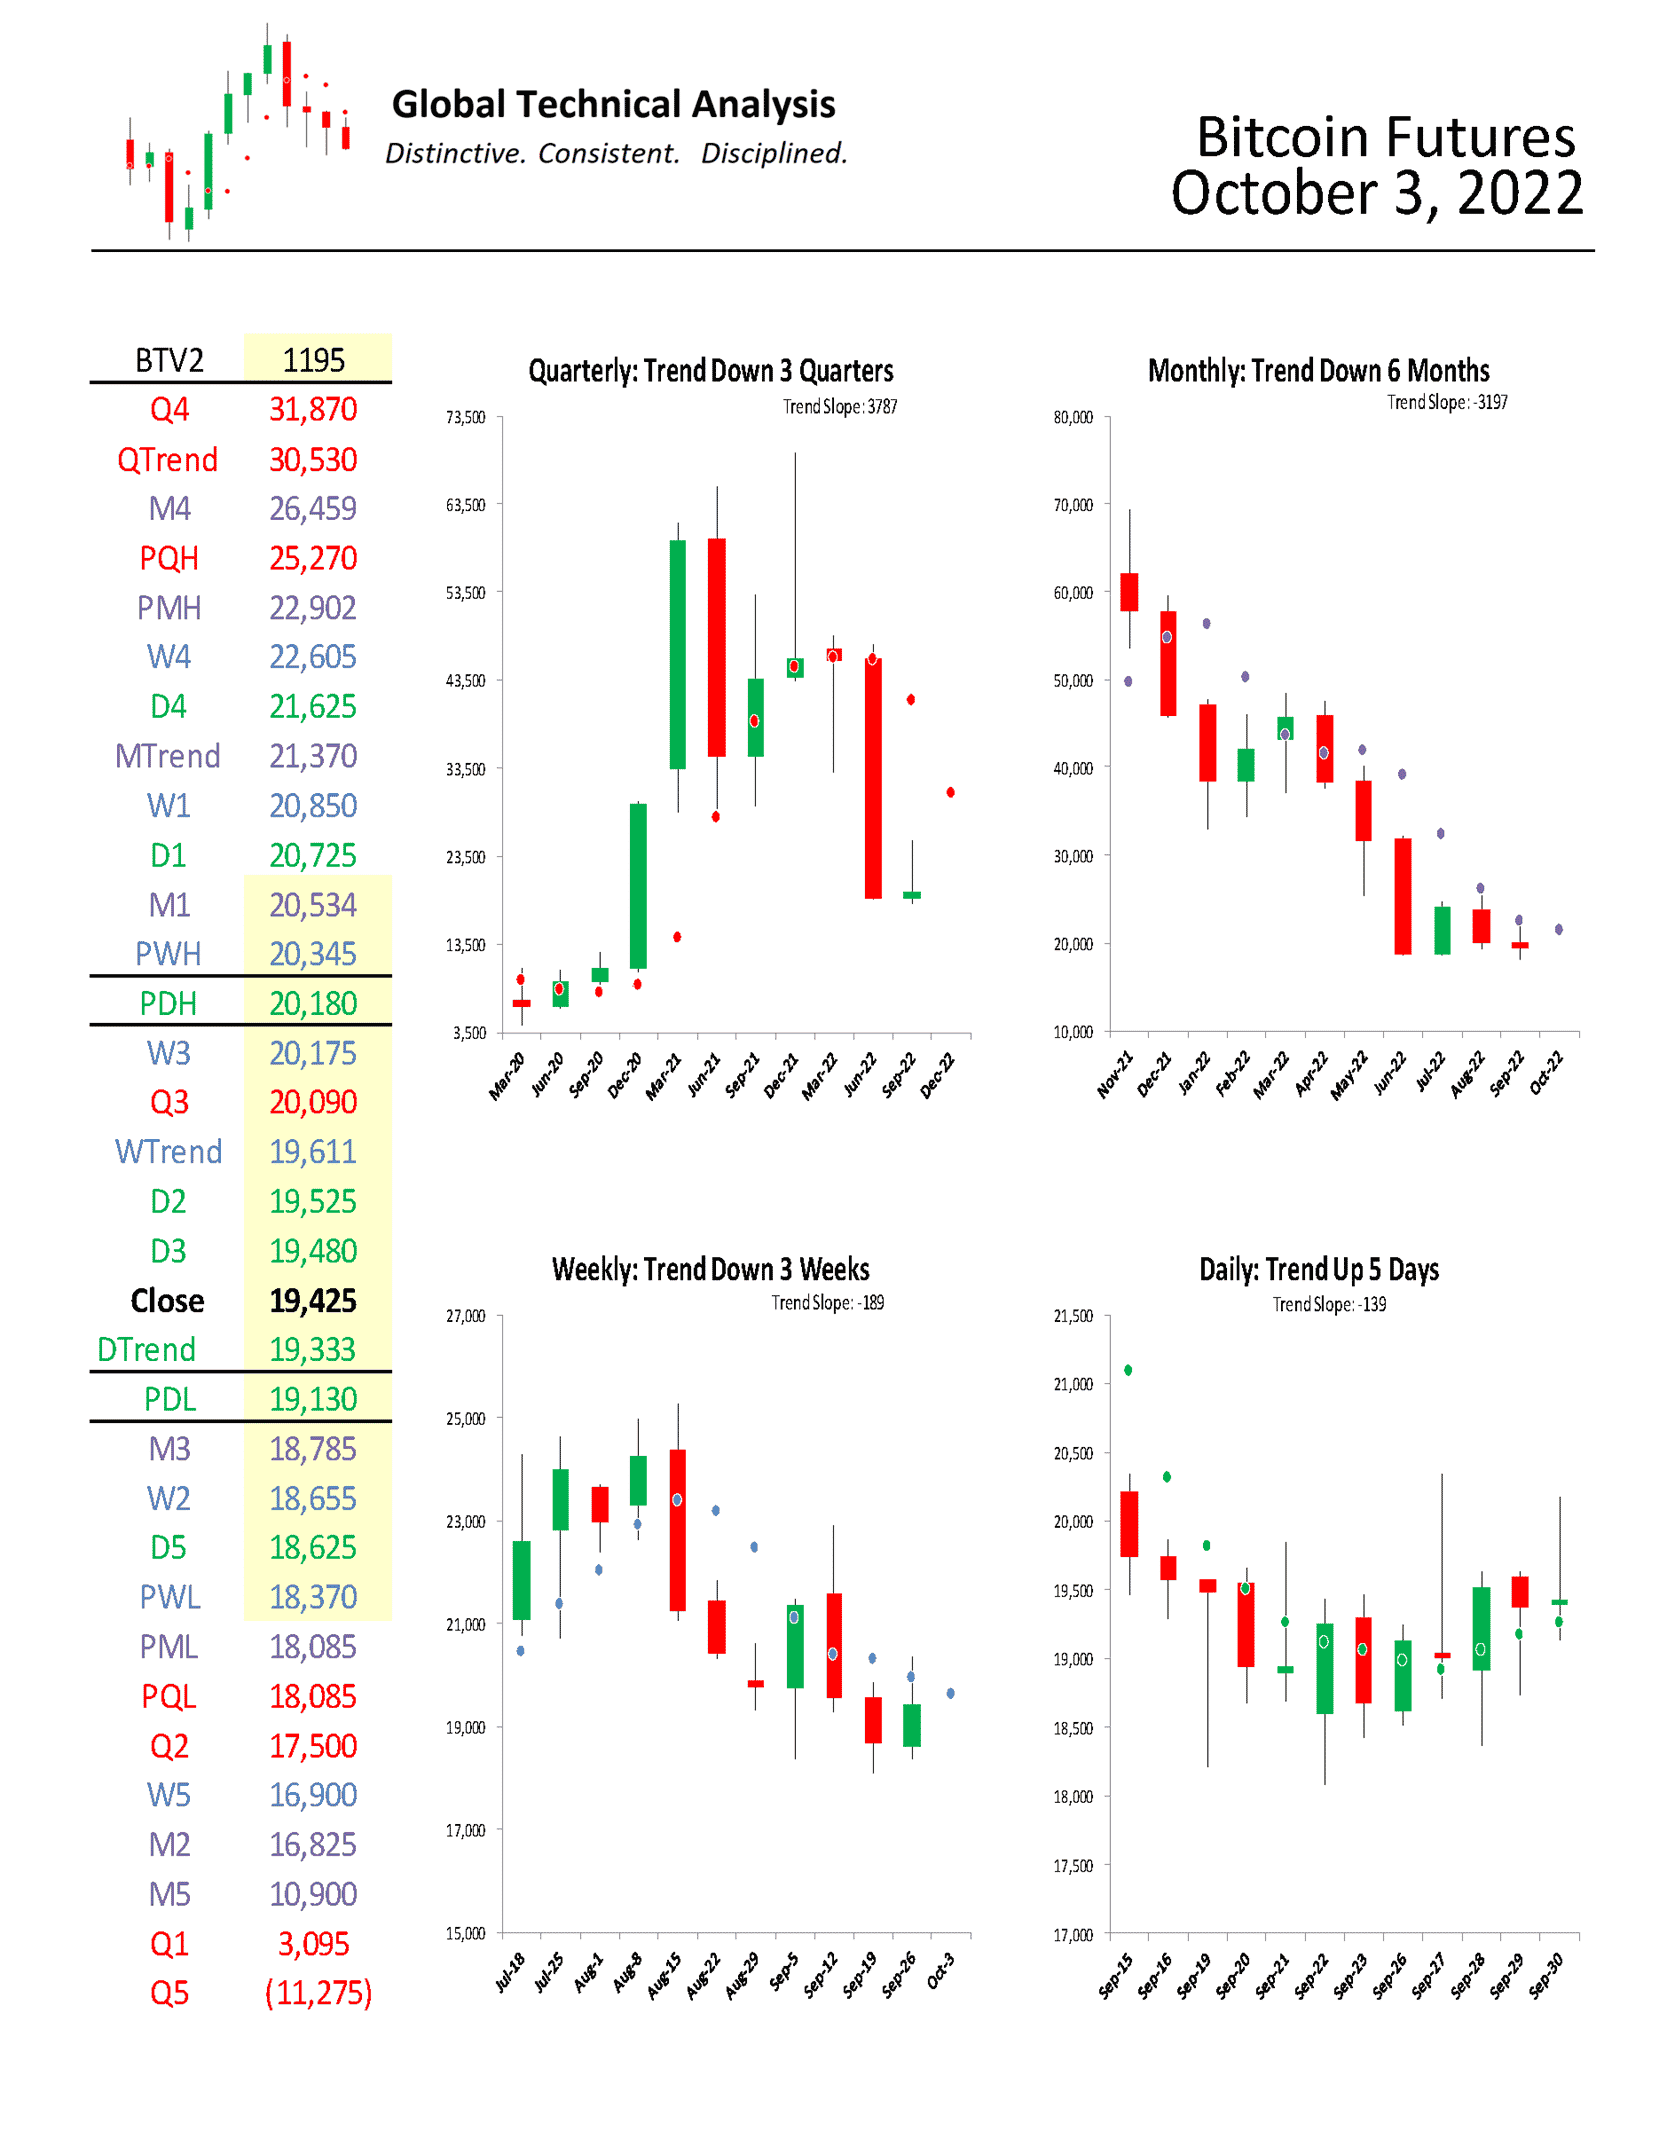
For October, we focus on Bitcoin Futures. We provide a monthly time-period analysis of BTV2. The same analysis can be completed for any time-period or in aggregate.
Trends:
o Quarterly Trend 30,530
o Monthly Trend 21,370
o Weekly Trend 19,611
o Current Settle 19,425
o Daily Trend 19,333
The relative positioning of the Trend Levels is bearish. Think of the relative positioning of the Trend Levels like you would a moving-average cross. As can be seen in the quarterly chart below, Bitcoin is “Trend Down: 3 Quarters”. Stepping down one time-period, the monthly chart shows that Bitcoin is “Trend Down: 6 Months”. Stepping down to the weekly time-period, the chart shows that Bitcoin is “Below Trend: 3 Weeks”.
One rule we have is to anticipate a two-period high (low), within the following four to six periods, after a Downside (Upside) Exhaustion level has been reached. A signal was given in May 2022 to anticipate a two-month high within the next four to six months (now, two months). That high can be achieved in October with a trade above 25,270.
Monthly Momentum, which measures the distance of the market price from where all the trading activity has occurred over a specific number of months, is neutral. (Neutral is defined as not being in the tails of the distribution.)
Support/Resistance:
In isolation, monthly support and resistance levels for October are:
o M4 26,459
o MTrend 21,370
o M1 20,534
o Close 19,425
o M3 18,785
o PML 18,085
o M2 16,825
o M5 10,900
Active traders can use PML: 18,085 as the initial pivot, maintaining a long position above that level and a flat or short position below it.
Summary
The power of technical analysis is in its ability to reduce multi-dimensional markets into a filtered two-dimensional space of price and time. Our methodology applies a consistent framework that identifies key measures of trend, distinct levels of support and resistance, and identification of potential trading ranges. Our methodology can be applied to any security or index, across markets, for which we can attain a reliable price history. We look forward to bringing you our unique brand of technical analysis and insight into many different markets. If you are a professional market participant and are open to discovering more, please connect with us. We are not asking for a subscription; we are asking you to listen.

