


J. Brett Freeze and his firm Global Technical Analysis (GTA) provides RIA Pro subscribers Cartography Corner on a monthly basis. Brett’s analysis offers readers a truly unique brand of technical insight and risk framework. We personally rely on Brett’s research to help better gauge market trends, their durability, and support and resistance price levels.
GTA presents their monthly analysis on a wide range of asset classes, indices, and securities. At times the analysis may agree with RIA Pro technical opinions, and other times it will run contrary to our thoughts. Our goal is not to push a single view or opinion, but provide research to help you better understand the markets. Please contact us with any questions or comments. If you are interested in learning more about GTA’s services, please connect with them through the links provided in the article.
The link below penned by GTA provides a user’s guide and a sample of his analysis.
August 2022 Review
E-Mini S&P 500 Futures
We begin with a review of E-Mini S&P 500 Futures (ESU2) in August 2022. In our August 2022 edition of The Cartography Corner, we wrote the following:
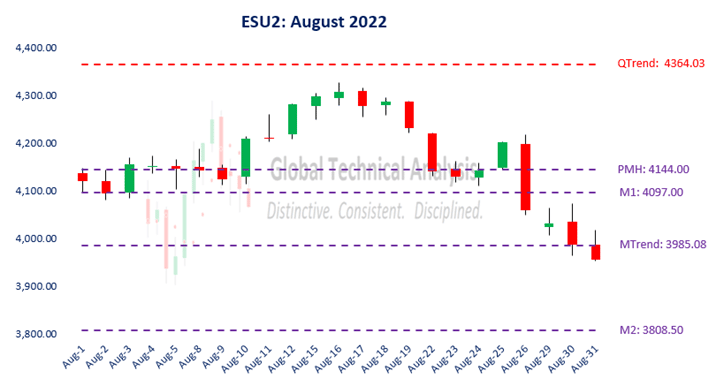
In isolation, monthly support and resistance levels for August are:
o M4 4649.00
o M3 4477.50
o PMH 4144.00
o Close 4133.50
o M1 4097.00
o MTrend 3985.08
o M2 3808.50
o PML 3723.75
o M5 3256.50
Active traders can use PMH: 4144.00 as the pivot, maintaining a long position above that level and a flat or short position below it.
Figure 1 below displays the daily price action for August 2022 in a candlestick chart, with support and resistance levels isolated by our methodology represented as dashed lines. The first three trading sessions saw the market price oscillate between our isolated pivot at PMH: 4144.00 and our first isolated support level at M1: 4097.00. In the third trading session, the market price settled above our isolated pivot. The following four trading sessions saw the market price oscillate around our pivot, building energy for a directional move.
On August 10th, a directional move higher began. The market price ascended over the following four trading sessions, reaching its peak on August 16th at 4327.50. The ascent stopped just short of Quarterly Trend at QTrend: 4364.03. As a reminder, Quarterly Trend is our measurement of the long-term trend. It is the most important level produced in our analysis. Before 2Q2022, the market price settled above Quarterly Trend for eight consecutive quarters. Given the significant break and settlement below Quarterly Trend in 2Q, it is now acting as long-term resistance. We anticipate(d) that any rally should ultimately fail at Quarterly Trend, to confirm our bear market hypothesis.
Over the following seven trading sessions, the market price descended back to our isolated pivot at PMH: 4144.00. The final four trading sessions saw the market price descend to, and settle below, Monthly Trend at MTrend: 3985.08.
Our analysis accurately mapped the realized price action. It provided opportunities to realize both short-term profits from being long and to position shorts with a longer time horizon.
Figure 1:
High-Grade Copper
We continue with a review of High-Grade Copper Futures (HGZ2) during August 2022. In our August 2022 edition of The Cartography Corner, we wrote the following:
In isolation, monthly support and resistance levels for August are:
o MTrend 3.9010
o M4 3.7635
o PMH 3.7025
o Close 3.5735
o M3 3.4370
o PML 3.1315
o M1 2.8280
o M2 2.6215
o M5 1.6860
Active traders can use M3: 3.4370 as the initial pivot, maintaining a long position above that level and a flat or short position below it.
Figure 2 below displays the daily price action for August 2022 in a candlestick chart, with support and resistance levels isolated by our methodology represented as dashed lines. The market price never settled below our isolated pivot at M3: 3.4370. The low settlement price was realized on August 3rd at 3.4670.
Figure 2:
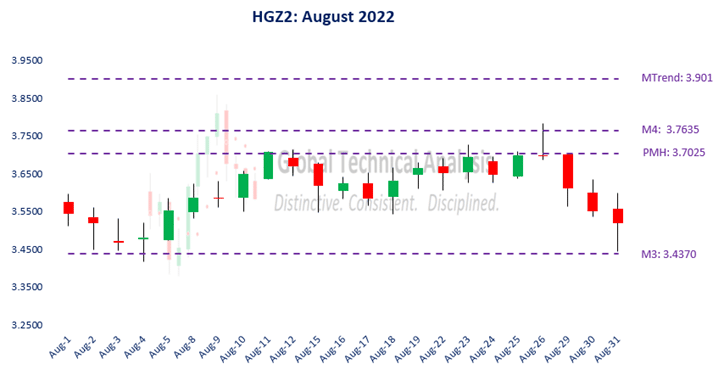
The high price for the month was realized on August 26th at 3.7835, slightly above our isolated Upside Exhaustion level at M4: 3.7635. All longs should have been sold at the Upside Exhaustion and, if able and willing, shorts should have been set. The signal was given to anticipate a two-month low within the next four to six months (< 3.1315, if achieved in September).
Active traders following our analysis, conservatively, realized a profit of +5.3%.
September 2022 Analysis
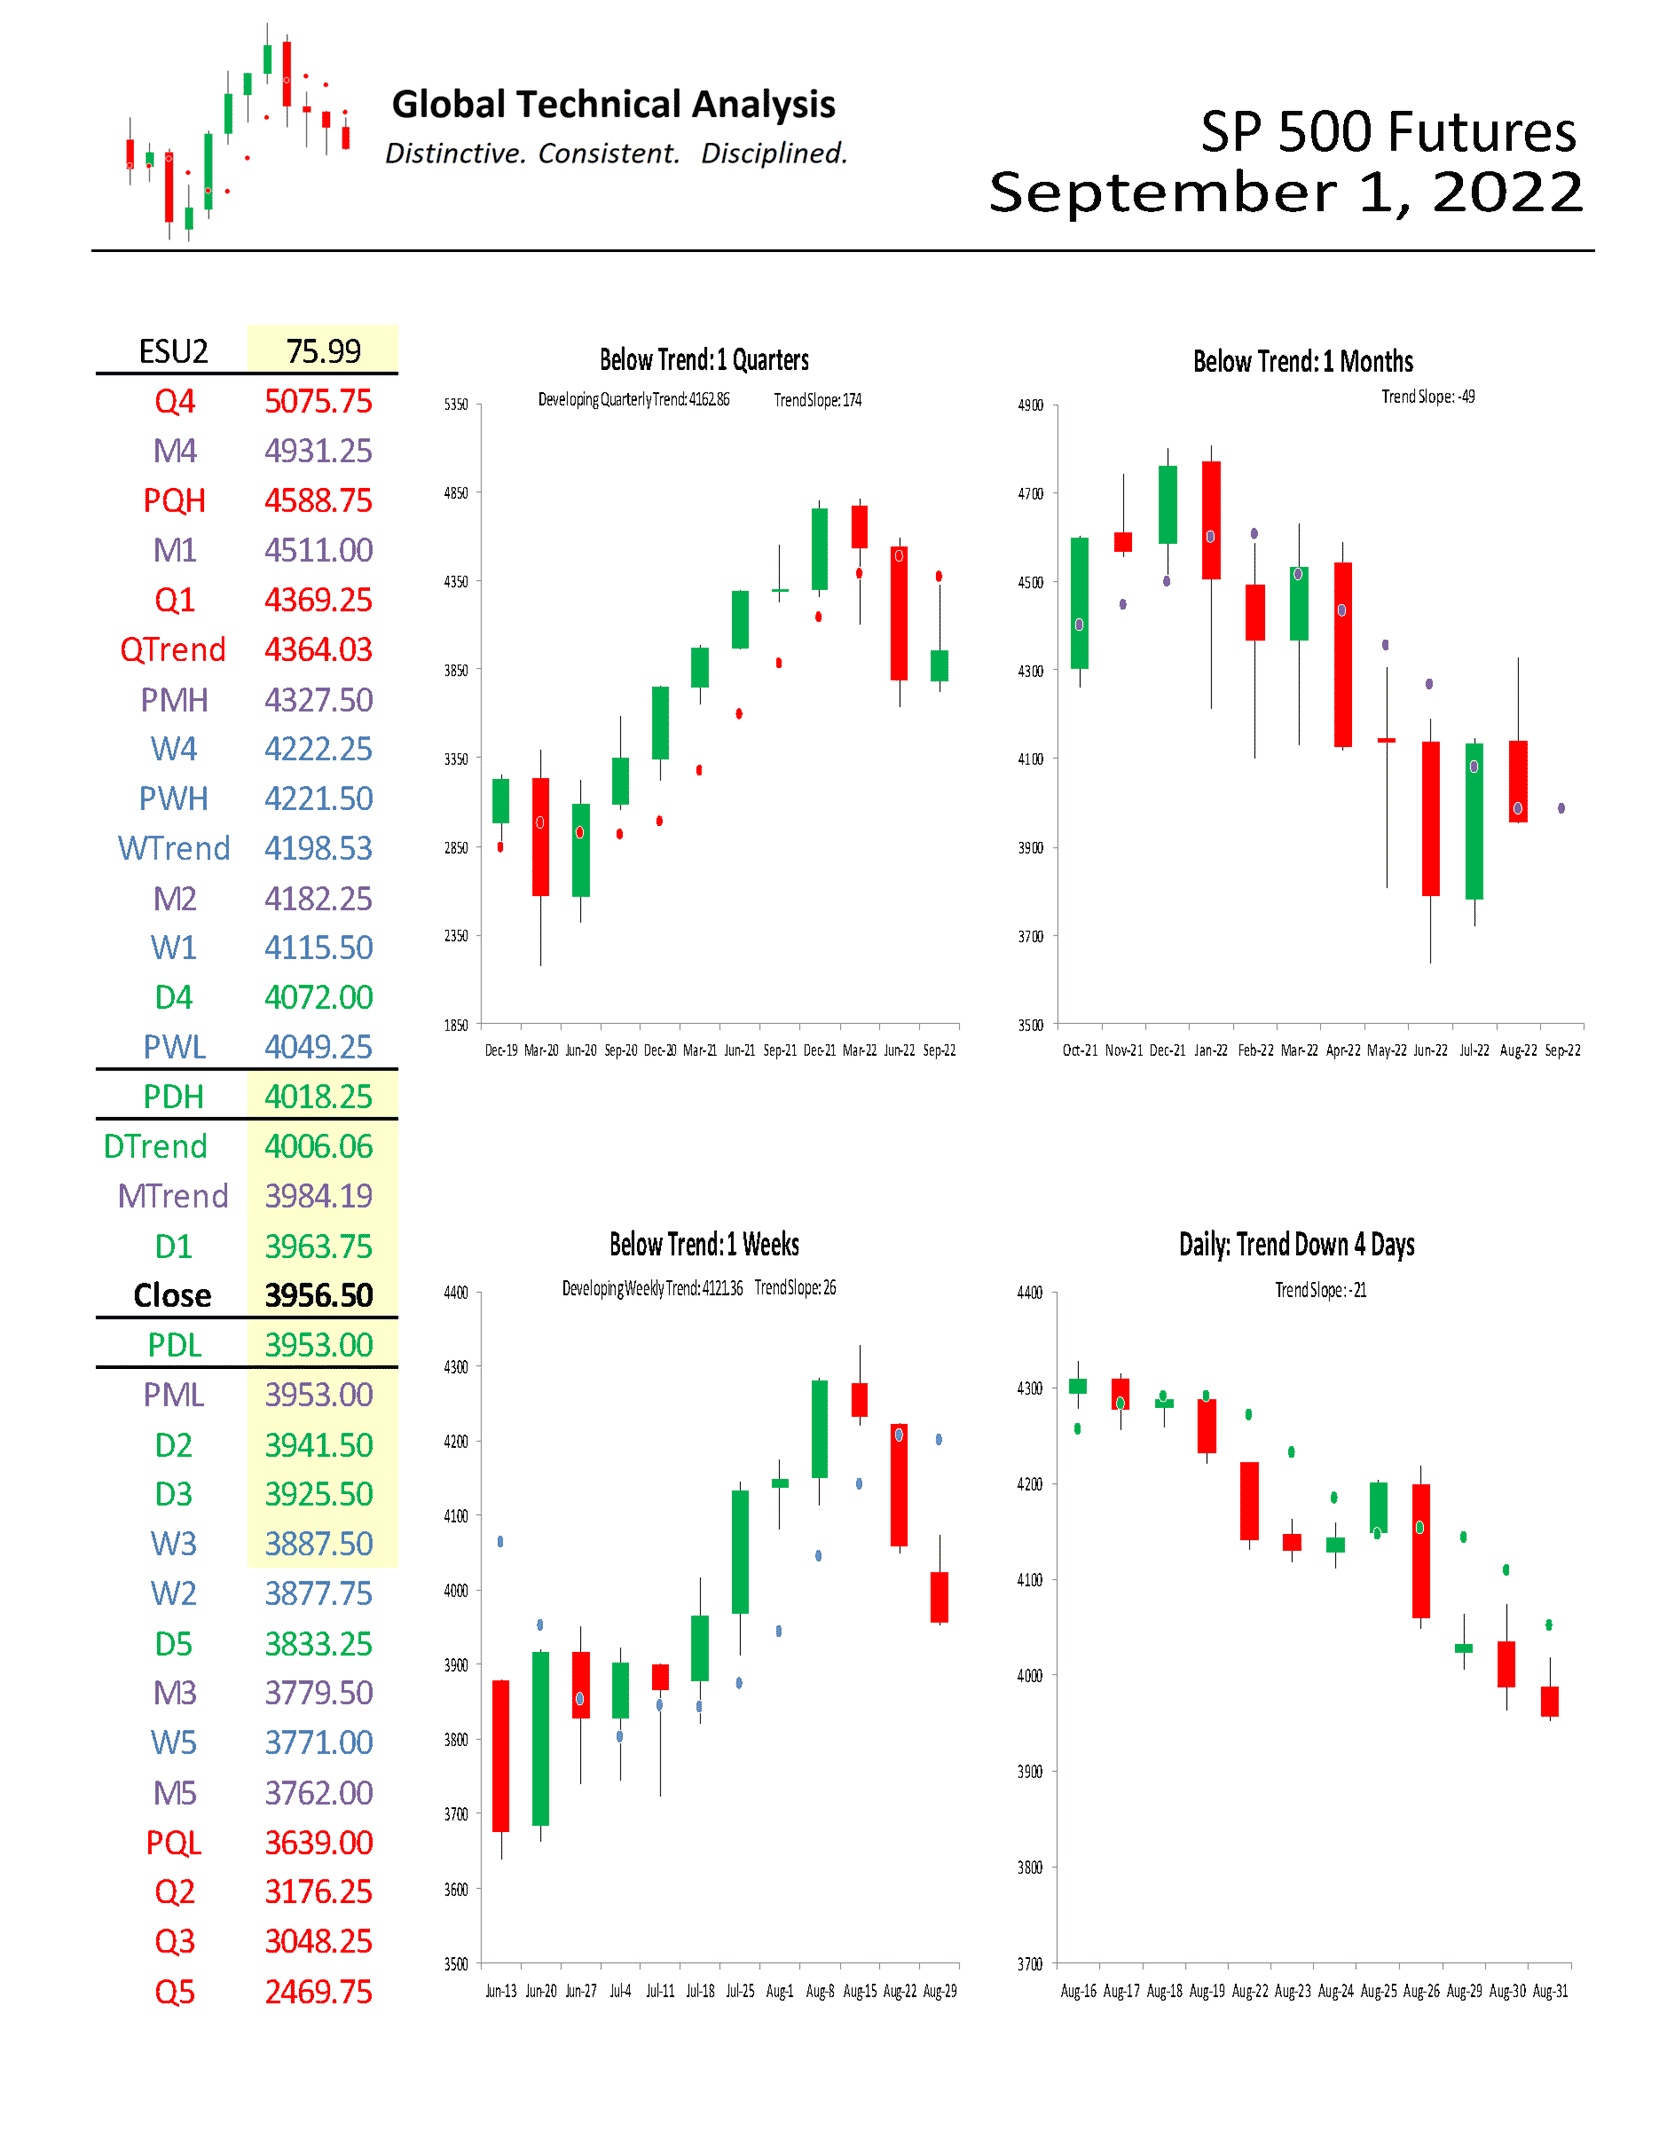
We begin by providing a monthly time-period analysis of E-Mini S&P 500 Futures (ESU2). The same analysis can be completed for any time-period or in aggregate.
Trends:
o Quarterly Trend 4364.03
o Weekly Trend 4198.53
o Daily Trend 4006.06
o Monthly Trend 3984.19
o Current Settle 3956.50
The relative positioning of the Trend Levels is bearish. Think of the relative positioning of the Trend Levels like you would a moving-average cross. In the quarterly time-period, the chart shows that E-Mini S&P 500 Futures are “Below Trend: 1 Quarters”, after having been above Quarterly Trend for eight quarters. Stepping down one time-period, the monthly chart shows that E-Mini S&P 500 Futures are “Below Trend: 1 Months”. Stepping down to the weekly time-period, the chart shows that E-Mini S&P 500 Futures are “Below Trend: 1 Weeks”.
One rule we have is to anticipate a two-period high (low), within the following four to six periods, after a Downside (Upside) Exhaustion level has been reached. A signal was given in January to anticipate a two-month high within the next four to six months (August = 7 months). That high was achieved in August with the trade above 4191.00. As we have documented previously, a two-month high is the safest place to set shorts after the initial move down in a bear market. (Our first short was set at 4192.00 and our best short was set at 4325.00).
Monthly Momentum, which measures the distance of the market price from where all the trading activity has occurred over a specific number of months, is neutral. Trend Persistence, which measures the strength of the trend across multiple periods, is neutral as well. (Neutral is defined as not being in the tails of the distribution.) Our clients can view those charts on our website.
Support/Resistance:
In isolation, monthly support and resistance levels for September are:
o M4 4931.25
o M1 4511.00
o PMH 4327.50
o M2 4182.25
o MTrend 3984.19
o Close 3956.50
o PML 3953.00
o M3 3779.50
o M5 3762.00
Active traders can use PML: 3953.00 as the pivot, maintaining a long position above that level and a flat or short position below it.
Random Length Lumber
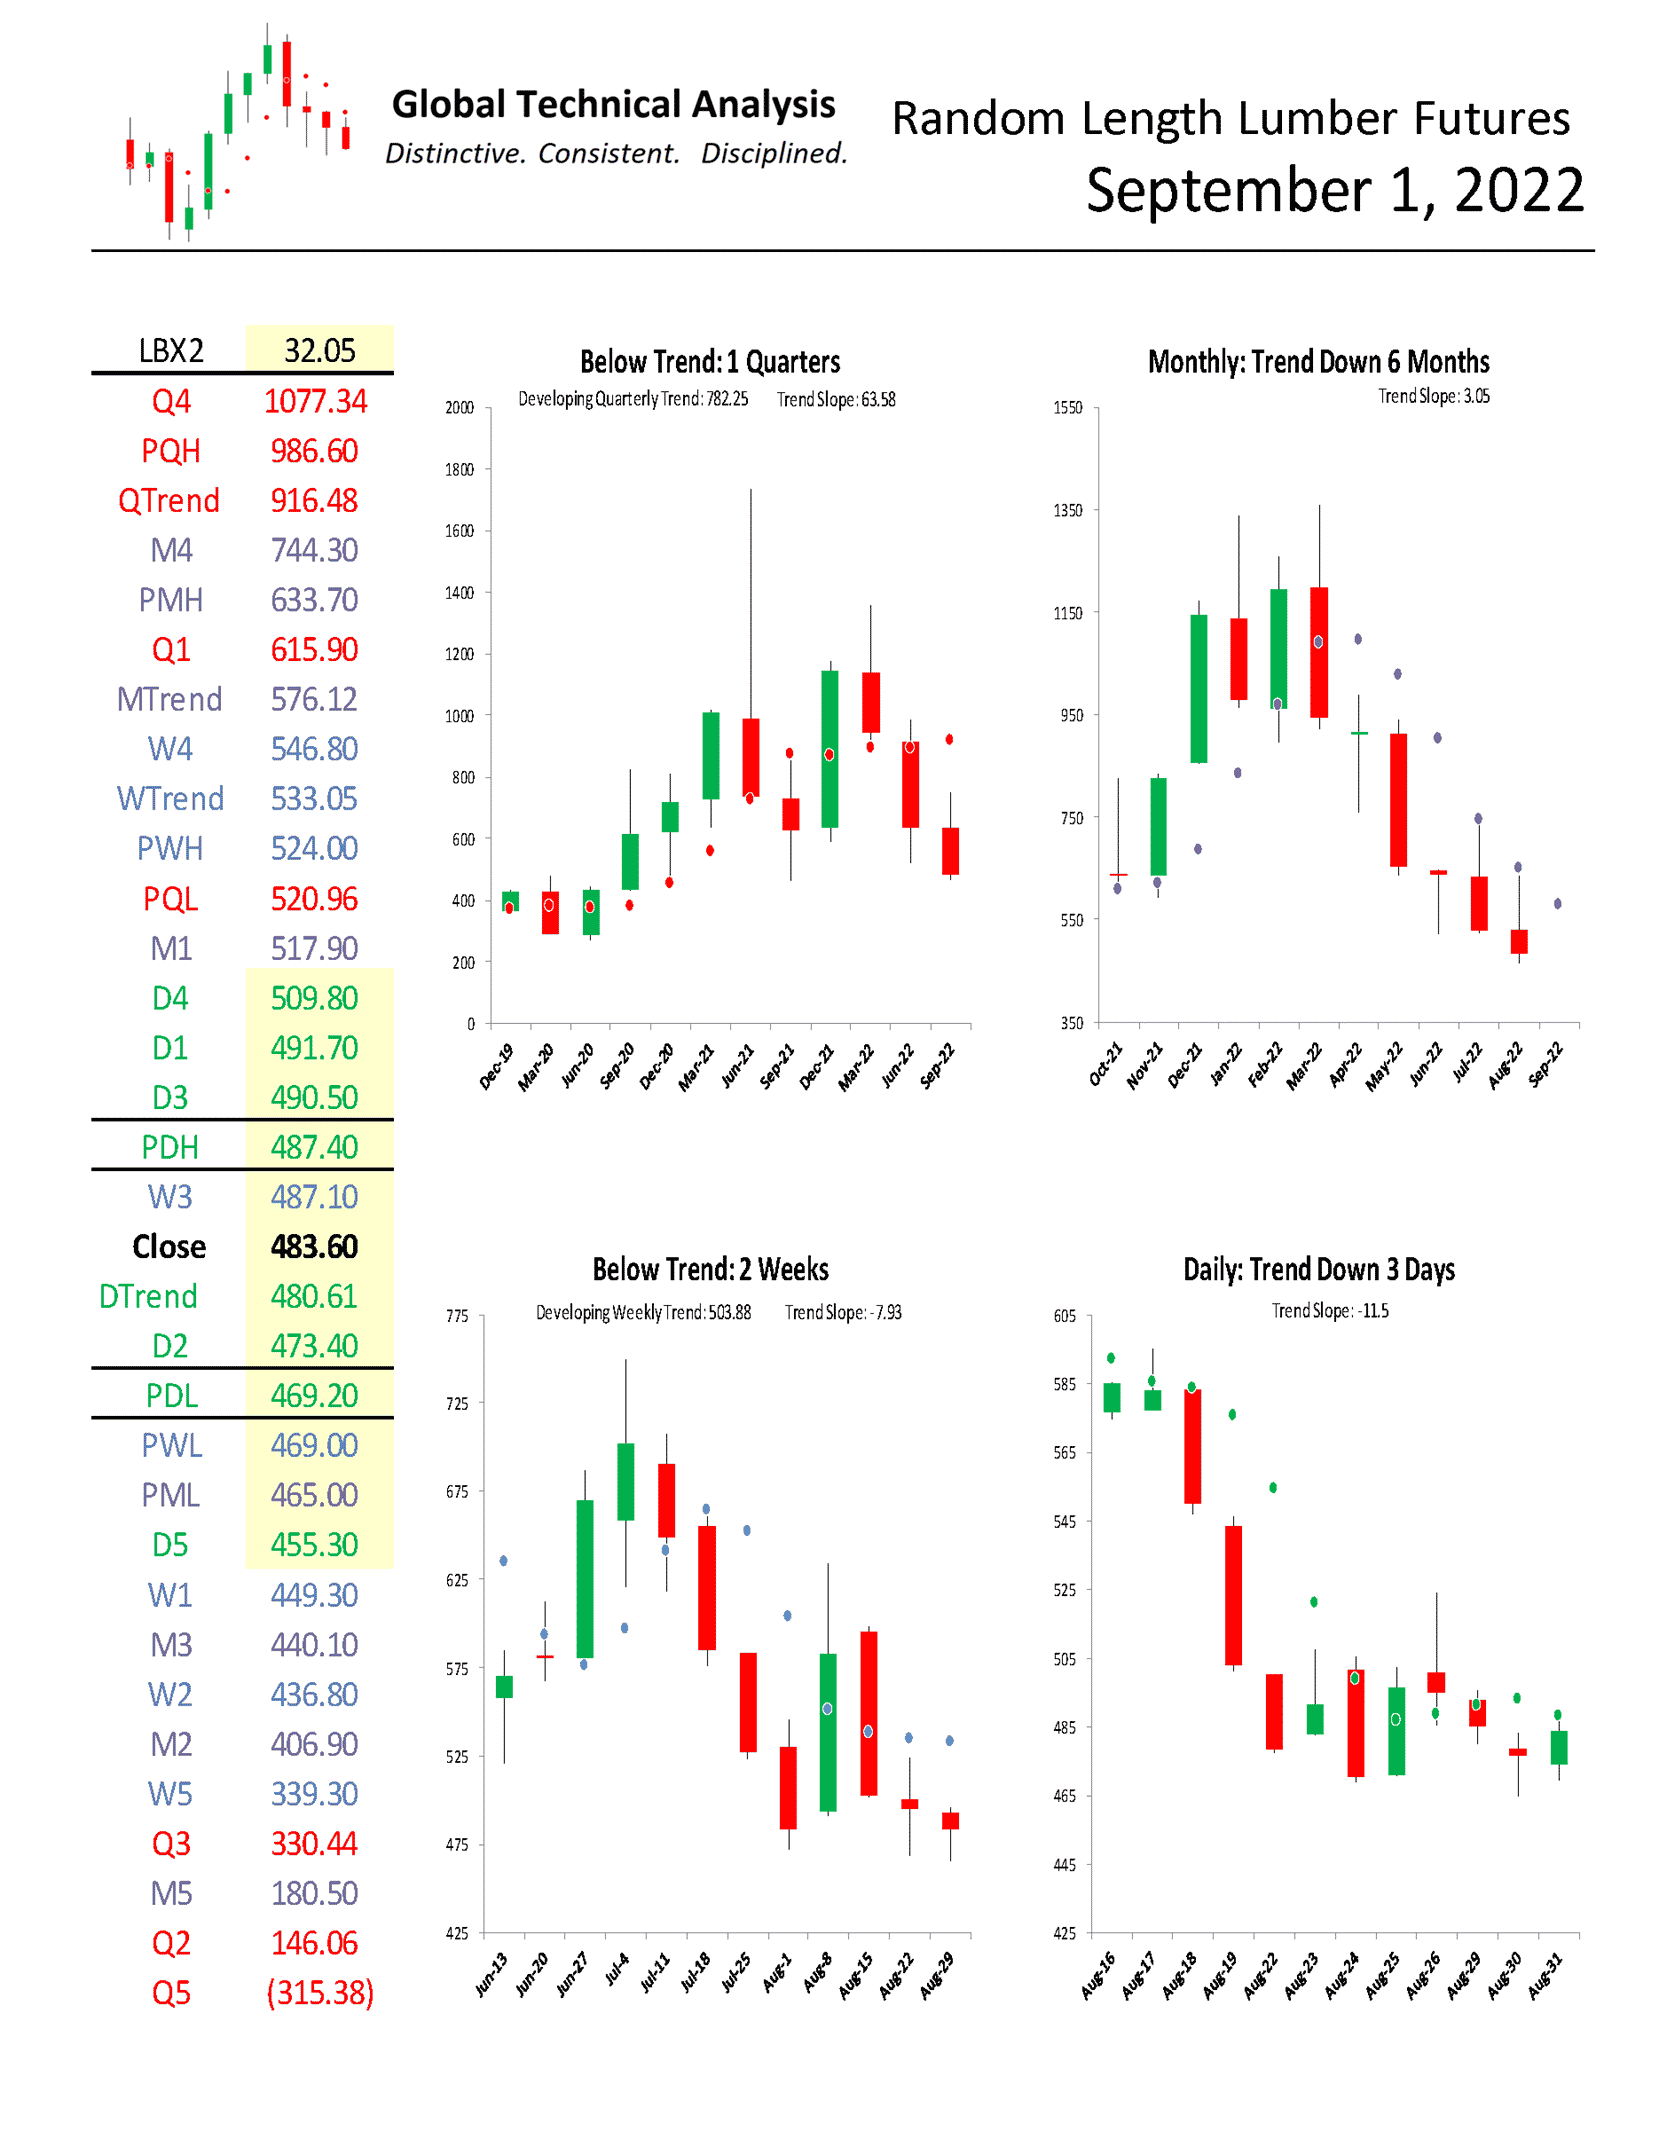
For September, we focus on Random Length Lumber Futures. We provide a monthly time-period analysis of LBX2. The same analysis can be completed for any time-period or in aggregate.
Trends:
o Quarterly Trend 916.48
o Monthly Trend 576.12
o Weekly Trend 533.05
o Current Settle 483.60
o Daily Trend 480.61
The relative positioning of the Trend Levels is maximum bearish. Think of the relative positioning of the Trend Levels like you would a moving-average cross. As can be seen in the quarterly chart below, lumber is “Below Trend: 1 Quarters. Stepping down one time-period, the monthly chart shows that lumber is “Trend Down: 6 Months”. Stepping down to the weekly time-period, the chart shows that lumber is “Below Trend: 2 Weeks”.
One rule we have is to anticipate a two-period high (low), within the following four to six periods, after a Downside (Upside) Exhaustion level has been reached. A signal was given in 2Q2022 to anticipate a two-quarter high within the next four to six quarters. That high can be achieved in 3Q2022 with a trade above 1357.30.
Monthly Momentum, which measures the distance of the market price from where all the trading activity has occurred over a specific number of months, is approaching the left tail of its distribution. Trend Persistence, which measures the strength of the trend across multiple periods, is in the extreme right tail of its distribution. The right tail of the distribution signifies that the current trend should, at a minimum, pause, if not reverse. Collectively, these two indicators suggest vigilance if setting new shorts at current levels.
Support/Resistance:
In isolation, monthly support and resistance levels for September are:
o M4 744.30
o PMH 633.70
o MTrend 576.12
o M1 517.90
o Close 483.60
o PML 465.00
o M3 440.10
o M2 406.90
o M5 180.50
Active traders can use PML: 465.00 as the initial pivot, maintaining a long position above that level and a flat or short position below it.
Summary
The power of technical analysis is in its ability to reduce multi-dimensional markets into a filtered two-dimensional space of price and time. Our methodology applies a consistent framework that identifies key measures of trend, distinct levels of support and resistance, and identification of potential trading ranges. Our methodology can be applied to any security or index, across markets, for which we can attain a reliable price history. We look forward to bringing you our unique brand of technical analysis and insight into many different markets. If you are a professional market participant and are open to discovering more, please connect with us. We are not asking for a subscription; we are asking you to listen.

