


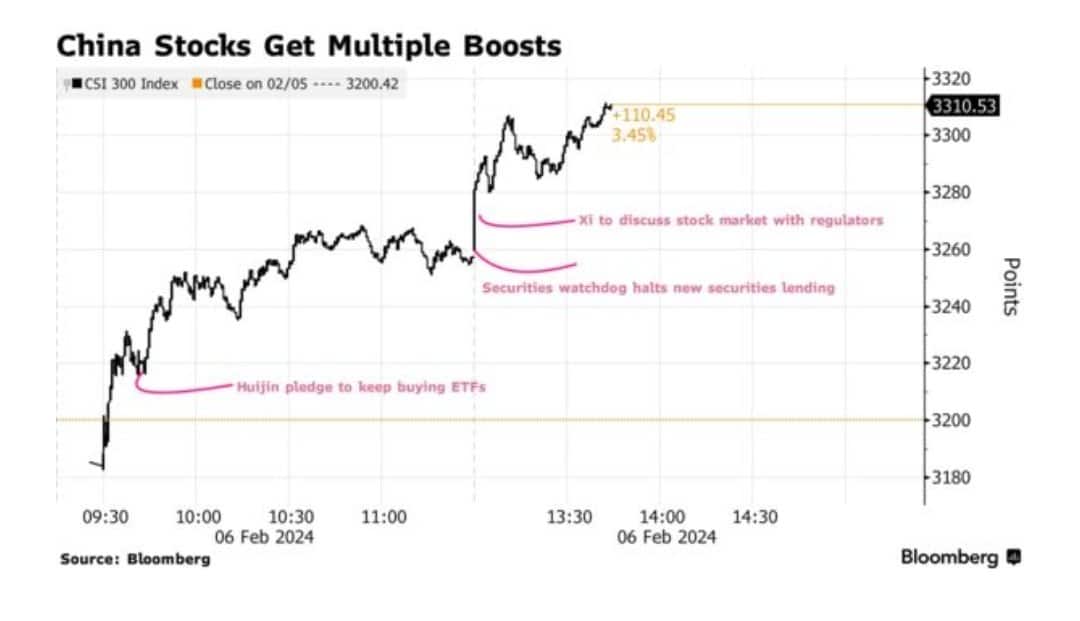
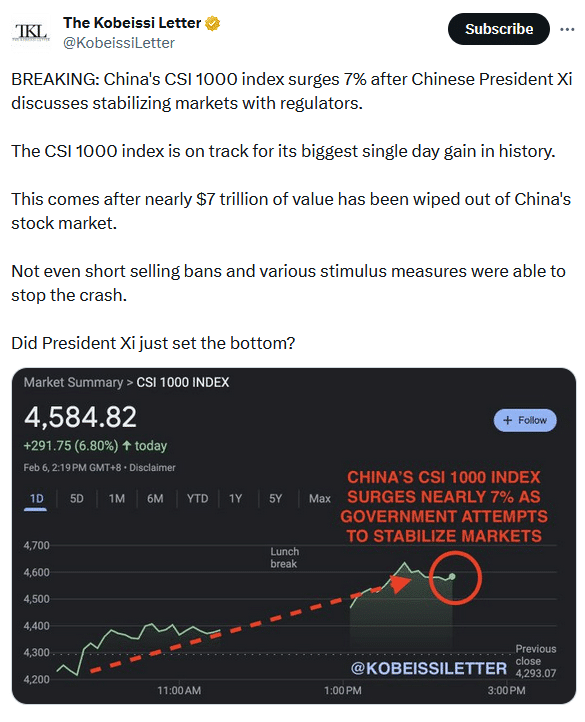
In early 2021, China’s CSI 300 Index, representing the top 300 stocks traded on the Shanghai Stock Exchange and Shenzhen Stock Exchange, peaked at 5800. Today, three years later, the index sits at 3300, down over 40%. China’s key stock market index rout is not surprising, given China’s economy has been sluggish, its property sectors are highly distressed, and its local governments are fiscally constrained. Declining confidence in China’s economic reform is also not helping matters. Accordingly, President Xi has been under growing pressure to stimulate the economy and boost its stock markets. It appears the plan to stop the stock market decline is coming into focus.
The graph below shows China’s CSI 300 stock index rose over 3% on Tuesday following numerous announcements from the government. As an example, Central Huijin Investment Ltd. committed to buying more ETFs. Furthermore, there is hope that other large institutional investors will as well. Earlier in the day, a government agency limited new security lending, which short sellers must have. Most importantly, President XI is talking publicly about the problem and vowing to fix it. The graph below, courtesy of Bloomberg, shows the multiple news events boosting China stocks on Tuesday. Bloomberg characterizes the situation: “While it’s unclear whether any new support measures will come out of the Xi meeting, traders are hoping this time will be different.”
What To Watch Today
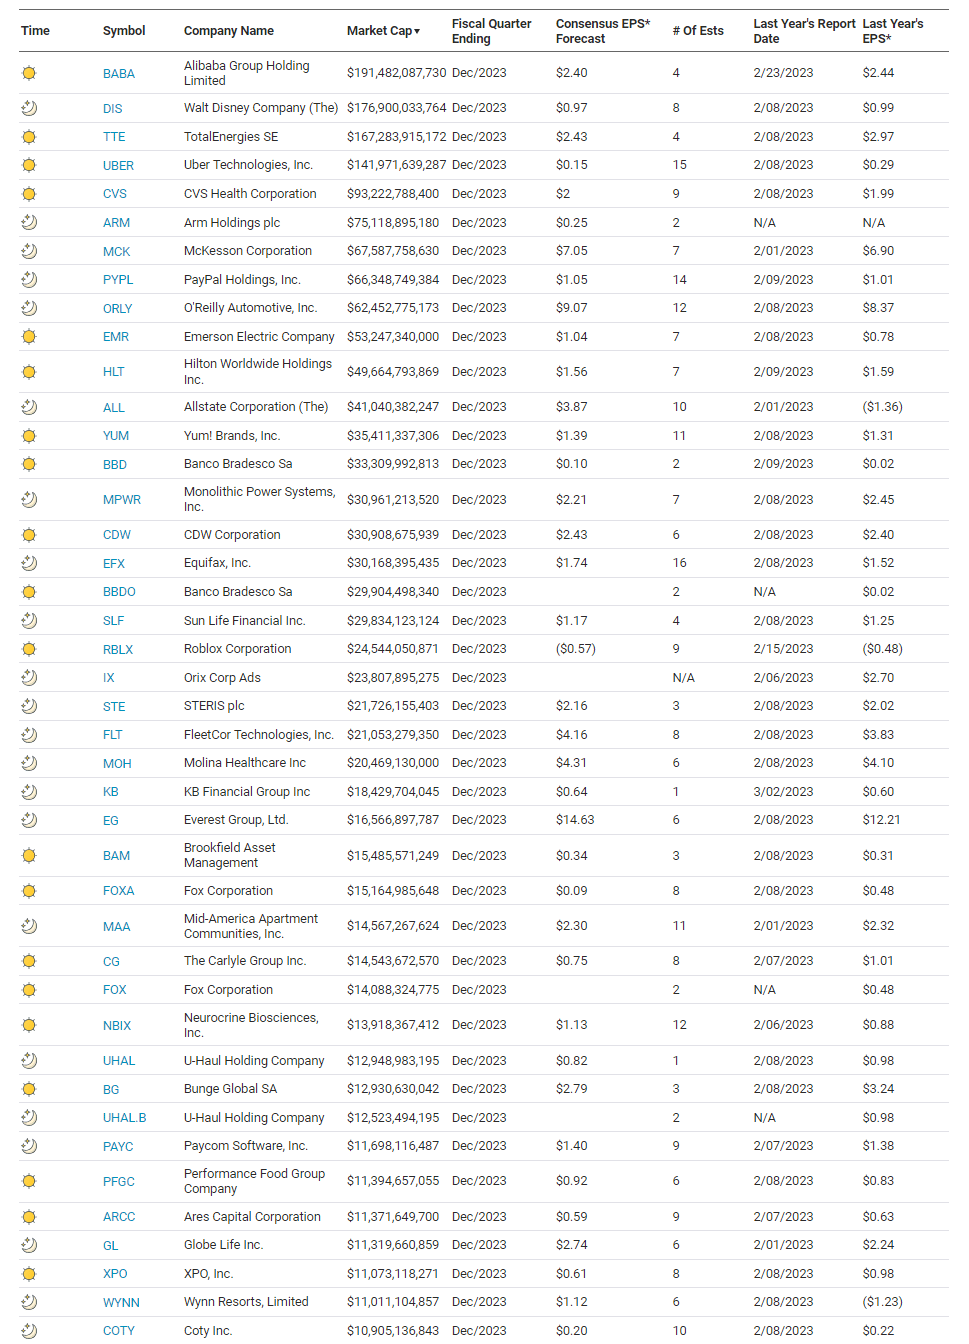
Earnings
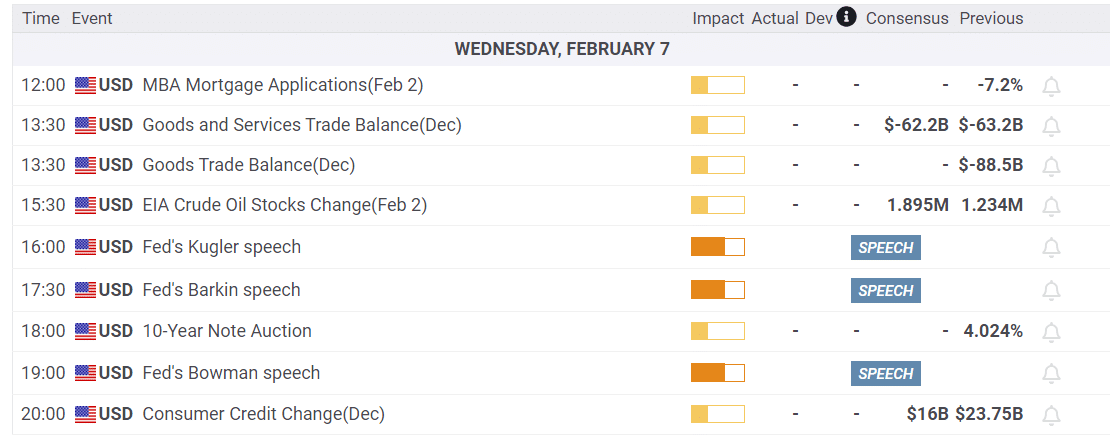
Economy
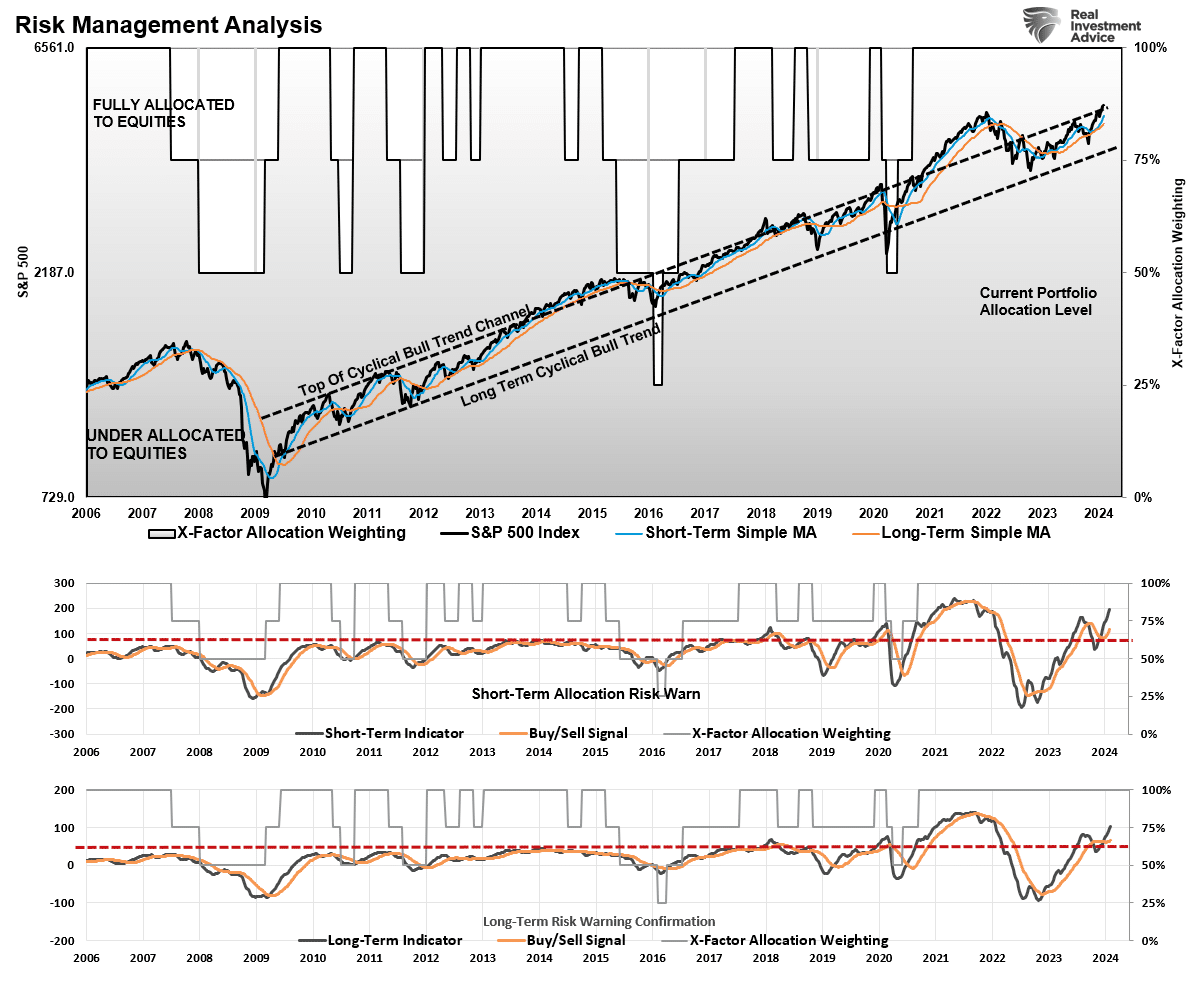
Market Trading Update
A correction is coming. I don’t know when, but a 5-10% decline before the election is a very high probability. Our weekly S&P 500 risk control chart suggests such is highly likely. The chart is broken down into 3-components. In the top panel is the running bullish trend channel from 2009. Currently, the market is trading at the top of that trend channel, which has previously preceded declines like last summer. The only exception was the stimulus-fueled rally in 2021, which exceeded the top of that channel, but the subsequent correction resolved that excess.
The bottom two panels are intermediate and long-term MACD indicators. Currently, both indicators are trading above their long-term peaks. Again, the exception is the 2021 rally, but the monetary stimulus for a similar surge is not present. While still on buy-signals currently, given the market’s overbought condition, the deviations from longer-term trends, and more speculative bullishness, the ingredients for a correction into the summer are present. As noted yesterday, these conditions exist in conjunction with the short-term overbought and bullish conditions that generally precede weaker periods in the market. While nothing is ever guaranteed, the combination of these conditions suggests a correction is more likely than not. The “timing” and “cause” of that correction are hard.
The point here is that as investors, we should be aware of the risk of a larger correction sometime this year and act accordingly when it begins.

More On The BLS Jobs Oddities
We are still digesting last Friday’s BLS report, as there are many inconsistencies worth mentioning. Our Commentaries on Monday and Tuesday discuss the wide gap between the BLS household survey and the establishment survey. Similarly, today, we address a few more charts that call into question the notion that the job market is robust.
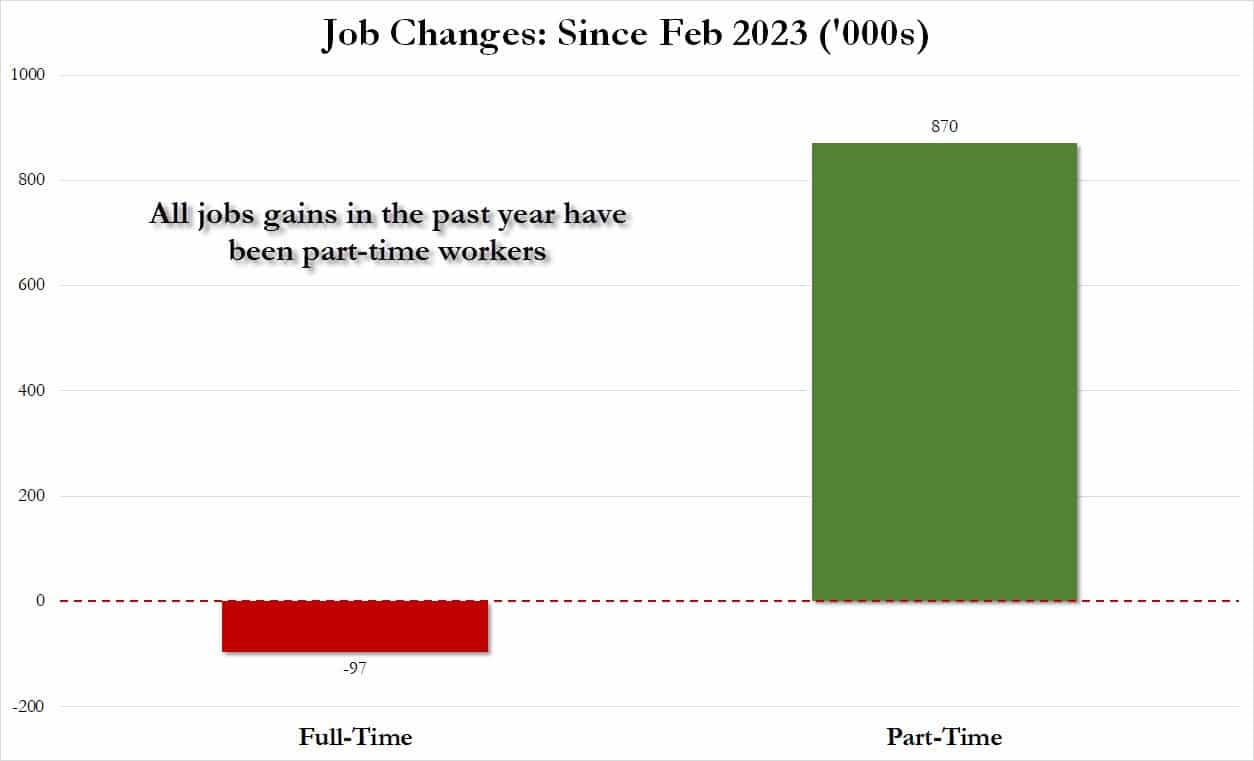
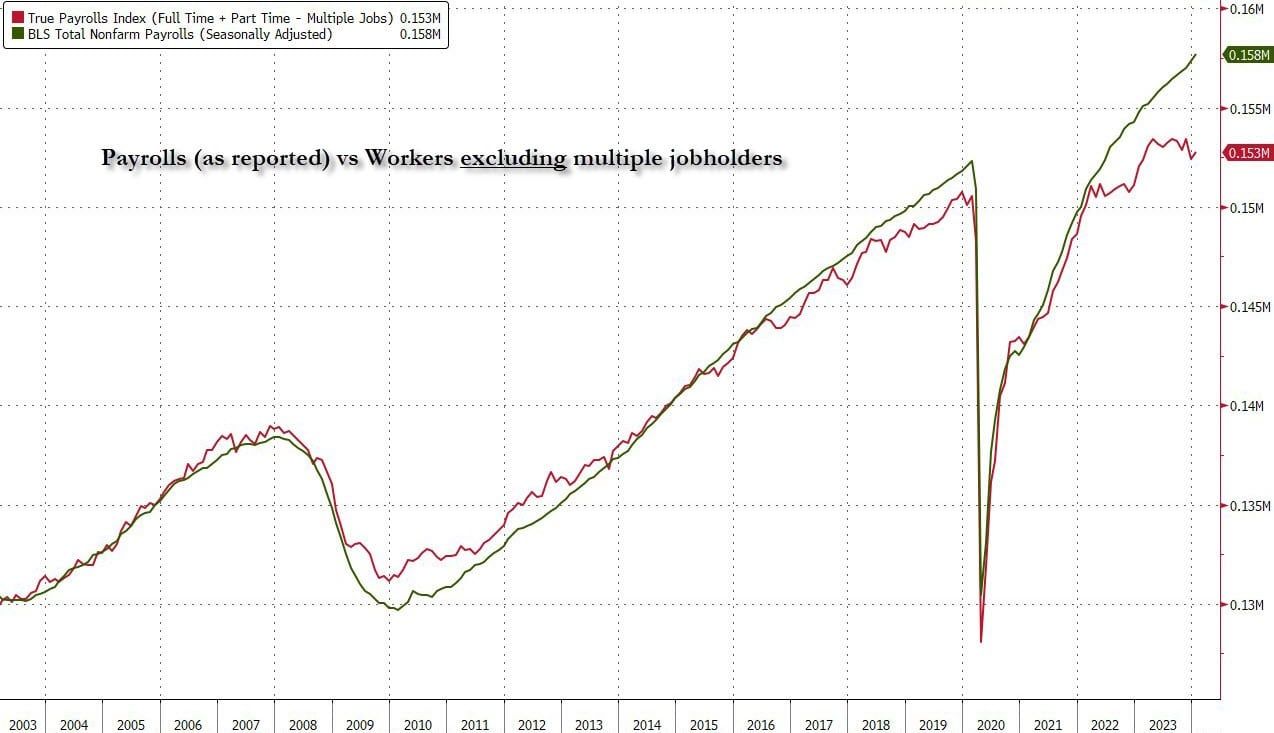
The first two graphs below, courtesy of Zero Hedge, show that the breadth of the gains in the labor market has much to be desired. Over 100% of the job gains over the past 12 months are from part-time workers. In fact, full-time employment has actually shrunk. As the second graph shows, many part-time workers may also be multiple job holders. If we strip out those with multiple jobs, payroll growth will not be as great as advertised.
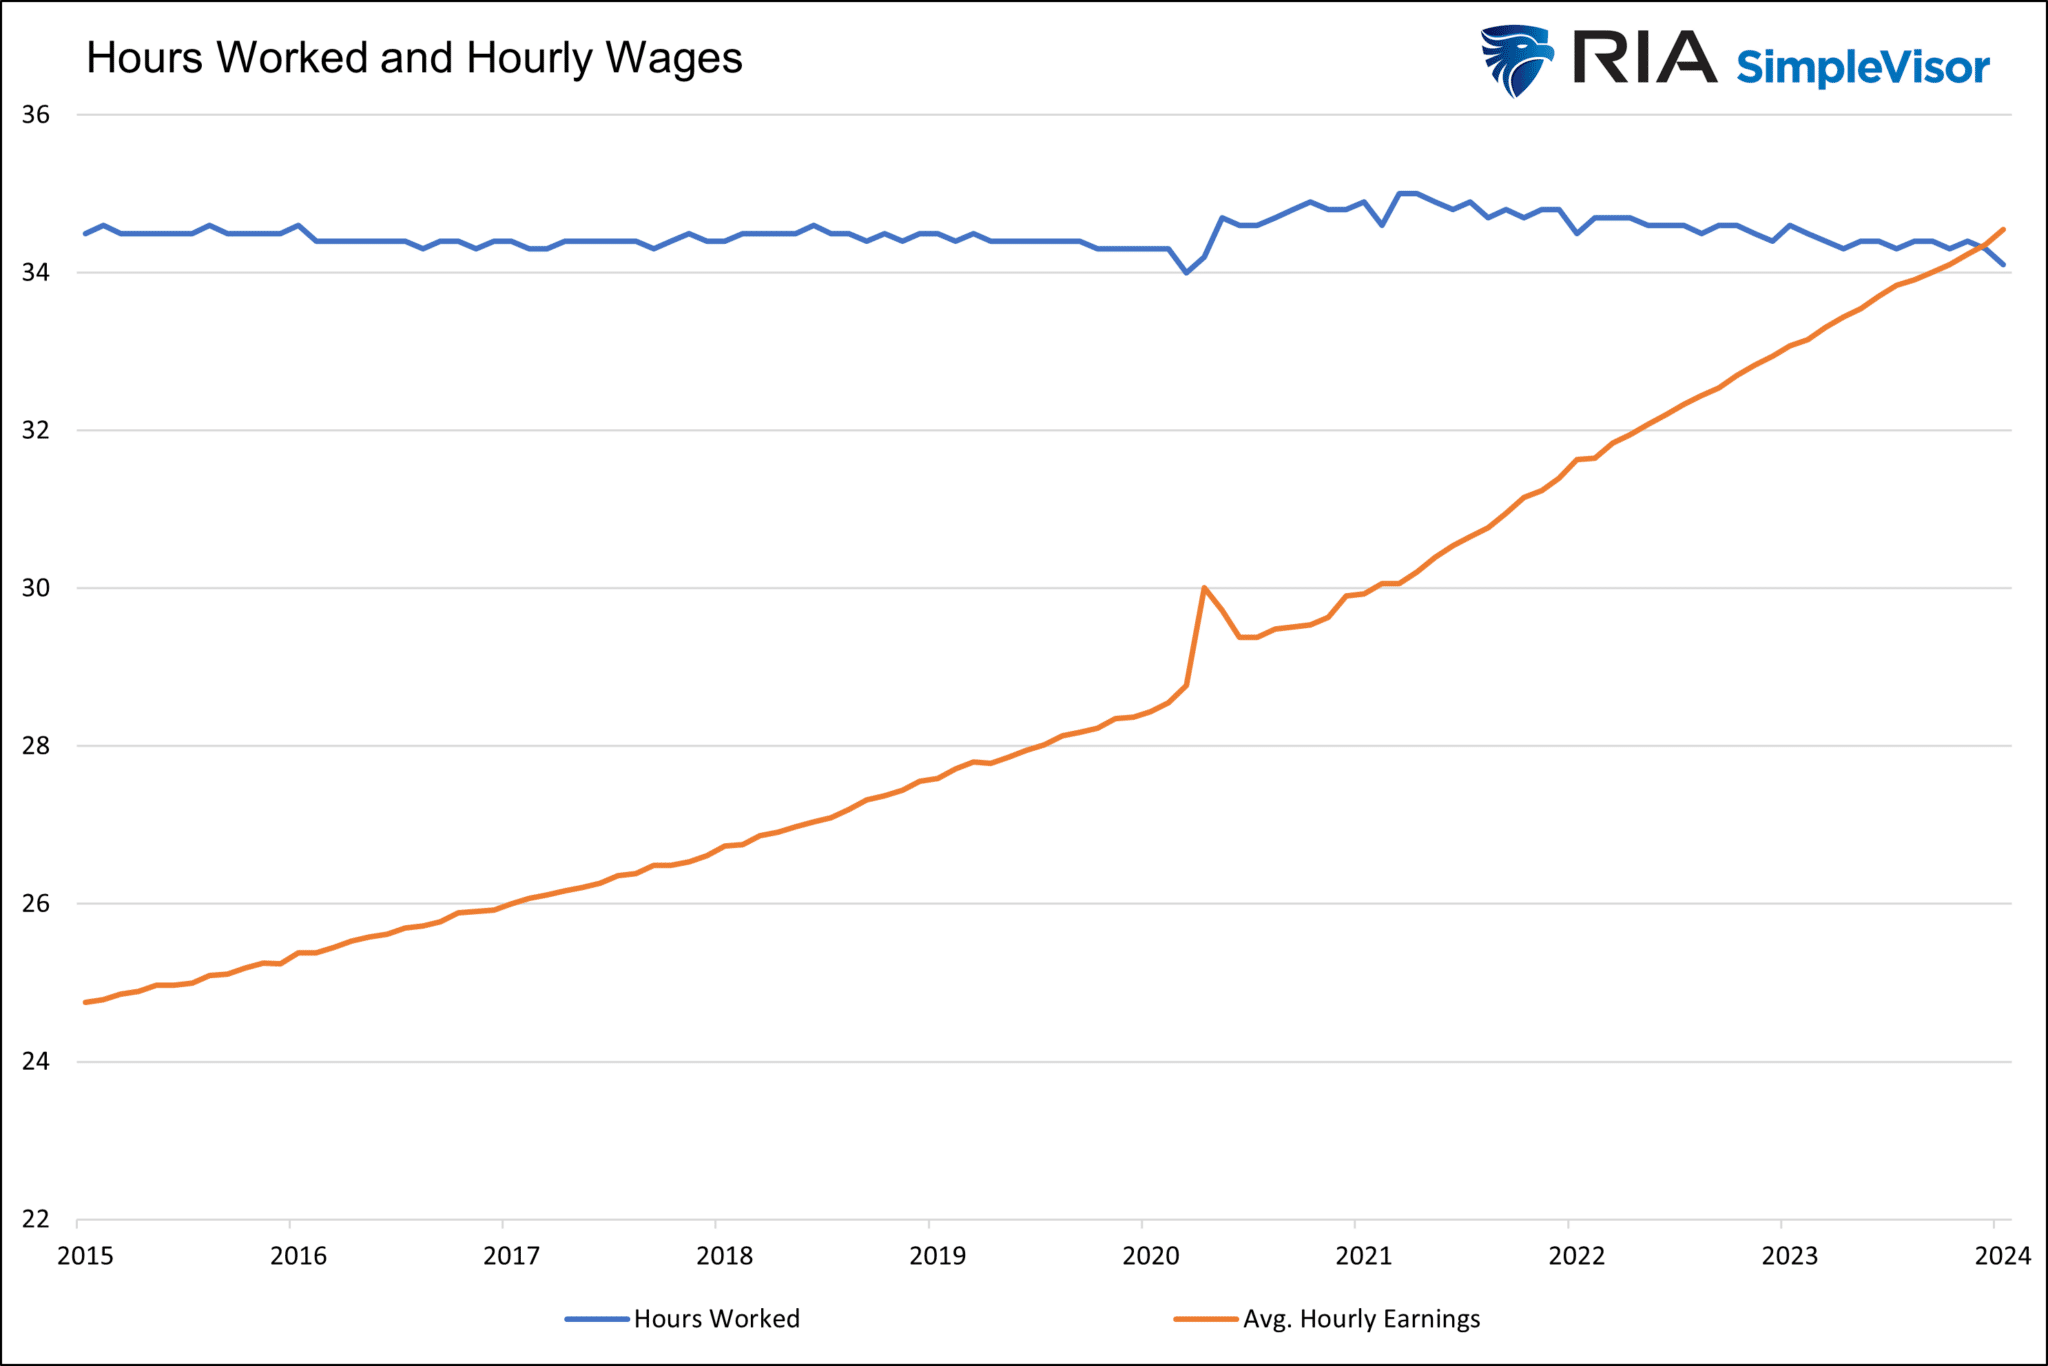
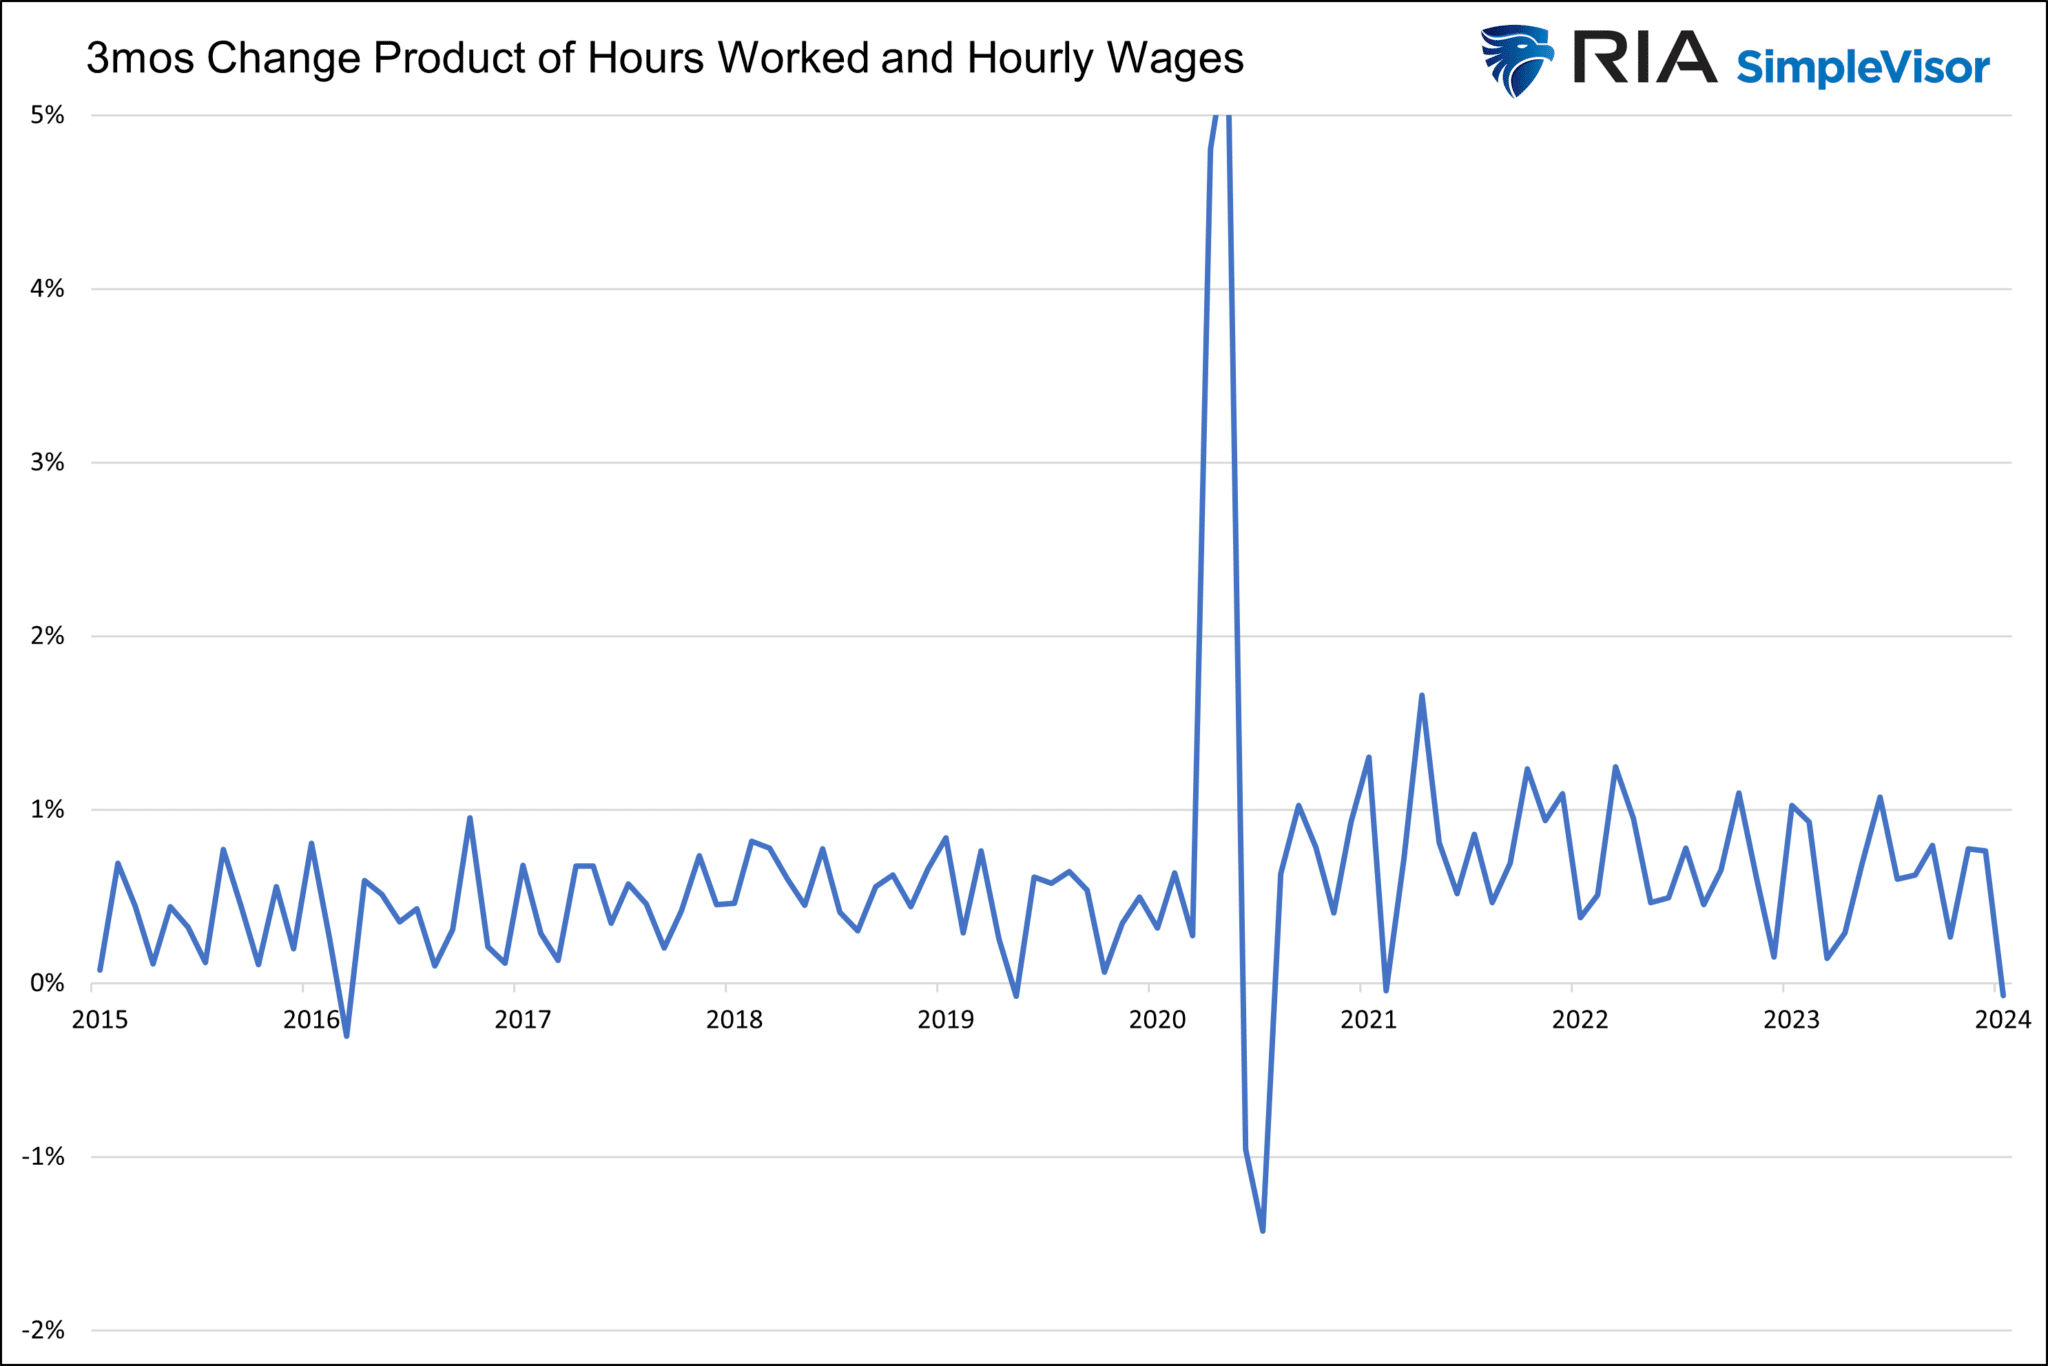
The third and fourth graphs show that the recent spike in hourly wages was more than offset by declining hours worked. For the first time in three years, the product of wages and hours worked declined on a three-month running basis. Ergo, aggregate wages paid actually shrunk slightly.
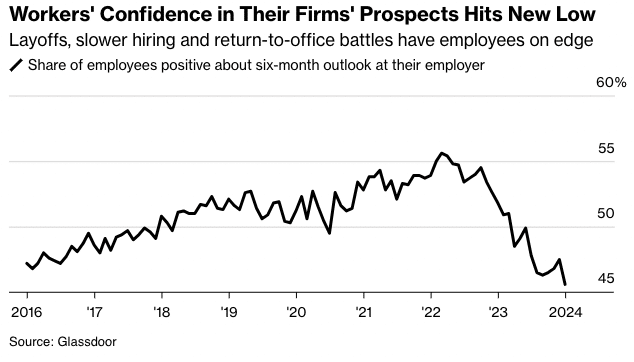
Worker Confidence In Their Employers Falter
Per the Glassdoor survey results shown below, courtesy of Bloomberg, U.S. workers are more downbeat about the prospects for their employment than at any time in nearly a decade. Presuming workers are less confident, this survey helps explain why the JOLTS quit rate has been falling. However, it doesn’t explain rising consumer confidence.
Tweet of the Day
“Want to have better long-term success in managing your portfolio? Here are our 15-trading rules for managing market risks.”
Please subscribe to the daily commentary to receive these updates every morning before the opening bell.
If you found this blog useful, please send it to someone else, share it on social media, or contact us to set up a meeting.
Post Views: 3
2024/02/07