


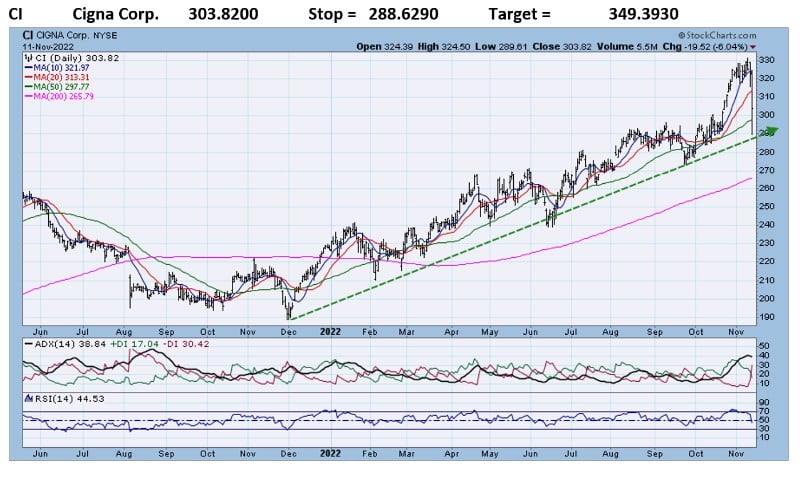
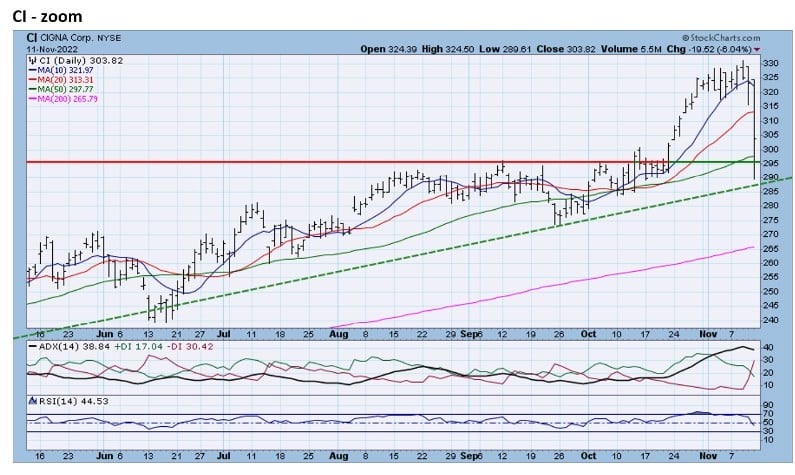
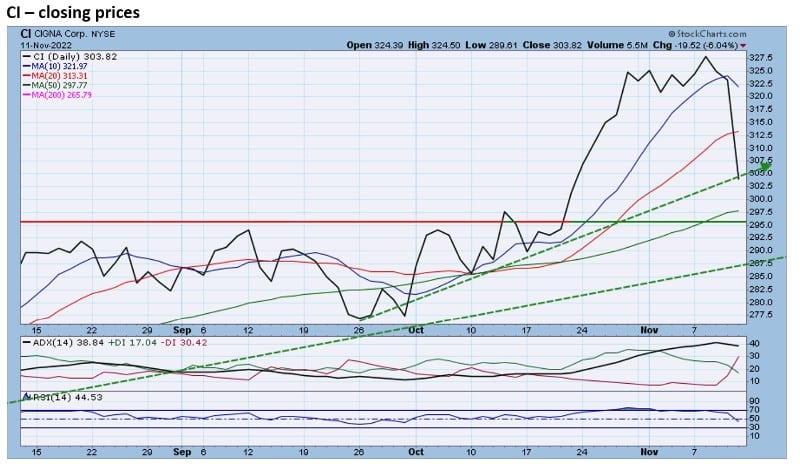
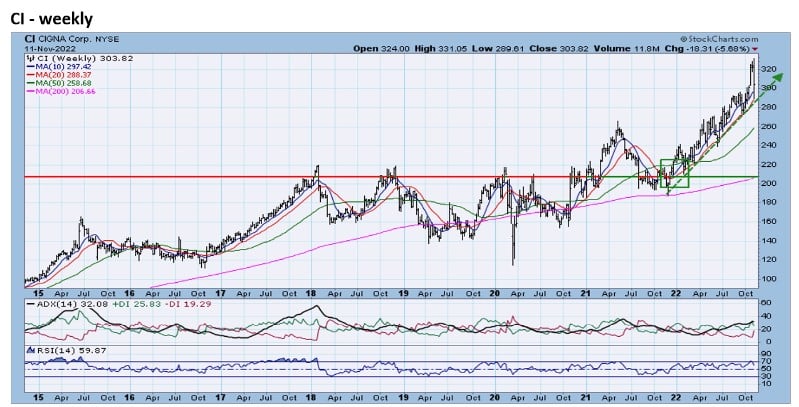
- CI has been in a steady uptrend since early December 2021. Ci’s 6% decline on Friday puts CI right at 12-month uptrend support (see zoom chart and the closing chart 3). The weekly chart reveals that the current uptrend results from a critical long-term breakout in 2021.
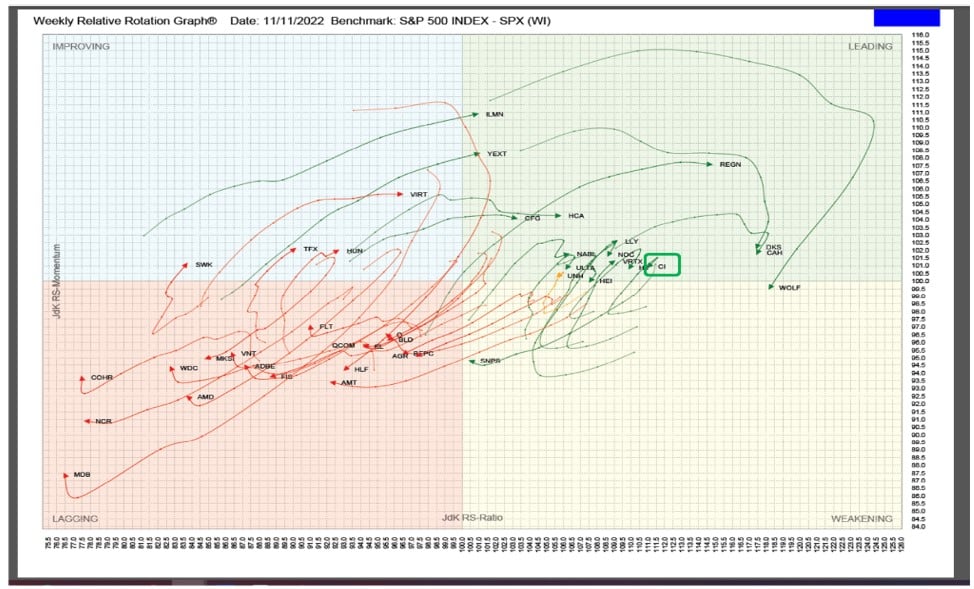
RRG analysis shows that CI is in the Leading quadrant, but has not moved to an extreme position yet.
Relative Rotation Graphs (RRG) – explanation video


Jeff Marcus founded Turning Point Analytics (TPA) in 2009 after 25 years on trading desks and 13 years as a head trader to provide strategic and technical research to institutional clients. Turning Point Analytics (TPA) provides a unique strategy that works as an overlay to clients’ good fundamental analysis. After 10 years of serving only large institutions, TPA now offers its research services to mid and small managers, RIA’s, and wealthy sophisticated individuals looking for a way to increase their returns and outperform their peers.
Subscribe 2 Week Trial
Customer Relationship Summary (Form CRS)