


On April 14, 2021, shares of Coinbase, a cryptocurrency broker/custodian, were first publically traded. The shares peaked at $429.50 a share that day, well above the reference point of $250 set the night before. Since peaking in its first hours of trading, Coinbase has grossly underwhelmed expectations. Coinbase shares are now down nearly 90% from the intraday peak and under severe pressure due to FTX’s bankruptcy and the poor performance of cryptocurrencies.
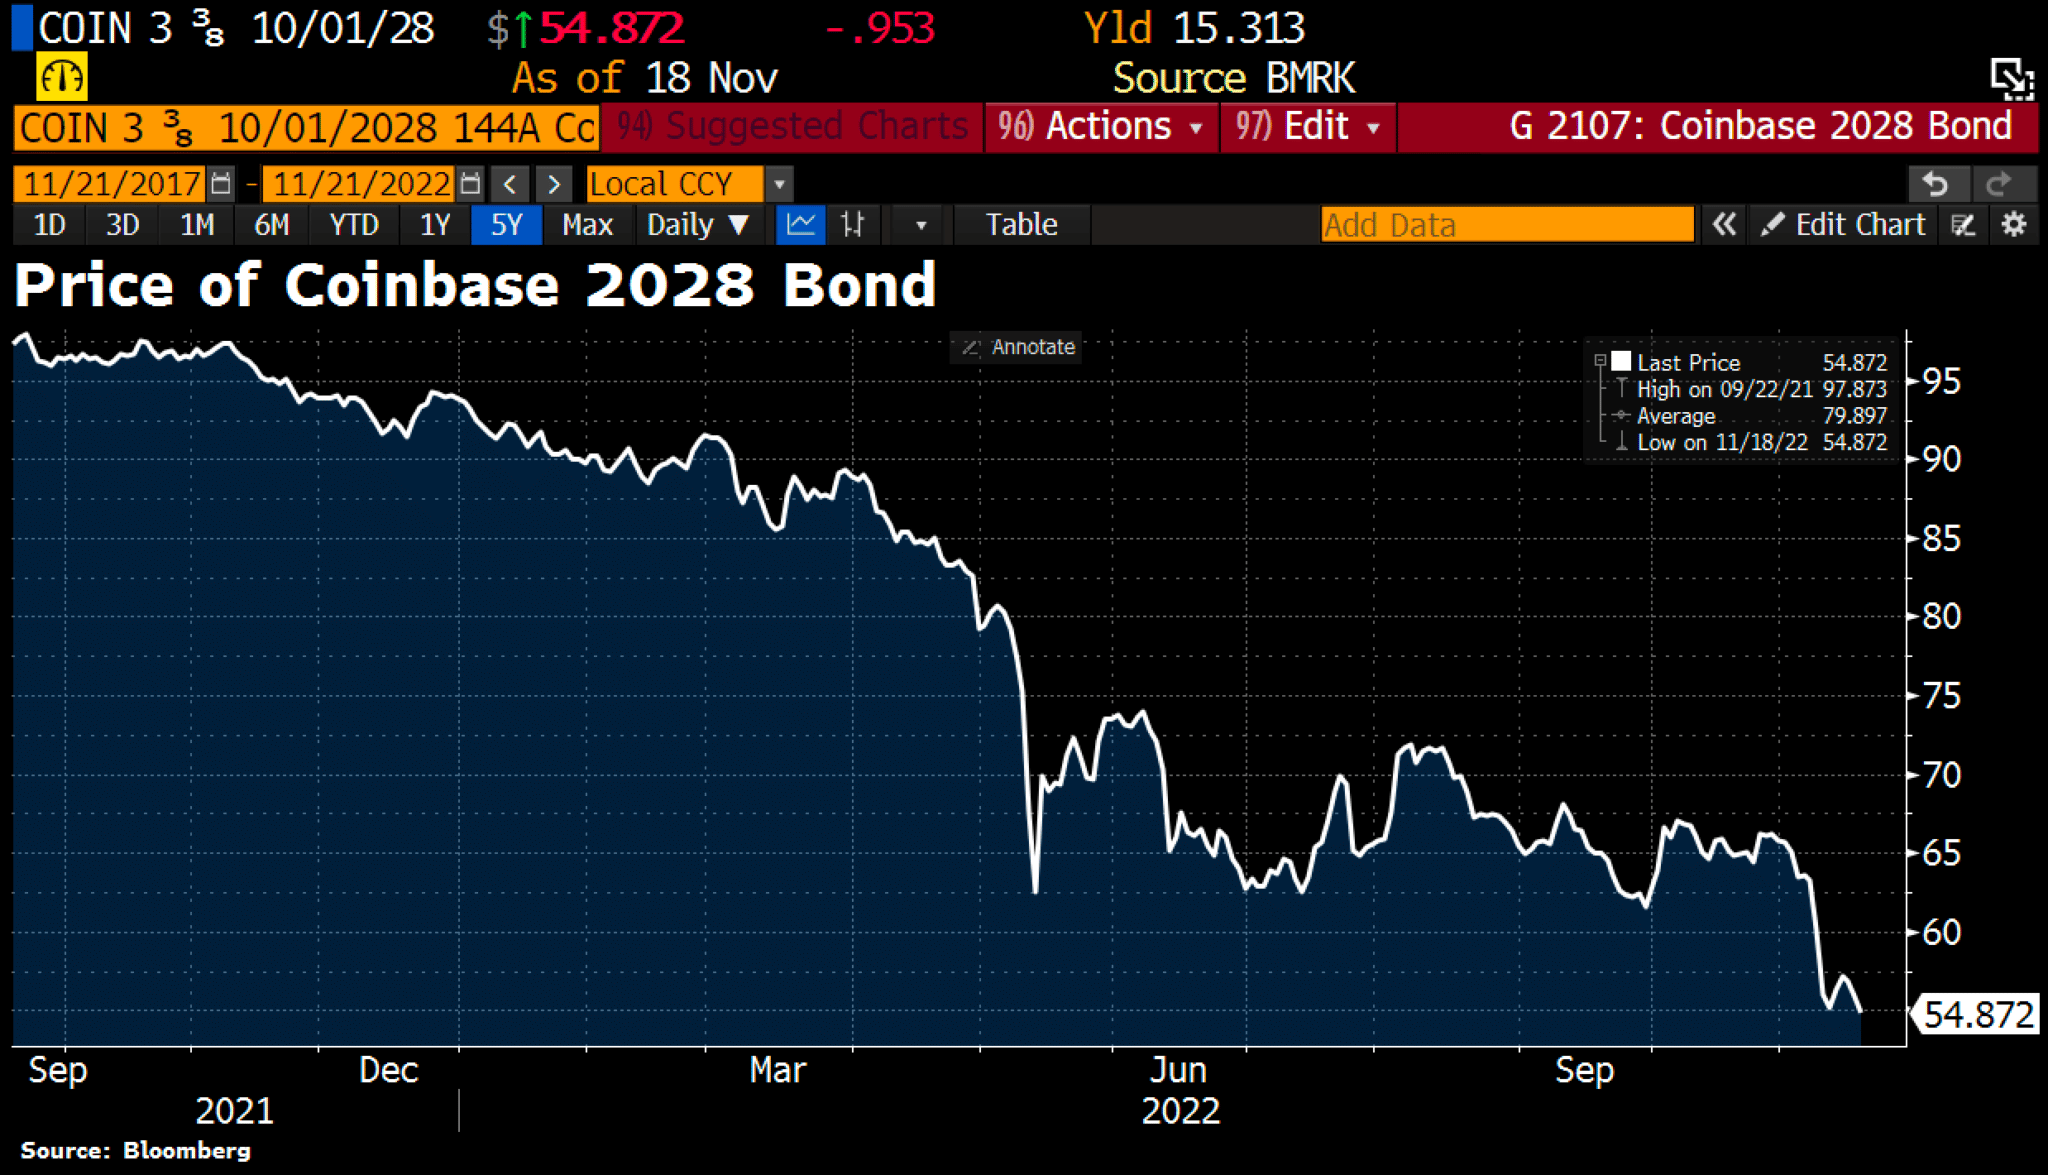
Further stoking concerns, Coinbase bonds are under similar pressure. The graph below charts the price of a 2028 Coinbase bond issued with a coupon/yield of 3.375%. The bond is now trading at 54 cents on the dollar, making its yield north of 15%. Accordingly, the bond market is pricing in a decent chance of bankruptcy. While removing FTX as a competitor may be good for Coinbase, evaporating confidence and skepticism in crypto and its infrastructure are weighing on the entire industry.

What To Watch Today
Economy
- 10:00 a.m. ET: Richmond Fed Manufacturing Activity Index, November (-8 expected, -10 prior)
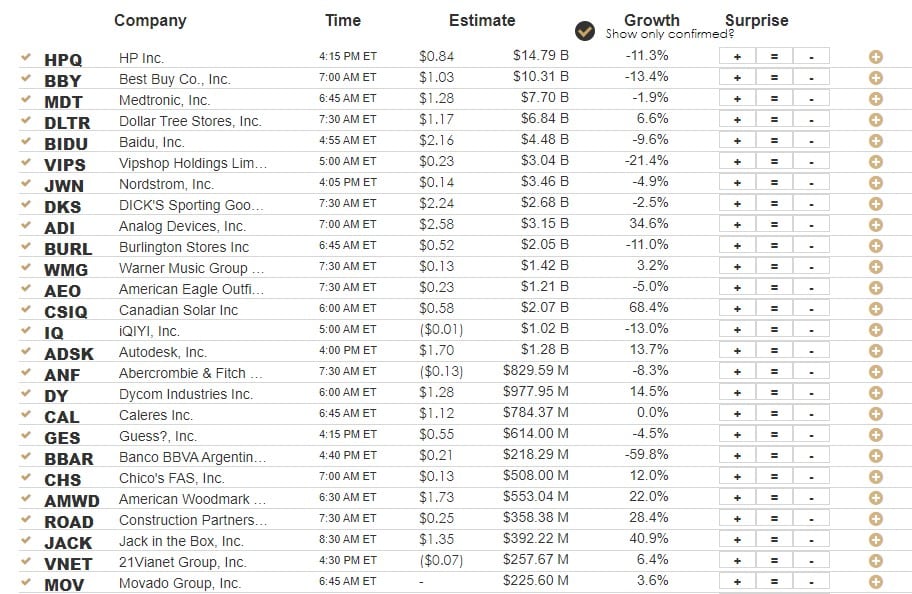
Earnings
Market Trading Update
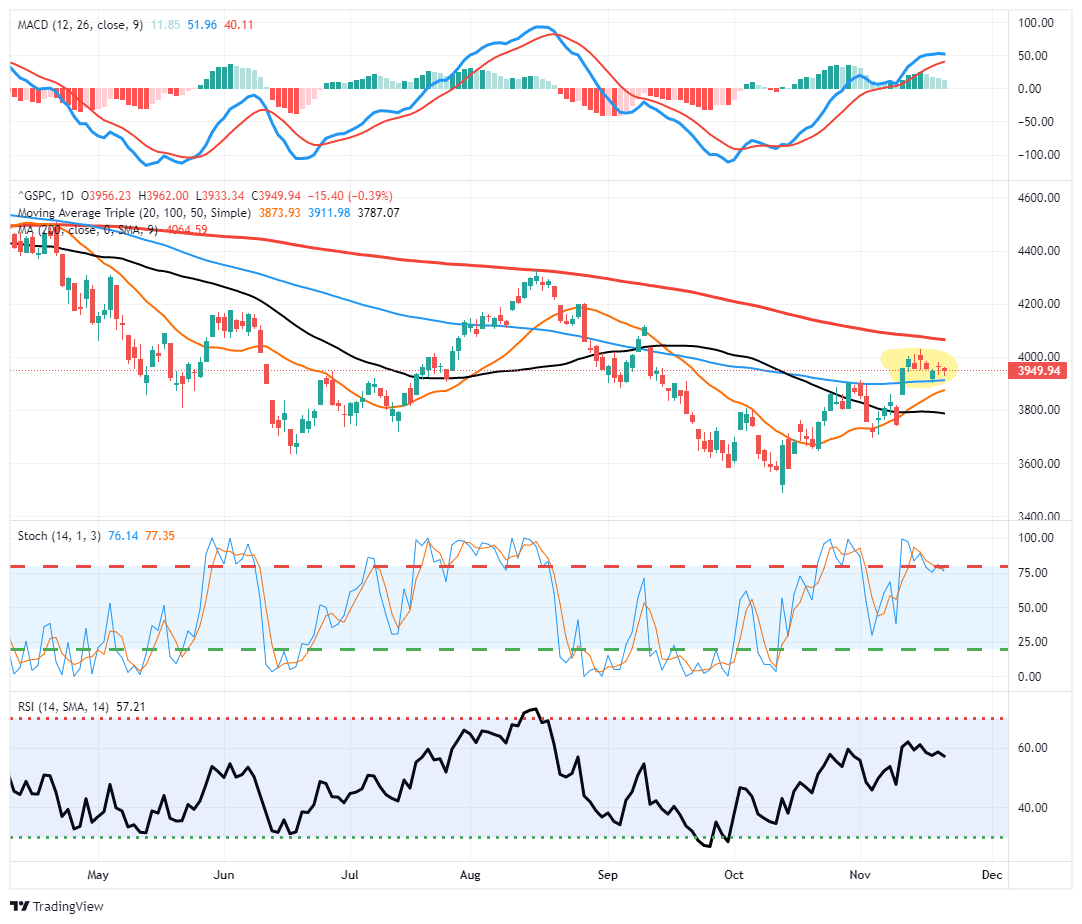
With the holiday-shortened trading week upon us, the market drifted sideways yesterday, still holding above key support of the 100-dma. The 20-dma is rapidly approaching the 100-dma, which provides additional support at that level. We reduced some additional risk yesterday in portfolios and raised some more cash, as we have suggested for the last couple of weeks. The rally is getting a bit long, and after the holidays, we could see some tax loss harvesting and mutual fund rebalancing lower stocks a bit. However, this week, don’t pay too much attention to the overall action as it is low volume and will likely have little direction.
Spinning Tops and the Latest Rally?
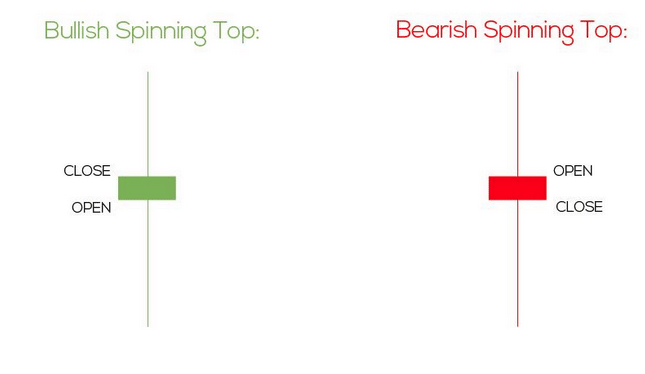
A spinning top is a technical pattern using candlestick charts. The illustration below shows that a spinning top denotes a period where the market opens and closes at similar levels. Still, within the period, it witnesses significant upward and downward volatility. A spinning top represents indecision and tends to be more relevant in trending markets. Per Think Markets:
In a strong uptrend or downtrend, the spinning top shows there is a new balance of forces in the price action. Unlike the previous sessions, where one side dominated the market and pushed the price action in its desired direction, a spinning top signals that the opposite side of the market is now growing in the game, and the short-term outcome is uncertain.
As with almost all candlestick patterns, the role of the next candle is important.
In case of a reversal, the candle next to the spinning top should be opposite of the prevailing trend, while for continuation patterns, you look for a candle that goes in the same direction to confirm that the price action is continuing in the same direction.
We introduce spinning tops as they have marked the peaks in the recent trend channel, as shared below. After setting a record high in late 2021, the S&P 500 proceeded lower in downward movements and sharp relief rallies. The first two rallies, using weekly charts, were capped by spinning tops. Does last week’s spinning top candle signify the recent bounce is over?

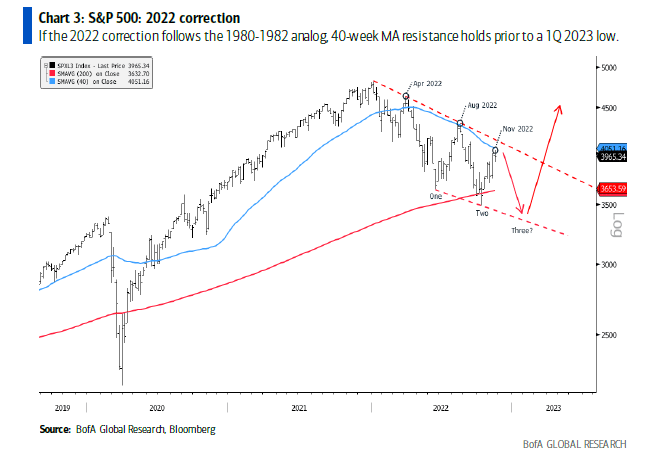
Bullish and Bearish Market Analogs
Market analogs compare chart patterns from two periods to help forecast the future. Some believe that prior trends and patterns often repeat themselves. One popular analog today is a comparison of 2008 to current conditions. The first chart below shows that the year’s sell-off remains similar to 2008. This bearish analog suggests a significant decline ahead.
The second set of graphs presents a more bullish analog. The decline this year has formed a declining trend channel. The top resistance line connects the three lower highs. Support is formed by connecting the two lower lows. 1981-1982 played out similarly, with three peaks and troughs defining the channel. Ultimately the third low was the final low, and the market broke upward through the channel. By mid-July 1982, when it broke out of the channel, inflation was still hot at 6.5% but well below the recent high of 14.5%. Inflation is showing signs of peaking and declining, albeit at much lower levels than in 1981. Analogs can be helpful at times but are often right until proven wrong.


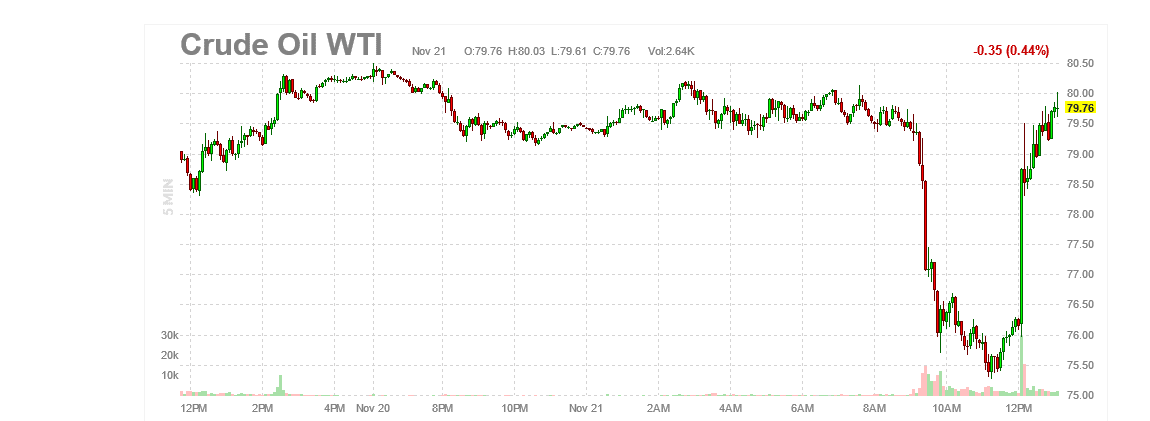
Crude Oil Keeps Falling
Crude oil fell over 5% Monday morning on a report that OPEC may boost production by half a million daily barrels. Within hours the report was rebuked, and crude oil erased the morning’s decline. While trading has generally been bearish over the last few weeks, President Biden may supply a bid to the market as he seeks to replenish the Strategic Petroleum Reserves (SPR).
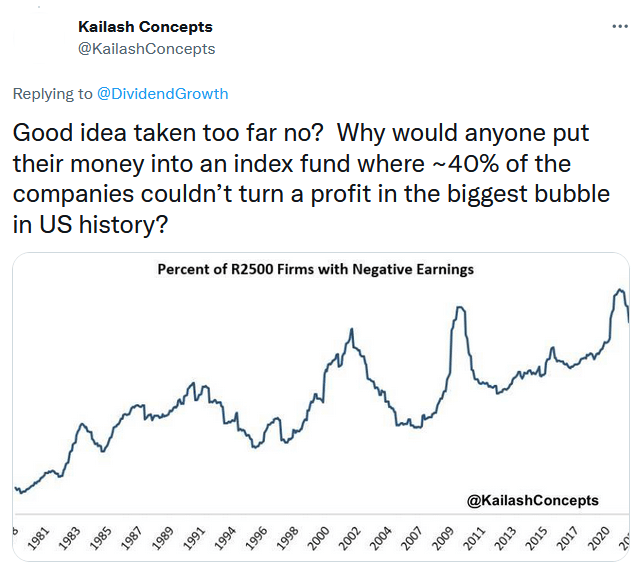
Tweet of the Day
Please subscribe to the daily commentary to receive these updates every morning before the opening bell.
If you found this blog useful, please send it to someone else, share it on social media, or contact us to set up a meeting.