


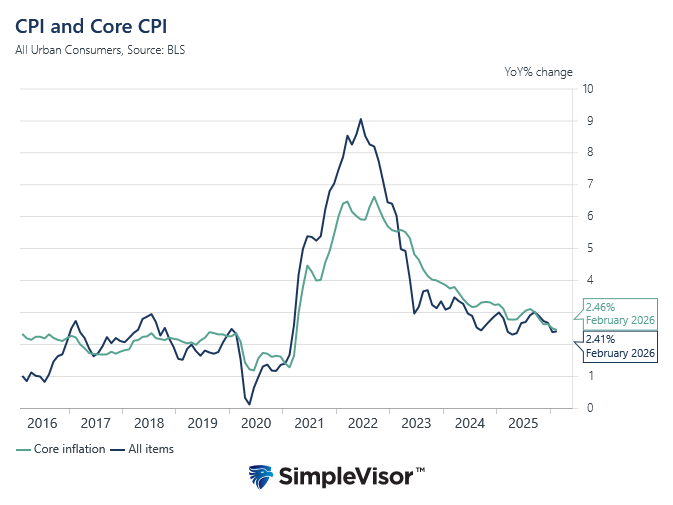
The February CPI report was largely as expected. The month-over-month headline figure rose by 0.3%, bringing the year-over-year rate to 2.4%. Core CPI, excluding food and energy, rose by only 0.2%, dropping the annual rate to 2.5%, the lowest since March 2021. The graph below shows that CPI and Core CPI continue to slowly decline toward pre-pandemic levels. It’s important to note that the CPI report is based on data from before the Iran conflict started. We suspect the impacts of higher oil prices will appear in the next report, but it could take a few months for the full effect to be evident. To wit, within BLS computations, gasoline prices tend to lag by two to four weeks, fuel oil by one month, and natural gas and electricity by up to three months. Moreover, the oil and oil-derived chemicals required to produce certain goods, such as plastics and some chemicals, can take even longer to appear in the BLS inflation data.
For markets and the Fed, the report likely does nothing to change the near-term monetary policy outlook. Inflation remains above the Fed’s 2% target, reinforcing expectations that policymakers will remain patient and are in no hurry to cut rates. Further adding to their caution is not just oil prices, but how economic activity and consumer and business sentiment respond to the conflict. It’s likely the Fed will continue to focus on Core CPI, as they likely realize the price spike in energy prices is temporary. Furthermore, changes to policy will have no impact on the conflict or oil prices. However, if the economy starts stalling, lower rates can support economic activity.
What To Watch Today
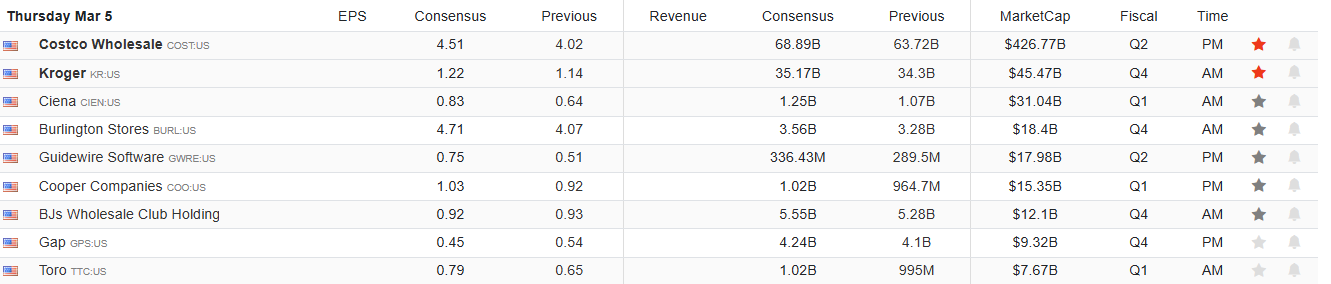
Earnings
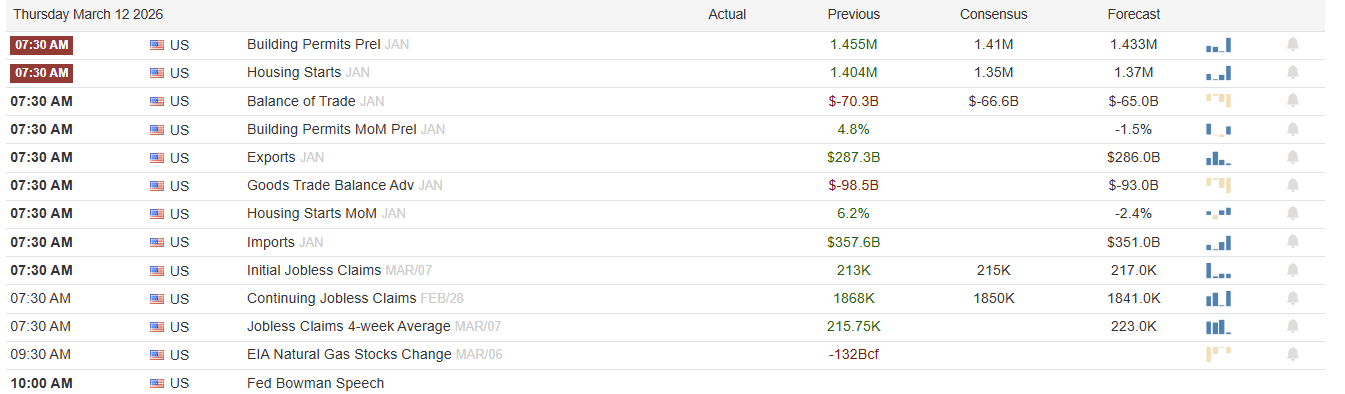
Economy
Market Trading Update
Yesterday, we discussed the market rotation. While the market has been holding up as of late, “trapped longs” remain the biggest hurdle.
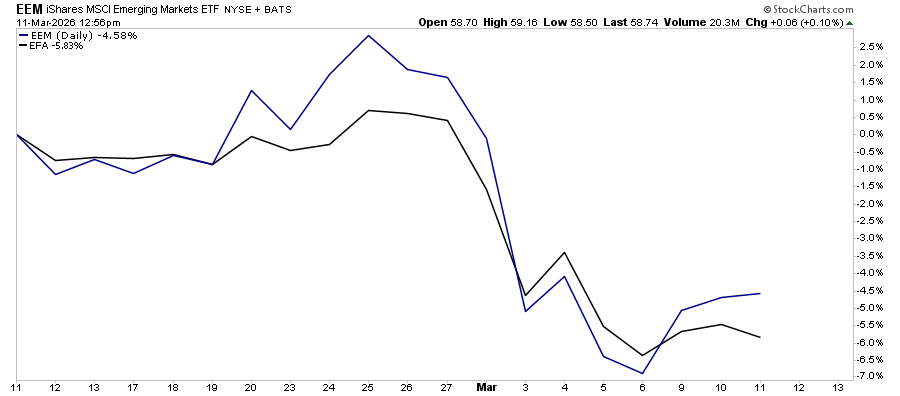
One of the most underappreciated dynamics in the current market environment isn’t the Iran conflict, the oil spike, or even the Fed’s recalibrating rate path. It’s the growing weight of trapped investors who were buying into the market in February. The problem now is that they are sitting on losses they didn’t plan for, particularly in Emerging and International markets. Understanding this dynamic is essential for managing risk intelligently in the weeks ahead.
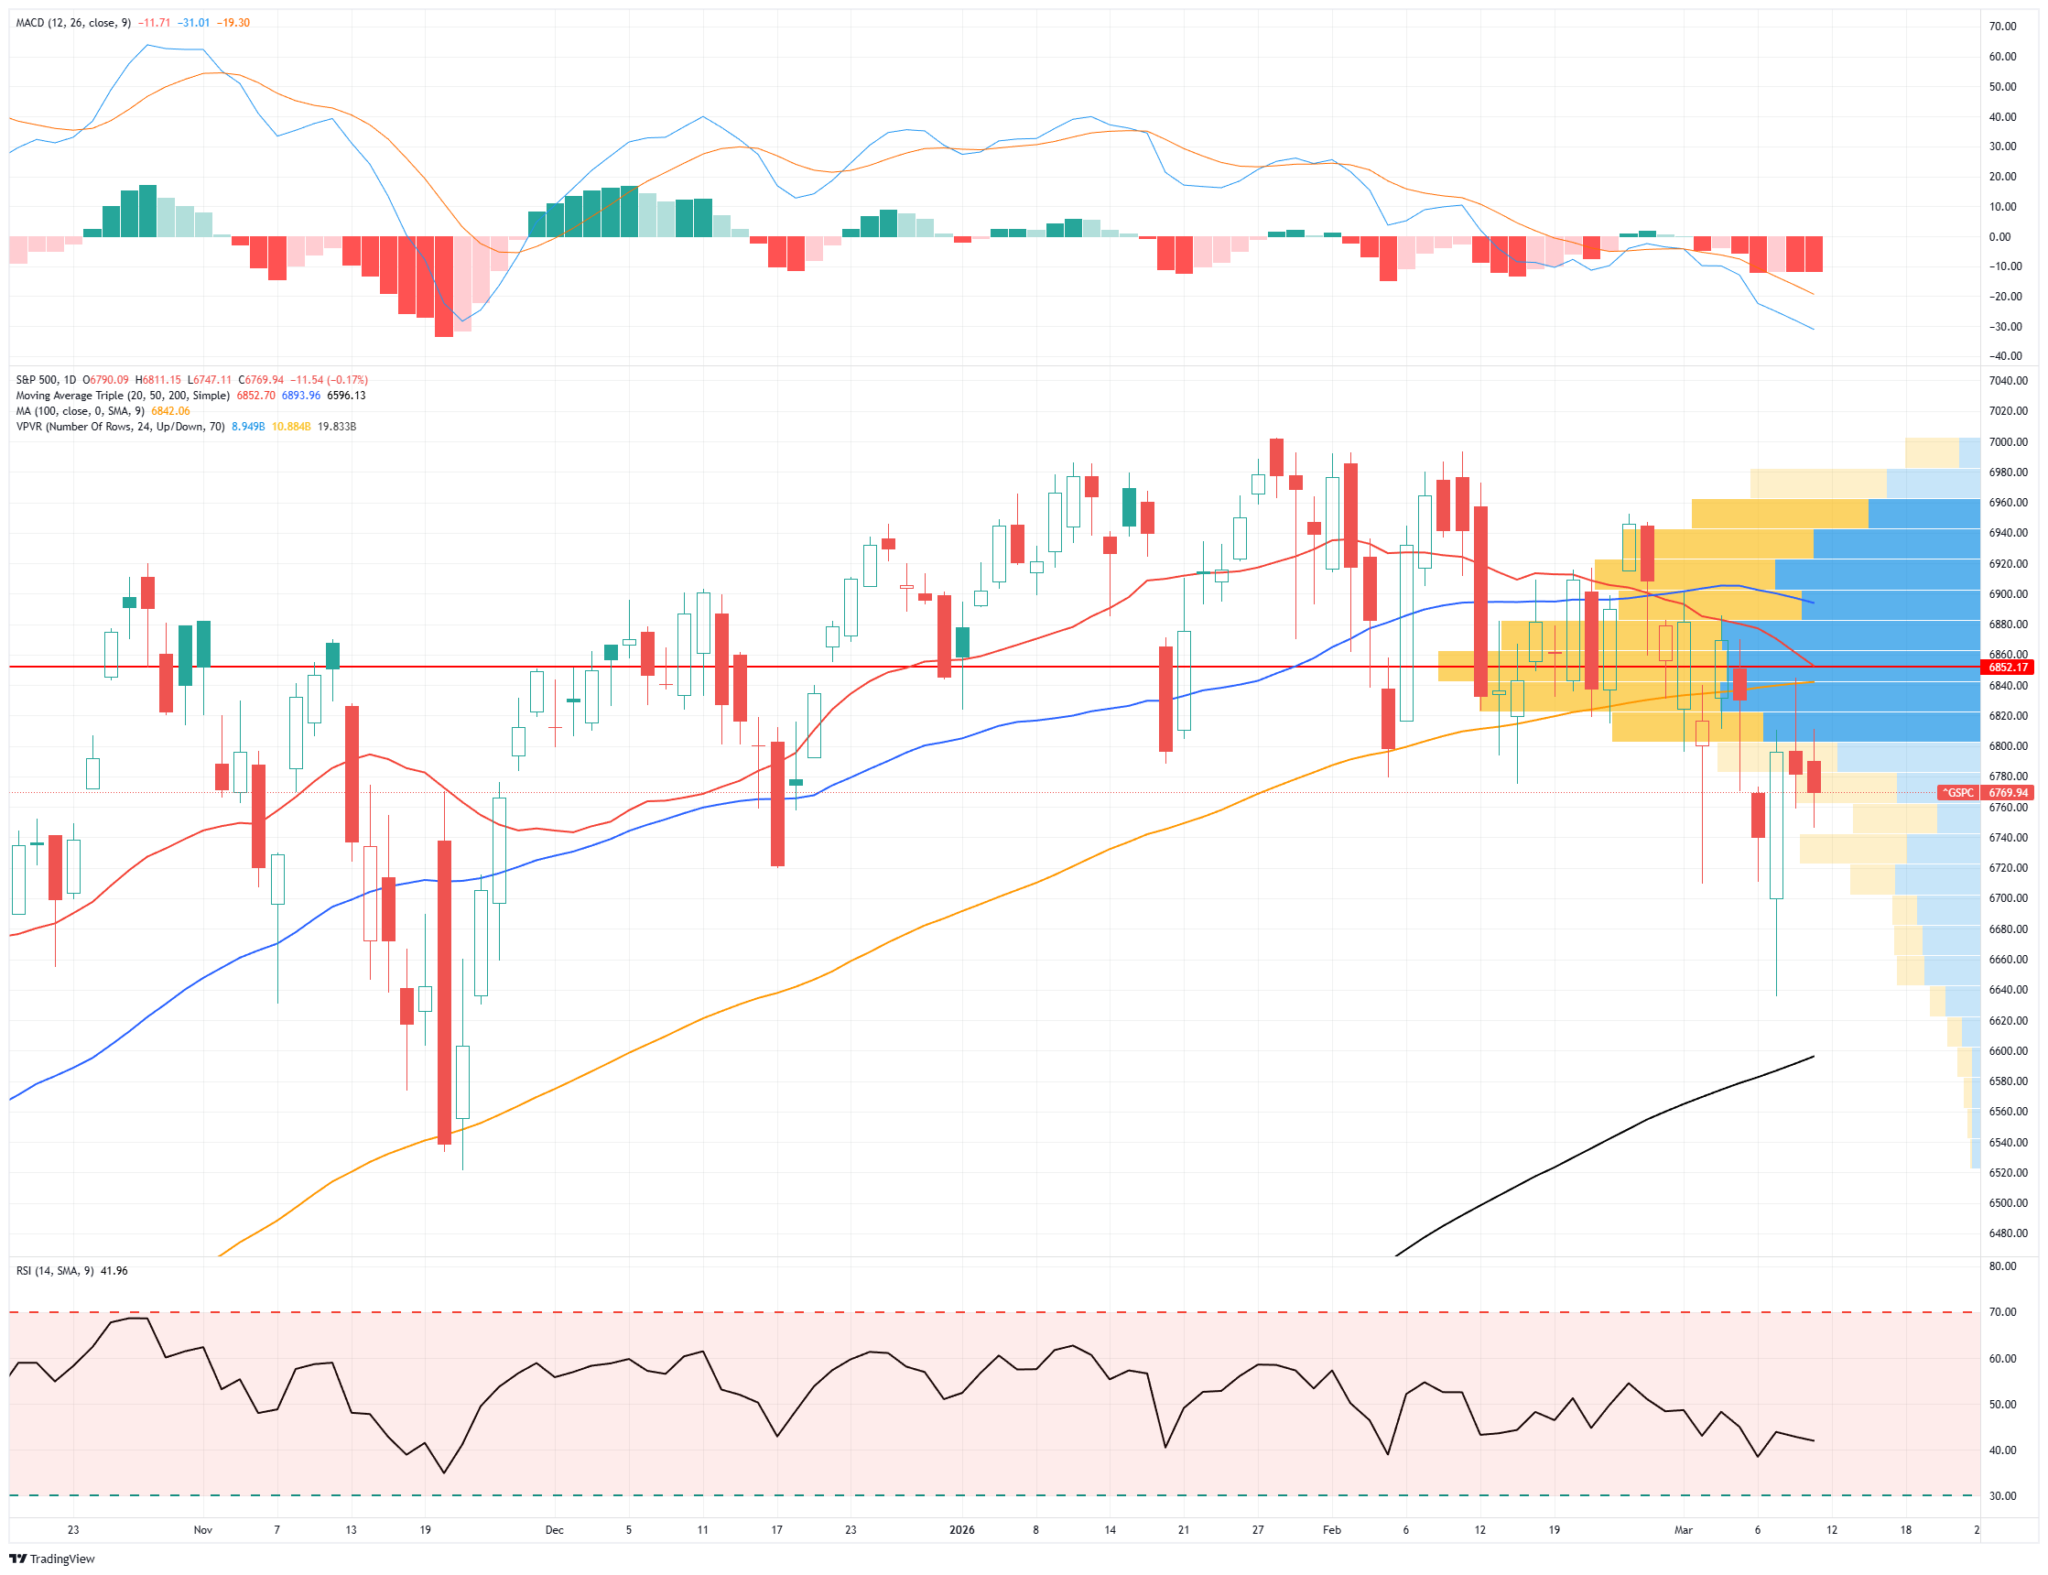
The volume profile clearly tells the story. The Point of Control for the past 90 days sits in the 6,860–6,900 range on the S&P 500, meaning that’s where the heaviest concentration of transactions occurred during the recent consolidation phase. With the index now trading well below that zone, the majority of those positions are underwater. That matters enormously for what happens next — because it fundamentally changes the behavioral calculus of a large swath of market participants.
Here’s the mechanics: when investors are trapped in losing positions, they don’t behave like buyers, but sellers-in-waiting. This is what we term “trapped longs,” as every relief rally, every bounce on a ceasefire rumor, a dovish Fed comment, or a better-than-expected data print, becomes an exit opportunity rather than a signal to add exposure. The market simply cannot sustain upside when a significant cohort of participants is focused on getting back to even rather than building new positions.
This dynamic is distinct from general bearish sentiment, and that distinction matters. It’s structural. It doesn’t require panic or capitulation to be damaging, nor does it need a catalyst to keep the pressure on. It just requires patience from sellers and impatience from bulls, a combination that produces grinding, choppy action with a downward bias and violent but ultimately failed rallies. That’s precisely the tape pattern we’ve seen over the past two weeks.
There’s also a compounding factor worth noting. Many of the positions accumulated in the 6,860–6,900 zone were built on momentum. That narrative has since been complicated by geopolitical shock and a repricing of the rate environment. The fundamental thesis supporting those entries has weakened even as the technical damage has mounted, which makes the trapped long problem stickier than it would be in a pure technical correction.
For investors, this overhead supply zone should reframe how you think about positioning right now. Reducing exposure to strength, rather than chasing bounces, is the disciplined posture when the tape is littered with trapped longs. Until price can reclaim and hold convincingly above 6,860, every rally is a gift for sellers, not a green light for buyers.

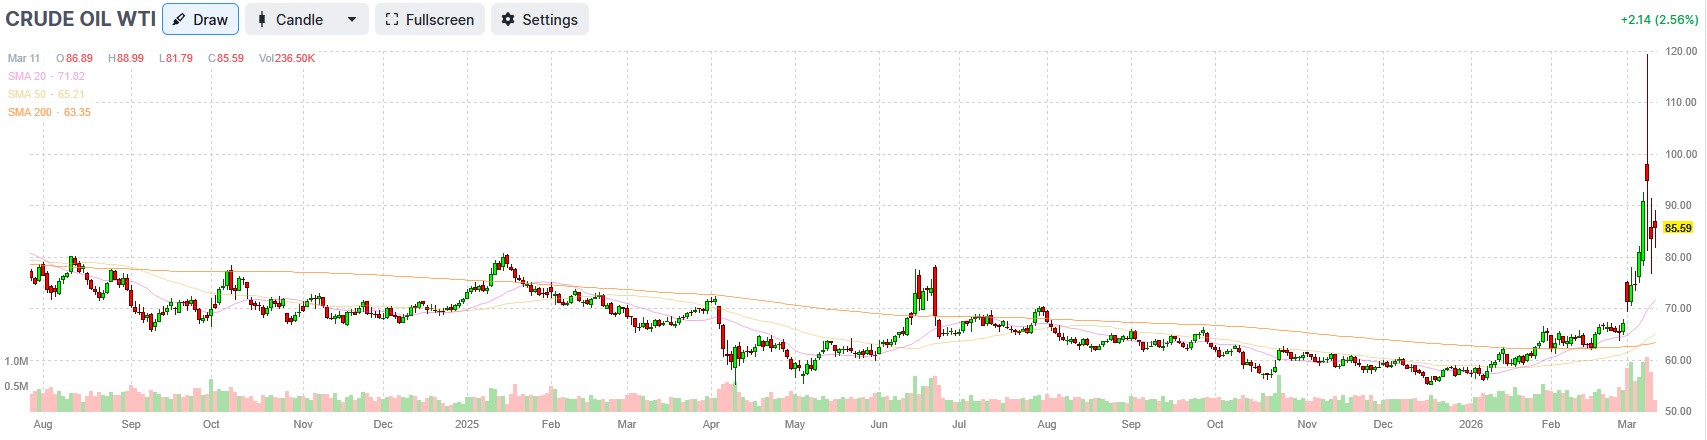
IEA To The Rescue
The International Energy Agency (IEA) is coordinating with its member nations on what could be the largest emergency oil release in history. Current headlines report that the IEA is coordinating the release of about 400 million barrels of crude from strategic reserves. The move comes as Iran is supposedly laying mines in the Strait of Hormuz, which could impact the oil supply for an extended period. By releasing oil from IEA member government stockpiles, policymakers hope to replenish some lost supply, calm markets, and, most importantly, reduce the “fear premium” building in energy prices. However, while strategic reserve releases can temporarily stabilize prices and signal coordinated action by consuming nations, they are generally seen as a short-term bridge rather than a long-term solution to supply disruptions. We share some pros and cons below.
Pros of IEA oil release:
- Additional supply can quickly cool speculative surges and reduce volatility in oil prices.
- The announcement alone calms markets, hopefully lowering the geopolitical risk premium embedded in crude prices.
- The joint cooperation signals coordinated global action to put a lid on oil prices
- Lower fuel costs can ease inflation pressure and support economic growth.
Cons of IEA oil release:
- Strategic reserve releases are temporary; they can only offset disruptions for weeks or months, not years.
- Drawing down reserves leaves less protection for future crises.
- Reserve releases cannot fully replace major disruptions, especially a prolonged closure of the Strait of Hormuz.
- Artificial supply can temporarily distort prices lower and discourage producers from increasing production.
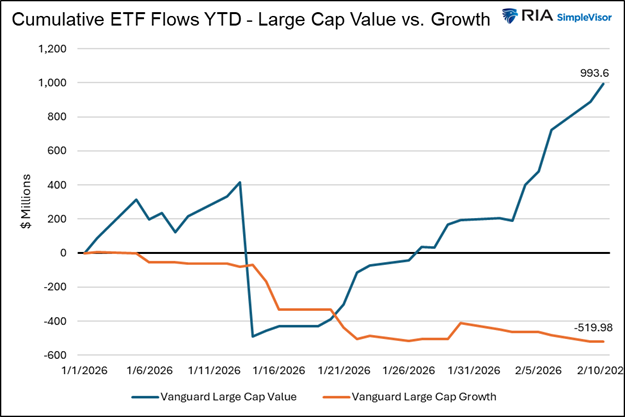
True Value: Looking Through The Value Illusion
True value investing has never been easy. But today’s passive investment environment has made it much more difficult. For example, a growing number of value investors buy value in name only. ETFs using the word “value” attract so-called value investors. At the same time, fewer and fewer investors are truly seeking out true value stocks. The result can be a stark divergence in the fortunes of perceived value and true value stocks. Ultimately, such market behaviors create incredible opportunities, but we warn that patience is required to wait for such differences to correct.
Tweet of the Day

“Want to achieve better long-term success in managing your portfolio? Here are our 15-trading rules for managing market risks.”
Please subscribe to the daily commentary to receive these updates every morning before the opening bell.
If you found this blog useful, please send it to someone else, share it on social media, or contact us to set up a meeting.