


The price of New York Community Bank (NYCB) was cut in half last week as it drastically increased its loan loss reserves. As we noted in a recent Commentary, they took this action partly because of the commercial real estate (CRE) loans they bought from the failed Signature Bank. The work-from-home movement and higher interest rates are crushing CRE values. As a result, the banks that made CRE loans may be on the hook if the borrower fails. On Sunday’s 60 Minutes, Powell admits CRE may be problematic for smaller banks. Regarding CRE, he stated:
We looked at the larger banks’ balance sheets, and it appears to be a manageable problem. There’s some smaller and regional banks that have concentrated exposures in these areas that are challenged.
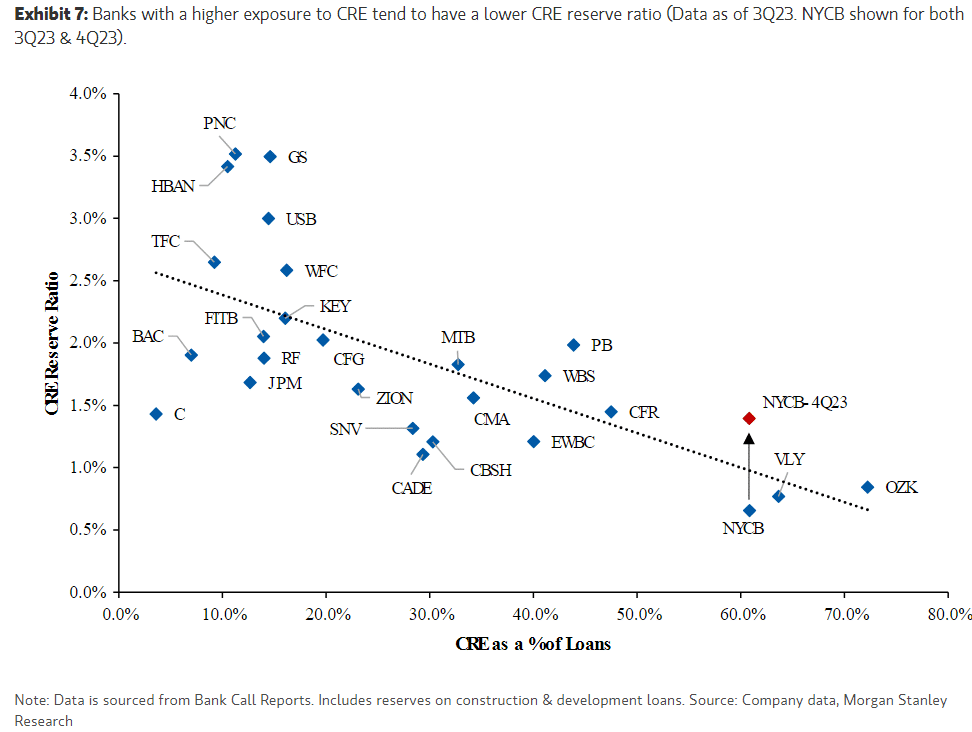
To help us better assess bank risks, we share a chart from Morgan Stanley. The graph compares the loan loss reserves banks hold for CRE loans versus their overall exposure to said loans. NYCB has high exposure to CRE. Furthermore, before last week’s action, they did not have adequate loan loss reserves. In general, CRE constitutes less than 20% of the larger bank holdings. However, we offer caution for smaller banks with 30% or more exposure and low loan loss reserves. This includes banks like ZION, CADE, VLY, and CBSH.
What To Watch Today
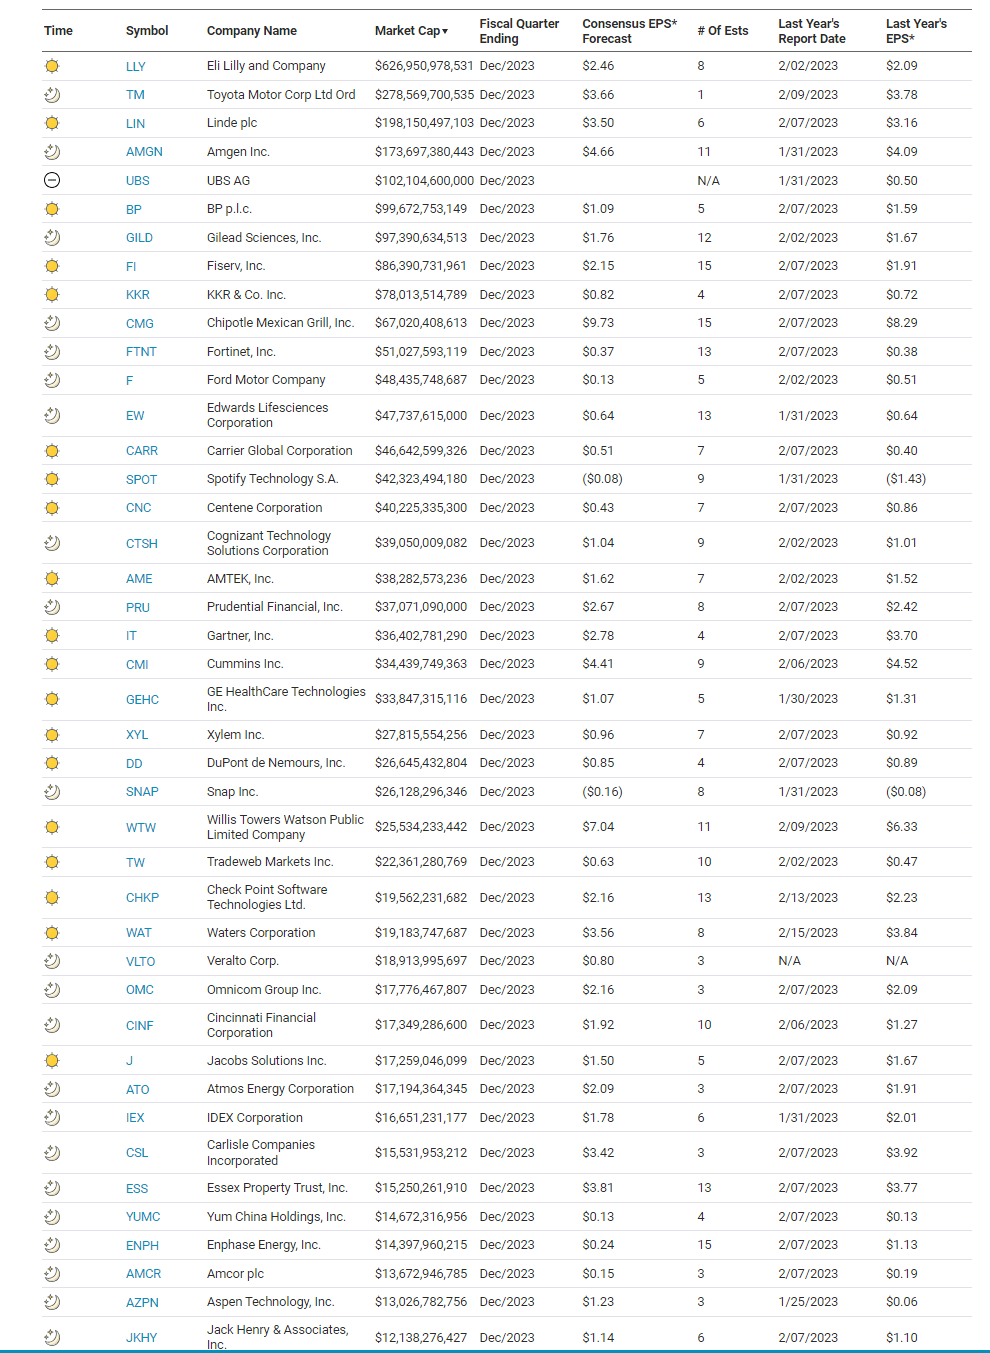
Earnings
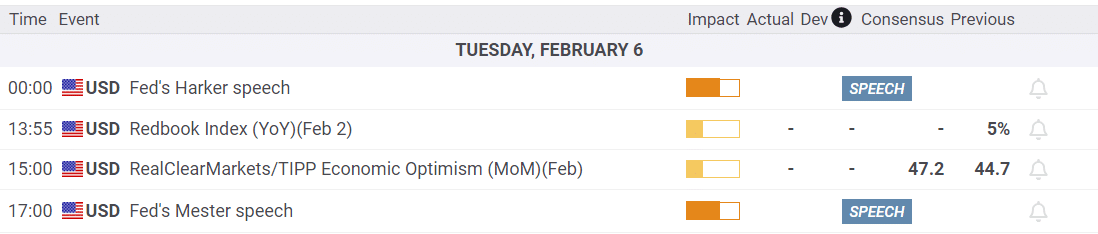
Economy
Market Trading Update
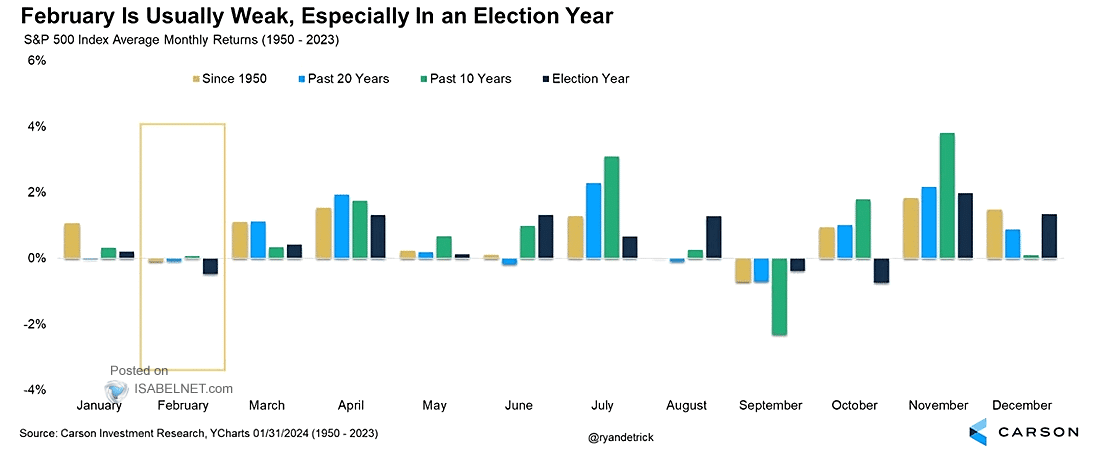
The market stumbled out of the gate yesterday, trading a bit weaker following last week’s surge to new highs. Currently, the market is just a “stone’s throw” from the psychological level of 5,000, which is most likely inevitable at this juncture. As noted in yesterday’s commentary, we continue to expect a correction to resolve current overbought conditions, and the month of February tends to trade weaker particularly when following a very strong January advance.
While the market remains in a strongly bullish trend, such does preclude the market from some type of corrective activity to reduce more extreme overbought conditions, as shown in our weekly composite technical gauge. Readings above 90 have historically preceded short-term corrective actions and broader market declines.
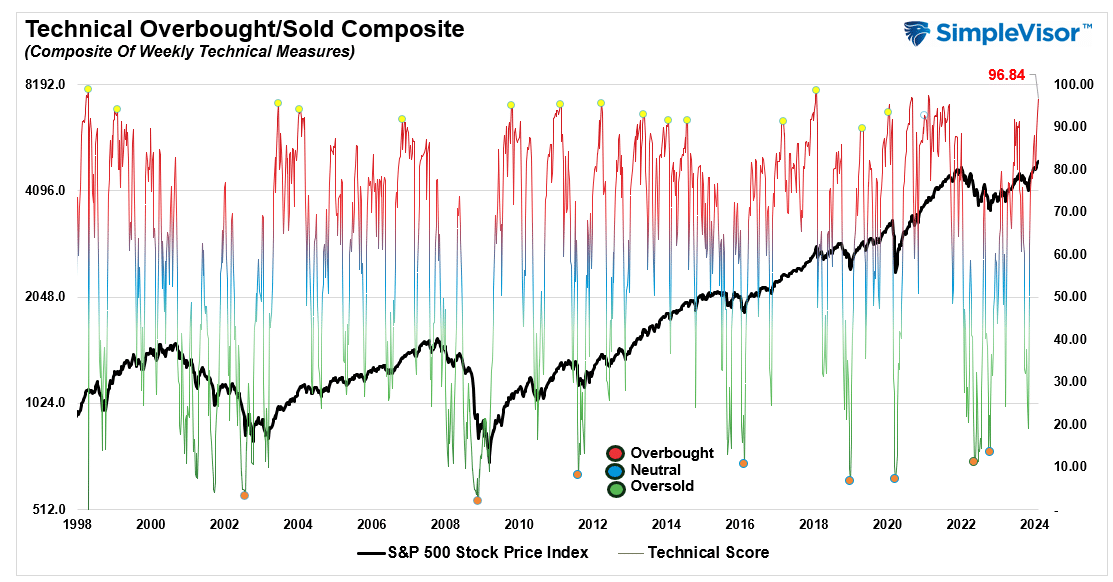
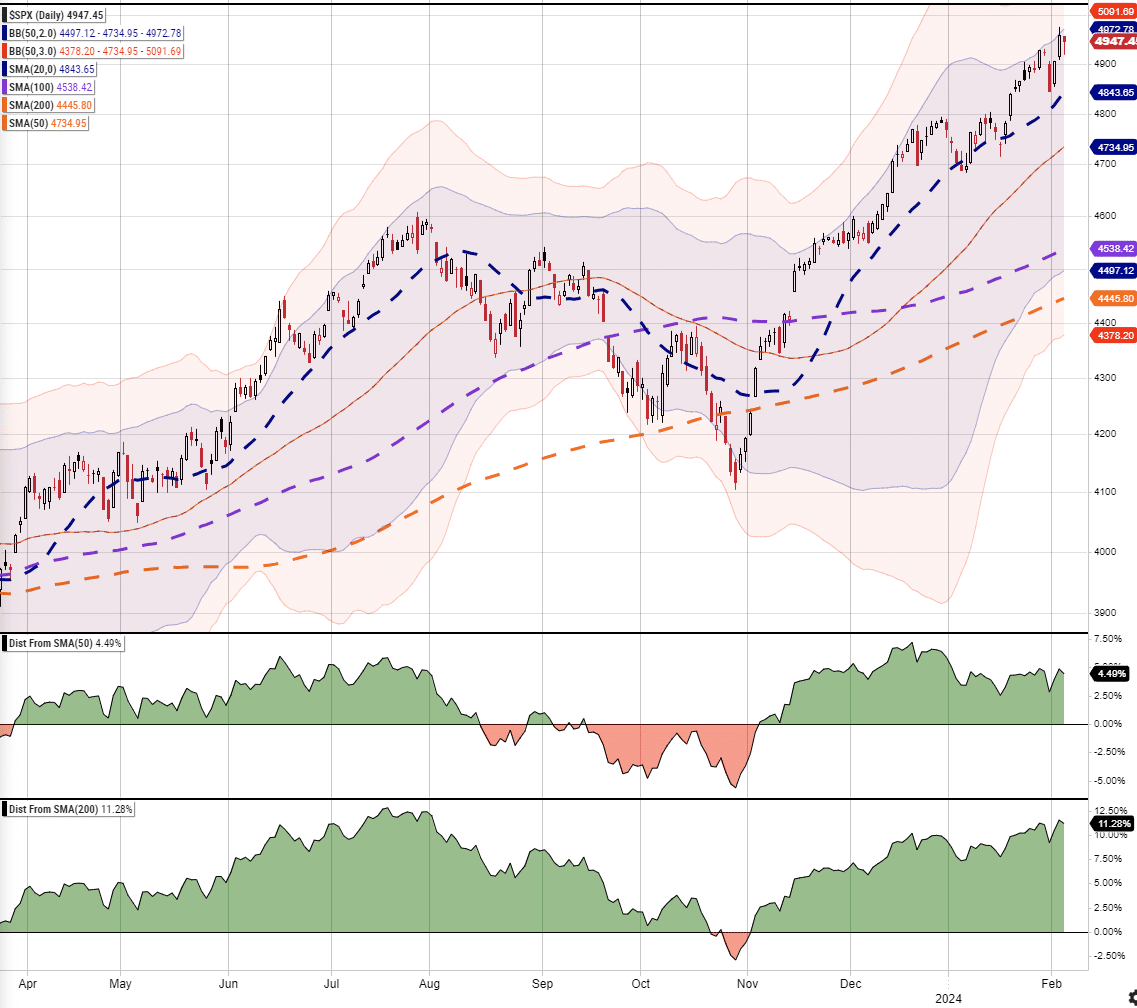
With the market overbought, pushing into 2-standard deviations above the 50-DMA, and well deviating above the 50- and 200-DMA, the conditions for a short-term reversal are present.
Earnings have continued to support the bullish momentum so far, but by the end of this week, a majority of those earnings will have been reported. Look for weakness in the latter half of February to increase equity exposures as needed.

More On The Jobs Divergence
Monday’s Commentary discussed the recent BLS jobs data and, in particular, pointed out the odd discrepancy between the two surveys used to calculate the report. To wit:
The biggest puzzle is the stark difference between the establishment and household surveys. The BLS establishment figure uses surveys of large companies to calculate the headline +353k number that is widely reported. The household survey gets its data from individuals. This data feeds the unemployment rate. The Household survey reported that the economy lost 31k jobs last month. The graph below shows the growing divergence between the two. In the previous two months, the household survey reported a loss of 714k jobs, while the establishment survey reported a gain of 686k.
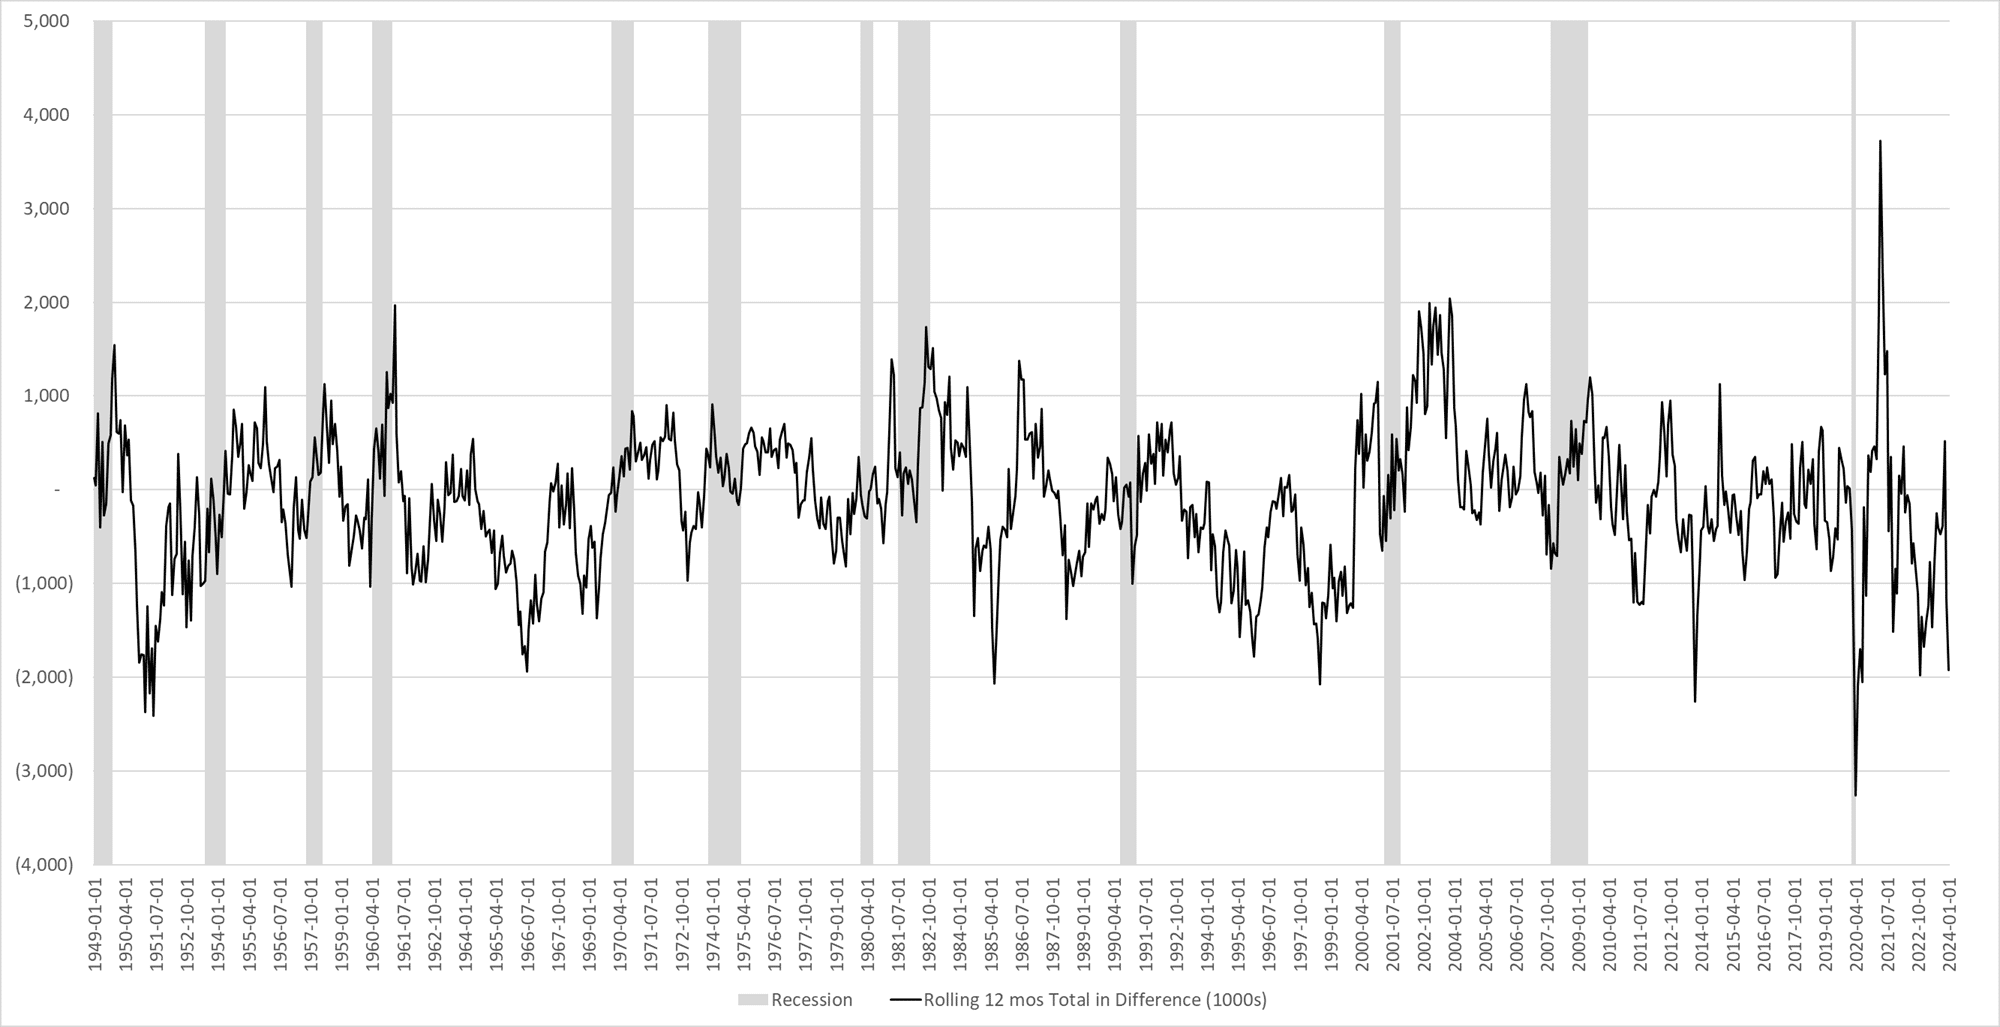
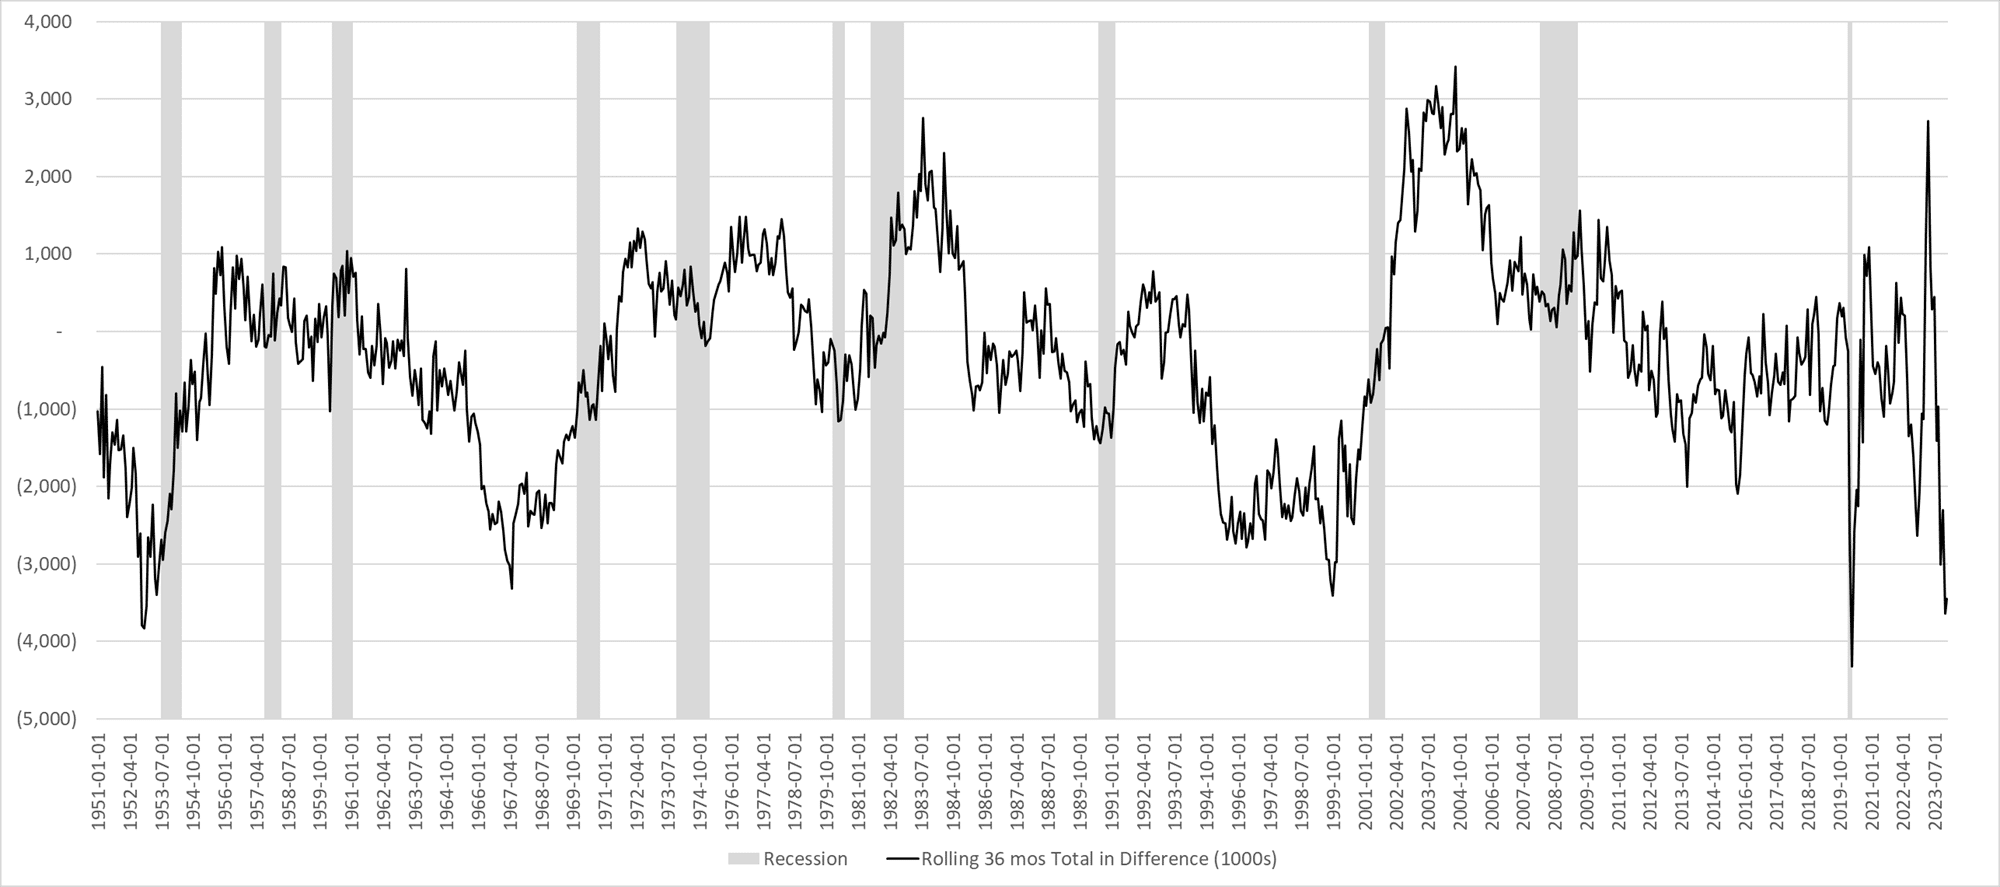
An inquisitive client of ours decided to expand on our findings. Therefore, as he highlights below, the 12-month cumulative difference between the two surveys is nearly 2 million jobs. Other than for a brief instance in early 2020, the current divergence is about as wide as it gets over the last 70 years. The second graph smoothes out the cumulative data over three years. As it shows, the establishment survey has reported 3.5 million more jobs than the household survey.
He correctly sums up his graphs as follows:
However, as the graphs indicate, usually this difference “snaps back” over time. So, if history serves as any precursor my guess is not only will the BLS be doing their usual revisions to jobs data over time, but the monthly change in establishment Survey will be more in line w the household Survey over time.
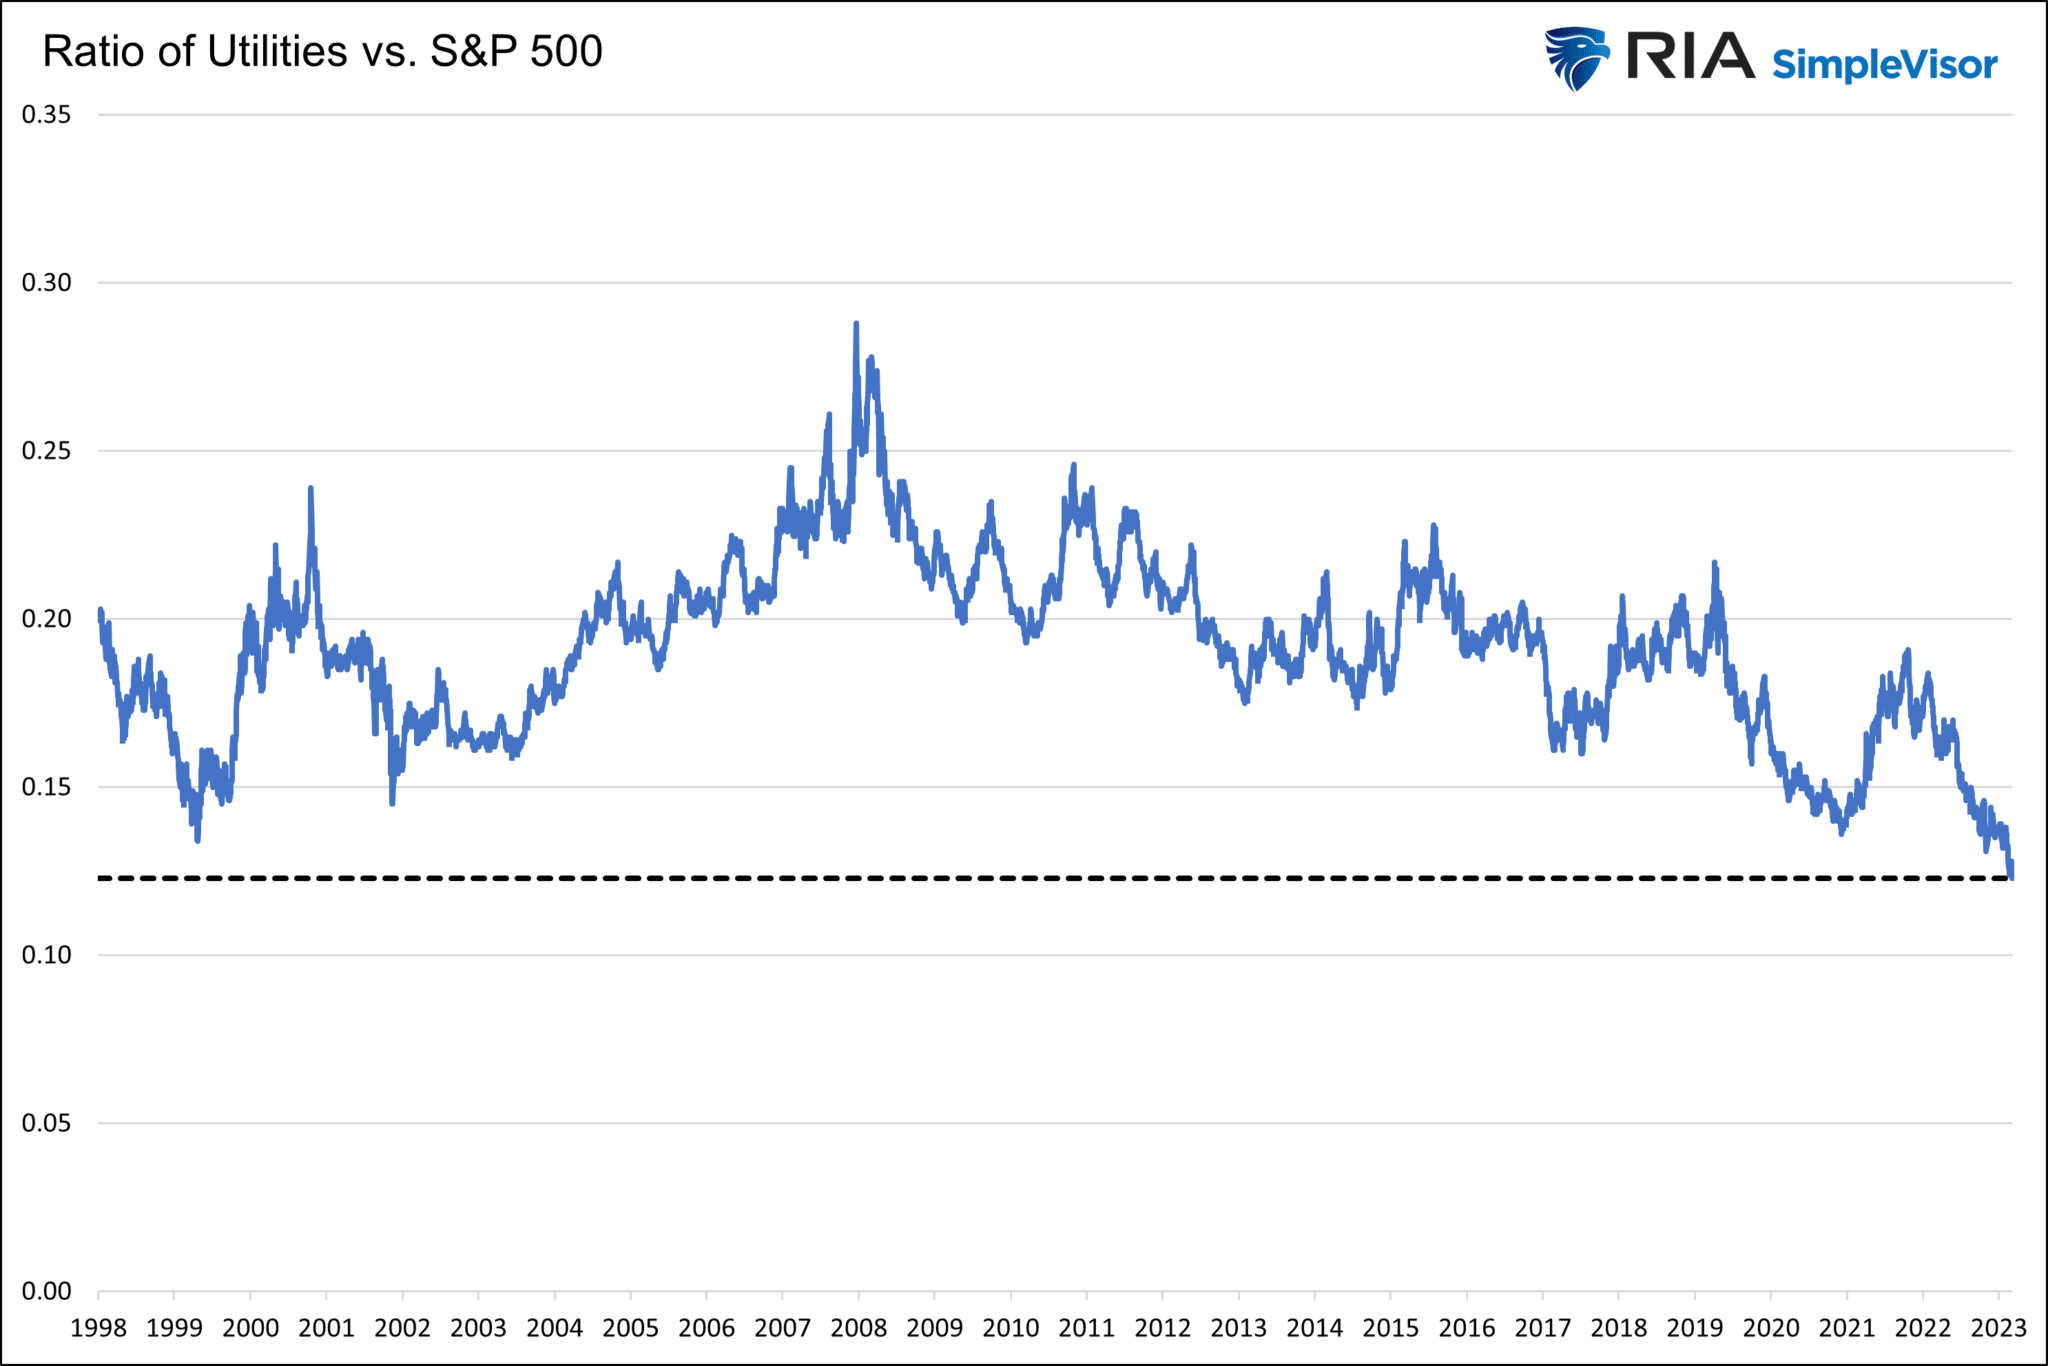
Utilities Are Dirt Cheap
The price of the Utility sector (XLU) is now trading at a 25-year low in relation to the market (S&P) 500. Since peaking in 2008, the ratio of utilities to the S&P 500 has set a series of lower highs and lower lows. Based on the graph, it appears that utilities may be due for a bounce versus the market. Lower interest rates and or a weaker stock market could lead to such an event. However, we caution you that the trend is clearly not your friend.
Tweet of the Day

“Want to have better long-term success in managing your portfolio? Here are our 15-trading rules for managing market risks.”
Please subscribe to the daily commentary to receive these updates every morning before the opening bell.
If you found this blog useful, please send it to someone else, share it on social media, or contact us to set up a meeting.
Post Views: 0
2024/02/06