


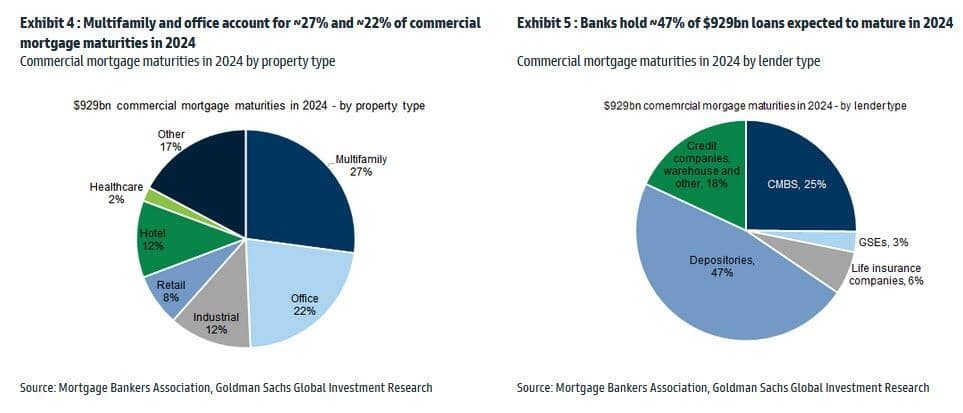
The following commentary is from The National Bureau of Economic Research (NBER). The NBER claims that “about 44% of office loans appear to have negative equity.” “Furthermore: A 10% (20%) default rate on CRE loans – a range close to what one saw in the Great Recession on the lower end — would result in about $80 ($160) billion of additional bank losses.” Interestingly, they note the importance of interest rates. They say that not one of those CRE loans would default if interest rates were back to early 2022 levels.
With that, consider the pie charts below from Goldman Sachs. There are approximately $1 trillion in maturing CRE loans this year. Not only will the debt reset at significantly higher interest rates, but in the case of office space, the financial support backing the loans will be compromised due to high vacancy rates and declining building valuations. If rollover financing isn’t secured, bankruptcy is the likely outcome. Now, consider that regional banks, with less financial wherewithal than large banks, are on the hook for many maturing office loans. On the brighter side, the NBER authors argue the Federal Reserve could stave off further distress with lower interest rates.
What To Watch Today
Earnings
- No notable earnings releases today
Economy

Market Trading Update
Last week, we discussed whether this is a short-term market top or a bubble. In that discussion, we noted that the ongoing bullish trend remains intact, with the market trading from the top of the trendline to the 20-DMA. After a rally to all-time highs, the market again traded lower on Thursday and Friday to finish at the 20-DMA.
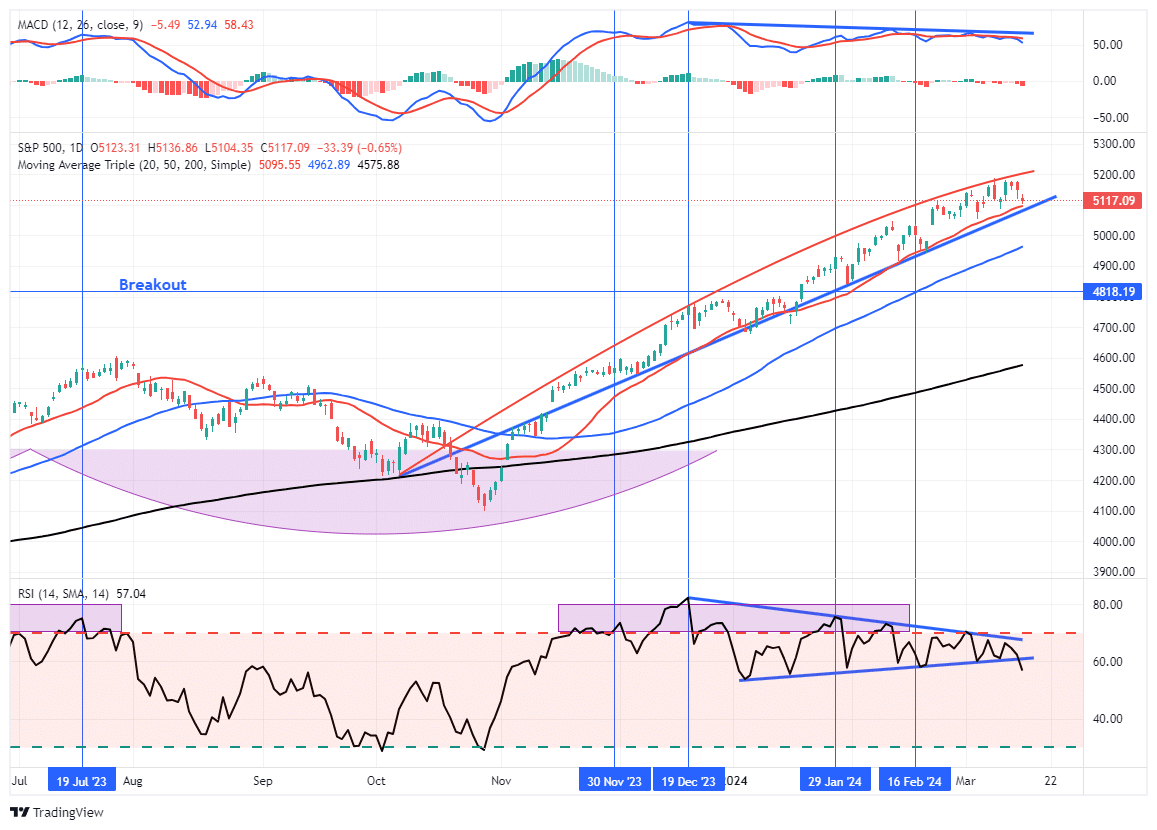
However, some differences this week suggest we may see a further correction next week. The market was trading in a very defined bullish trend channel. Over the last two weeks, the advance has begun to taper off, and a more rounded top may be forming. While the 20-DMA continues to act as support, a violation of that level could well trigger additional selling. Momentum and relative strength have also shown continued weakness, and both registered “sell signals” on Friday.
As we stated last week:
“While we have become increasingly cautious over the last few weeks, as the market continues to rise, we have suggested taking profits and rebalancing portfolio risks. If you have not done so, such remains a recommended course of action. However, this does not mean to reduce equity allocations aggressively.”
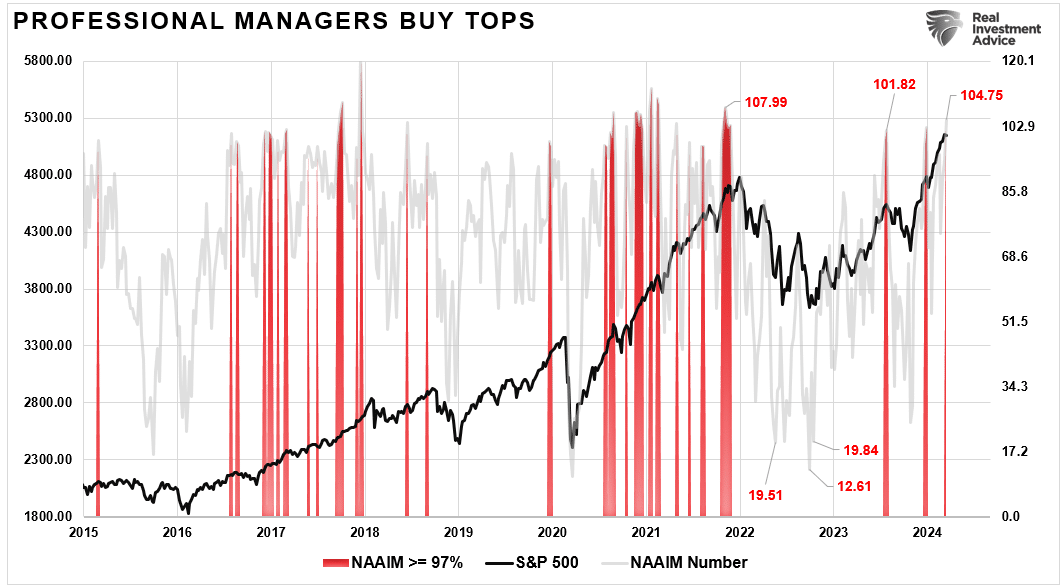
That recommendation remains again this week. While we have done some “trimming” to portfolios over recent weeks, we have not aggressively reduced risk. However, if the market does show evidence of a corrective phase, we will become more attentive to risk management. While we are never sure about the timing of market corrections, that is a part of the normal market cycle. With bullish exuberance getting a bit extreme, something will likely catalyze a reversal of sentiment. As shown, professional managers are notorious for buying the tops of markets. The red highlights are when professional manager’s allocations exceed 97%.

The Week Ahead
Wednesday’s Fed FOMC meeting will be this week’s key event. Investors will seek signals on when the Fed may consider cutting rates. More likely, they will announce that they are reducing the monthly amounts of QT or set a timetable to do so. The quarterly economic projections will also help guide us. Assessing changes versus those from last December can clue us into their thoughts on inflation, unemployment, and, most importantly, the Fed Funds rate. Jerome Powell will shed additional light on monetary policy during his press conference following the release of the minutes.
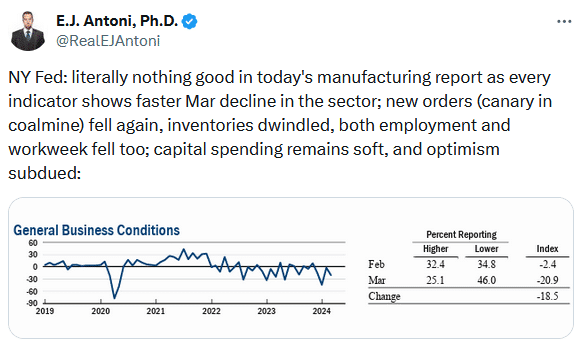
The economic calendar will be relatively light this week. Housing starts and permits will help us ascertain if the recent increase in interest rates is affecting homebuilder plans. After Friday’s weak New York Fed manufacturing survey, investors will focus on the Philadelphia Fed survey to see if they report a similar decline in employment, prices, and overall sentiment as the New York Fed.
Equal vs. Cap Weighted S&P Hints At Better Days For RSP
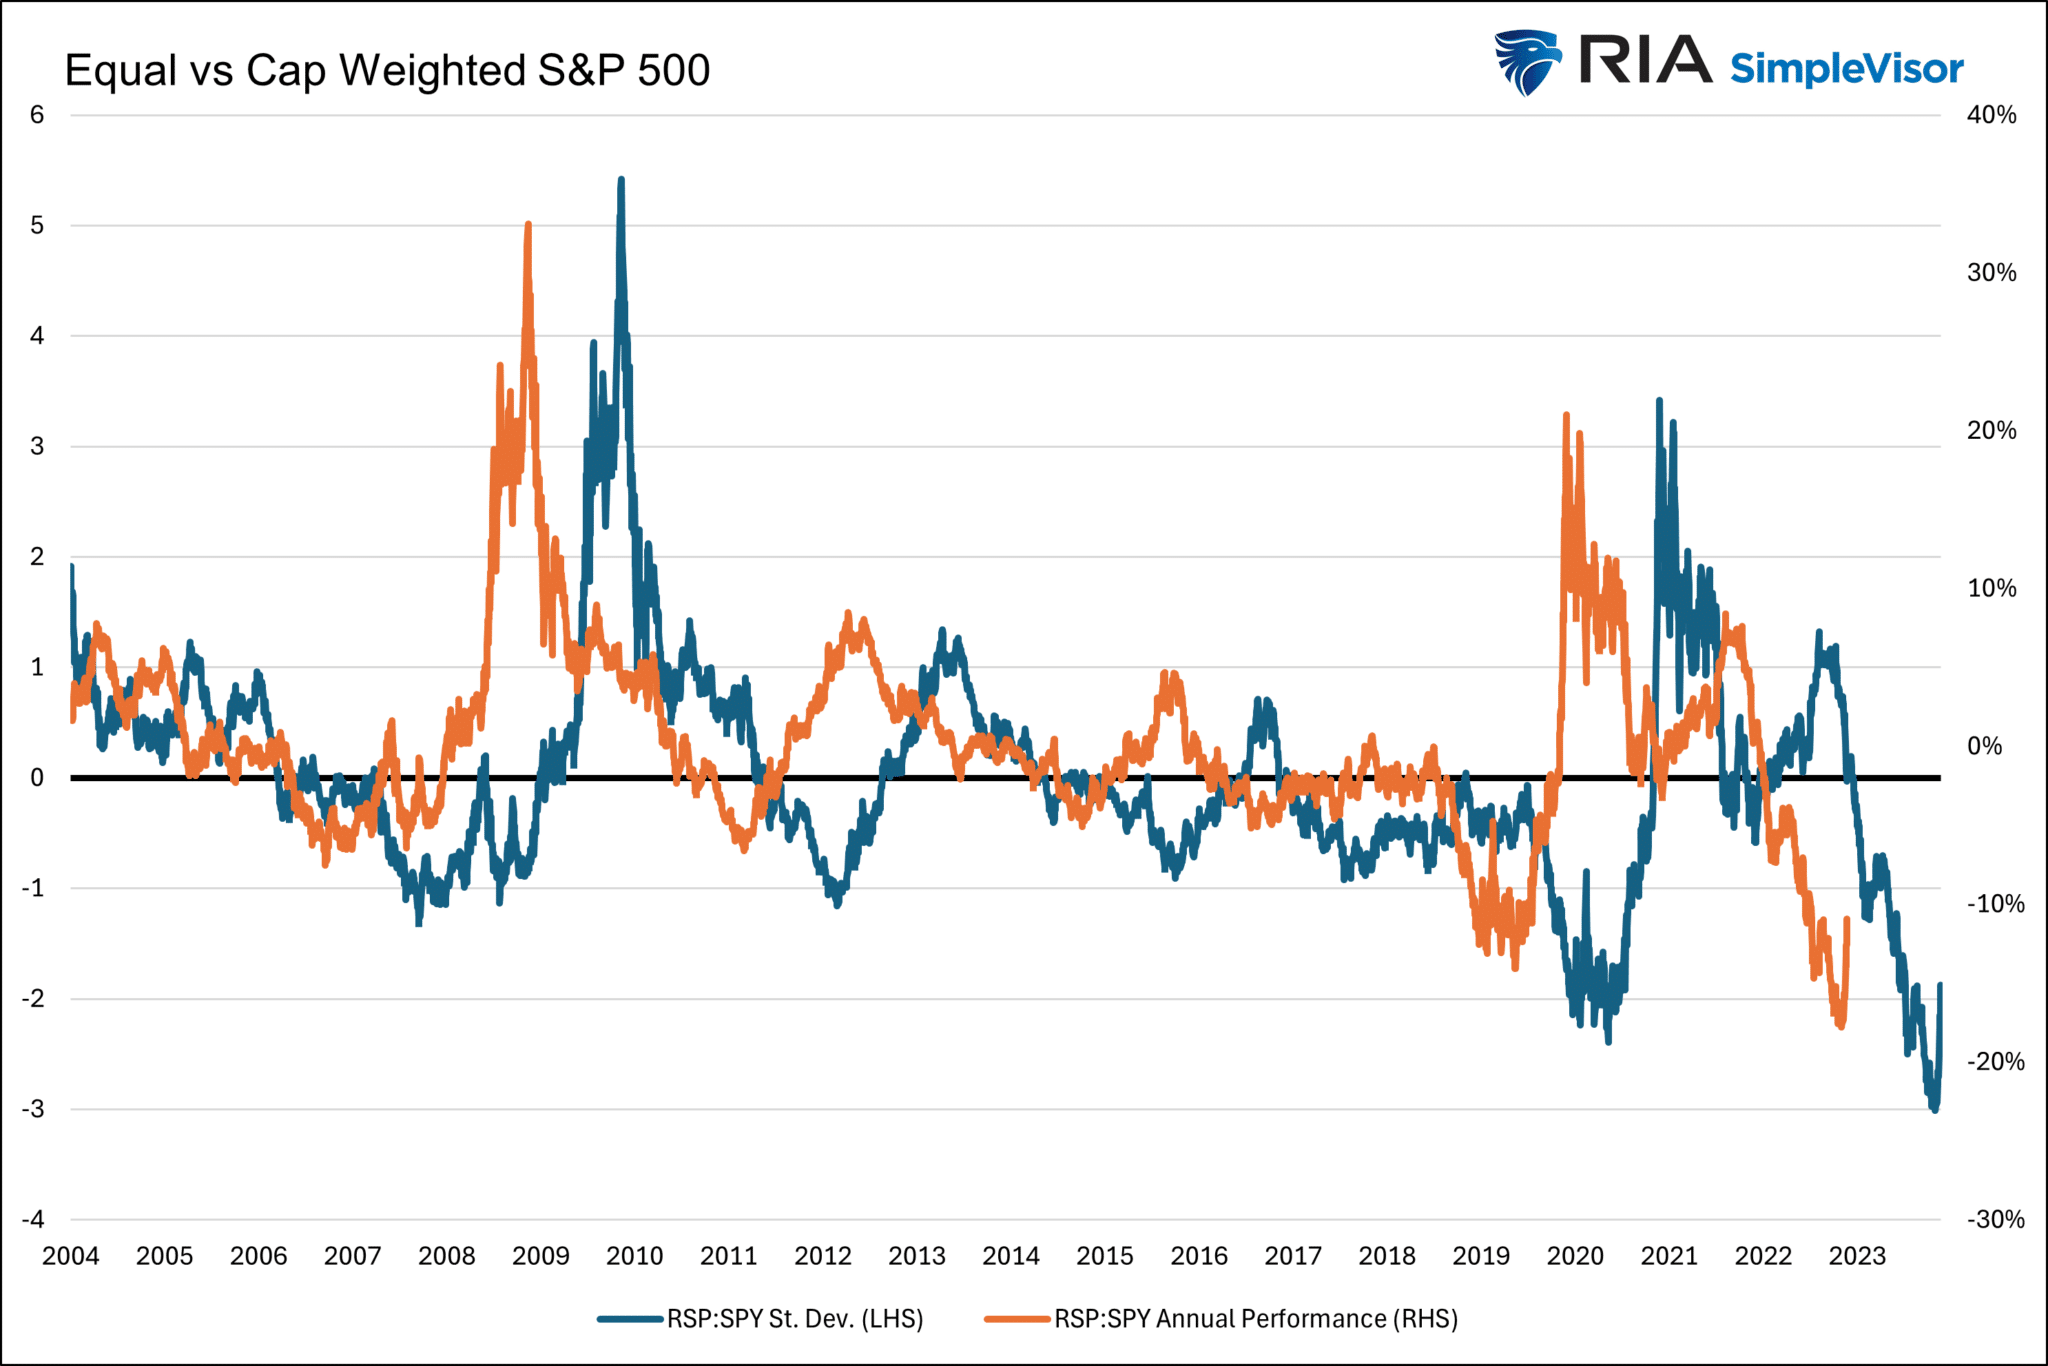
Over the past year, the market-cap-weighted S&P 500 (SPY) has beaten the equal-weighted index (RSP) by 11%. At the end of February, the outperformance reached 18%. The blue line below graphs the one-year over/underperformance of RSP versus SPY in standard deviations. The recent underperformance of RSP vs. SPY reached three standard deviations. The orange line represents the forward one-year return at each point.
If the relative underperformance troughed a few weeks ago and if the relationship normalizes, RSP should decently outperform SPY. However, that doesn’t mean RSP will rise. If the market declines, the normalization may result in the SPY leading the way lower while the RSP is still down but less than SPY. This graph, however, signals decent odds of RSP outperforming SPY over the next year.
Tweet of the Day
“Want to have better long-term success in managing your portfolio? Here are our 15-trading rules for managing market risks.”
Please subscribe to the daily commentary to receive these updates every morning before the opening bell.
If you found this blog useful, please send it to someone else, share it on social media, or contact us to set up a meeting.
Post Views: 4
2024/03/18