


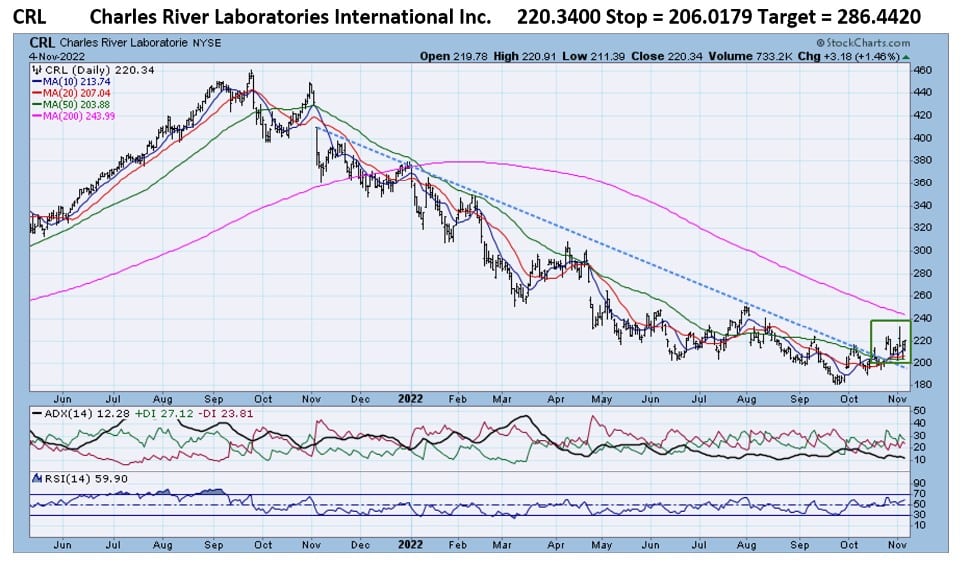
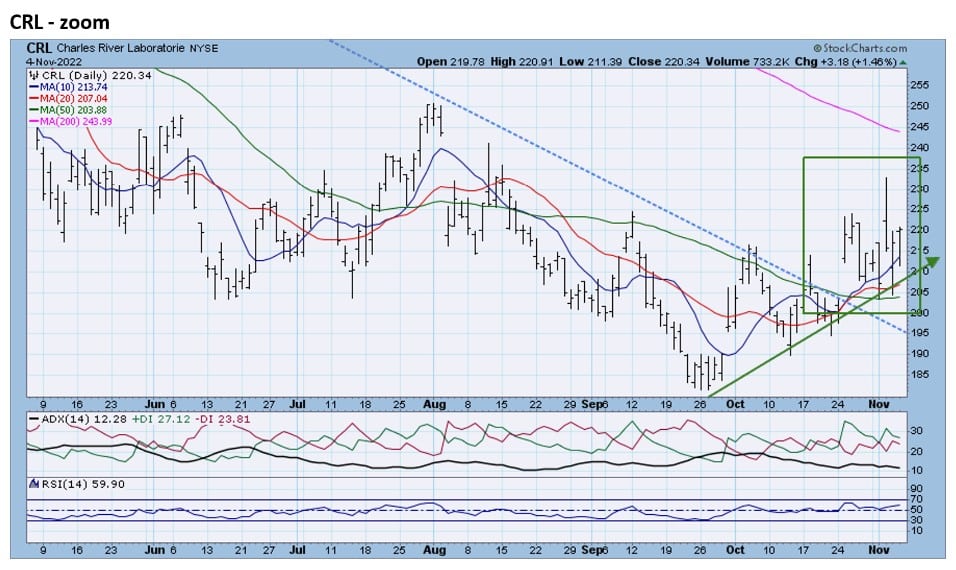
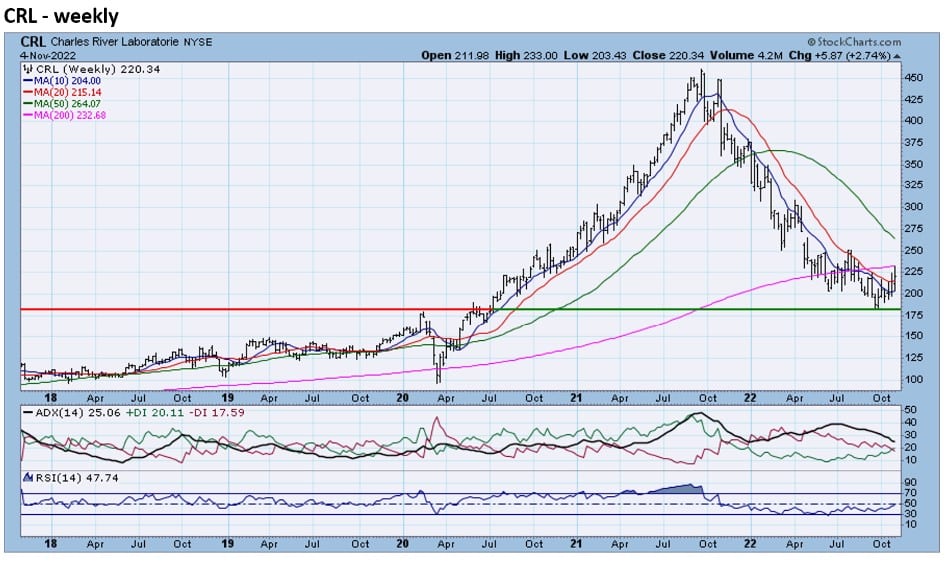
- CRL rose above its steep 12-month downtrend after falling 60% from September 2021 to September 2022. The zoom chart reveals that CRL has established a pattern of higher lows since its nadir at the end of September. The weekly chart shows that CRL left long-term support at 175-179 unviolated as it bounced from its 12-month lows.
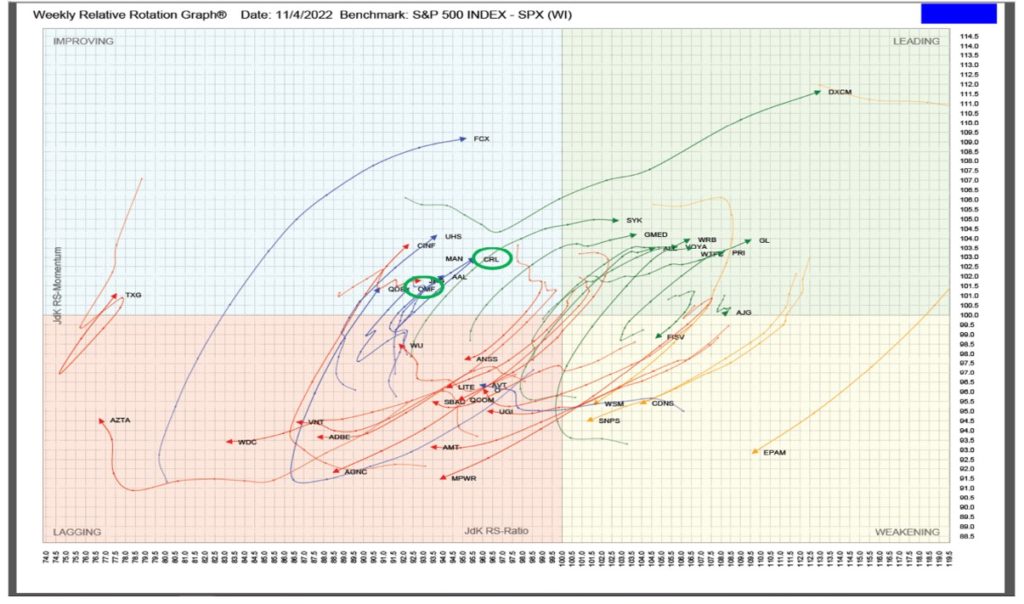
RRG analysis shows that CRL has moved out of the Lagging quadrant, into the Improving quadrant and is headed for the Leading quadrant. CRL was one of the Top 20 in this week’s TPA-RRG report. (See the RRG below).
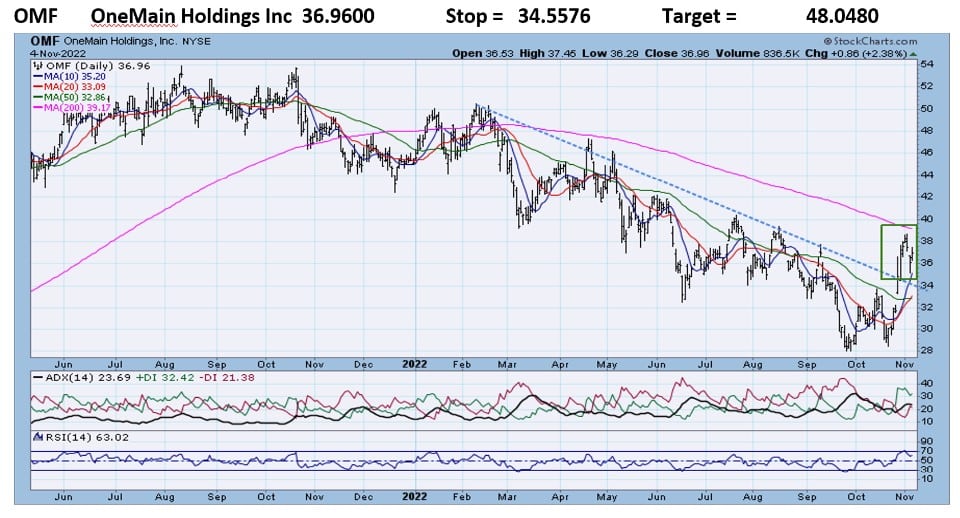
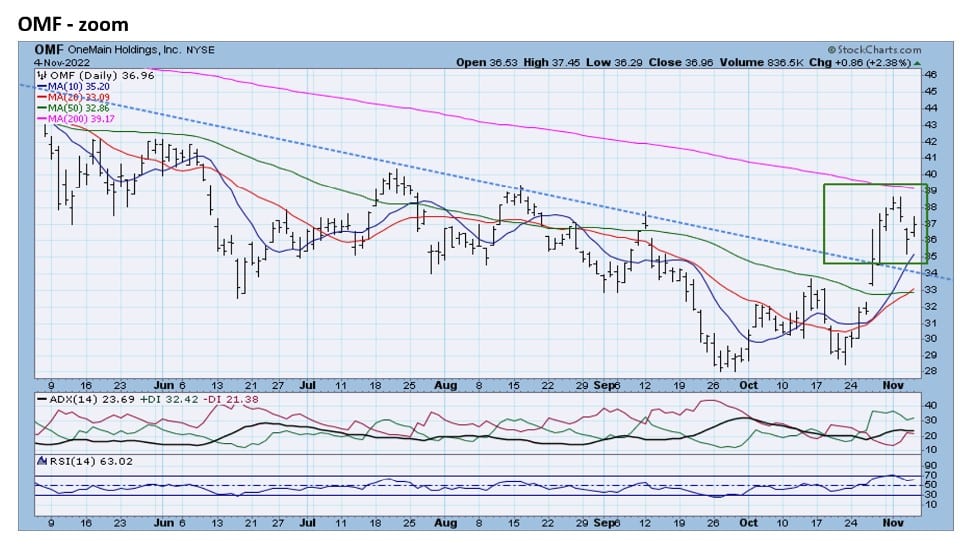
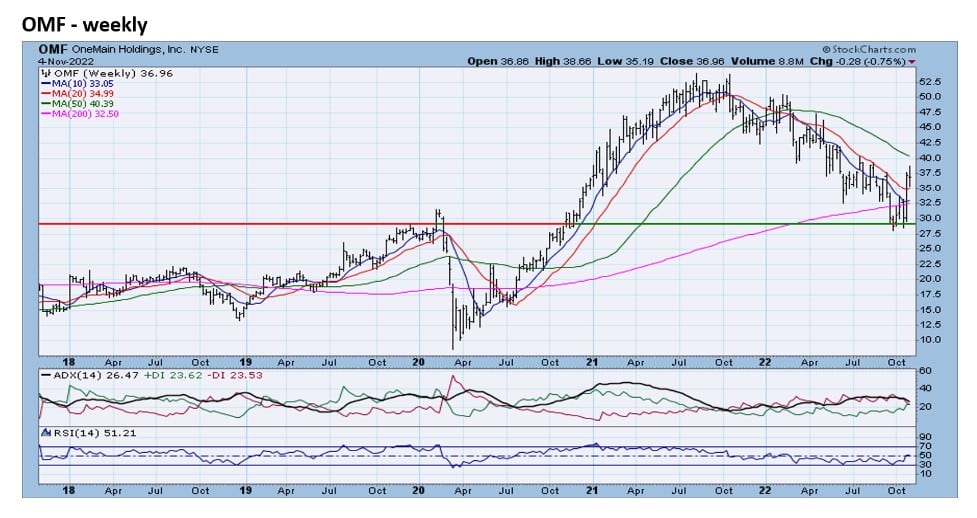
- OMF vaulted above its 8-month downtrend line at the end of October. See charts 1 and 2. The weekly chart shows that the lows of October and November match up to long-term support.
RRG analysis shows that OMF has moved out of the Lagging quadrant, into the Improving quadrant and is headed for the Leading quadrant. OMF was one of the Top 20 in this week’s TPA-RRG report. (See the RRG below).
Relative Rotation Graphs (RRG) – explanation video


Jeff Marcus founded Turning Point Analytics (TPA) in 2009 after 25 years on trading desks and 13 years as a head trader to provide strategic and technical research to institutional clients. Turning Point Analytics (TPA) provides a unique strategy that works as an overlay to clients’ good fundamental analysis. After 10 years of serving only large institutions, TPA now offers its research services to mid and small managers, RIA’s, and wealthy sophisticated individuals looking for a way to increase their returns and outperform their peers.
Subscribe 2 Week Trial
Customer Relationship Summary (Form CRS)