


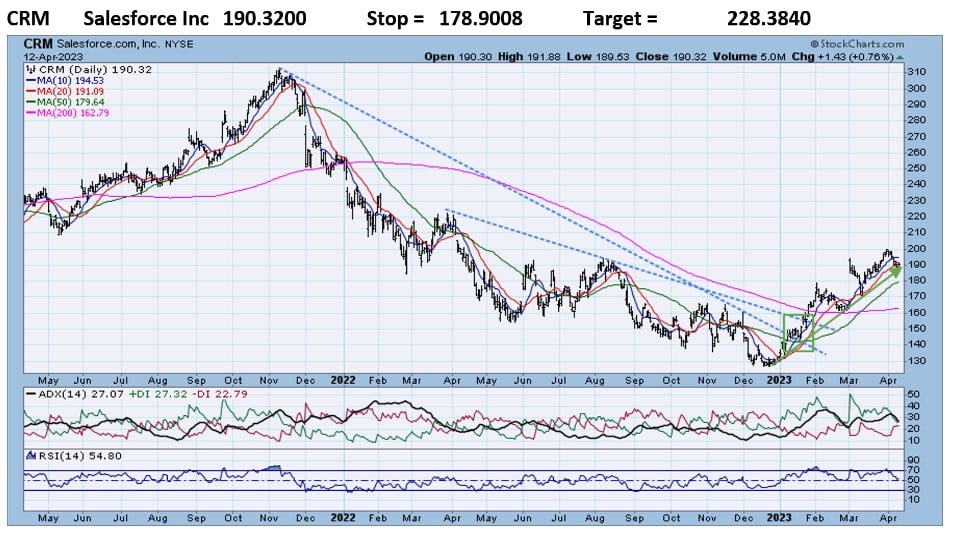
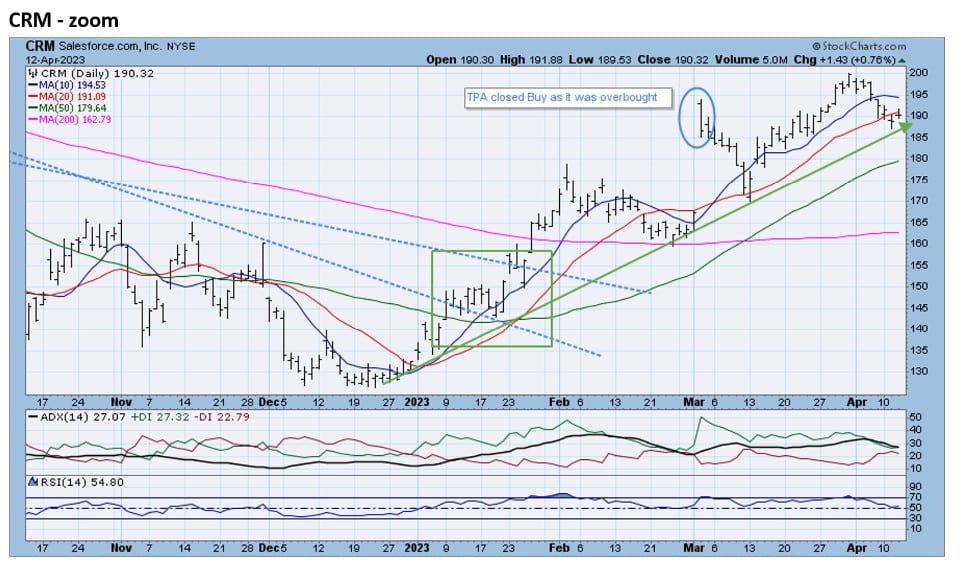
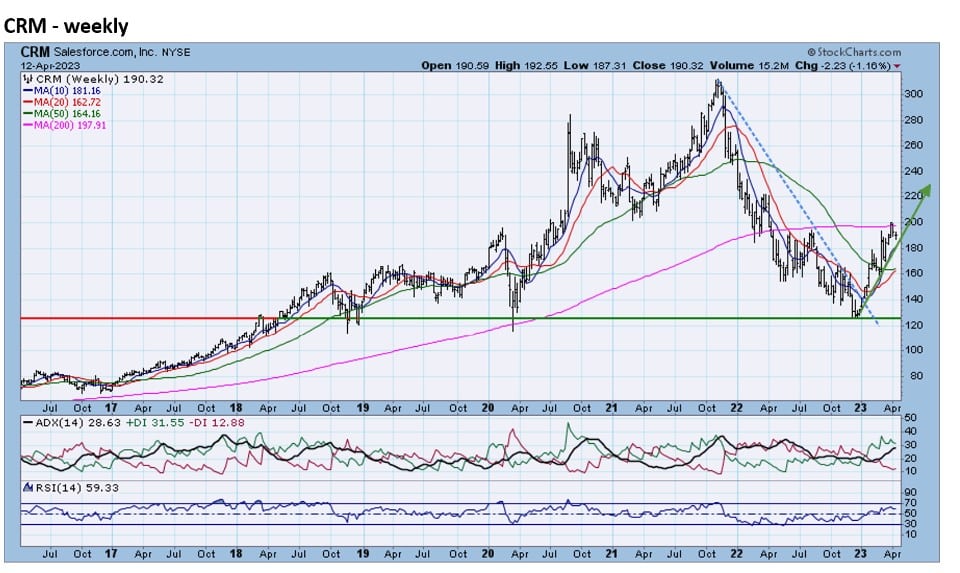
- CRM rose above the 14-month and 10-month downtrend lines in January 2023. CRM had fallen over 55% from the heights of November 2021 to the lows of December 2022. CRM has established a clear pattern of higher lows and higher highs = uptrend. TPA had a Buy Rec on 3/1/23, which was closed out +14% because it was overbought. The recent 7-day 5% decline puts CRM back at its 2023 uptrend line and the RSI is now only 54. The weekly chart shows that the inflection point in December confirms CRM’s long-term support level at 125.
RRG analysis shows that CRM ranks #47 out of the Russell 1000; with a score of +3.19.
Relative Rotation Graphs (RRG) – explanation video

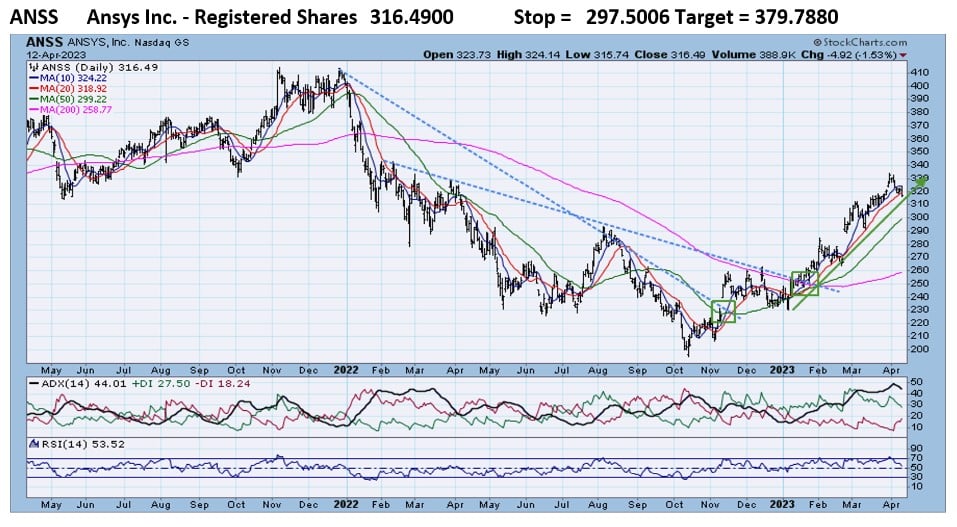
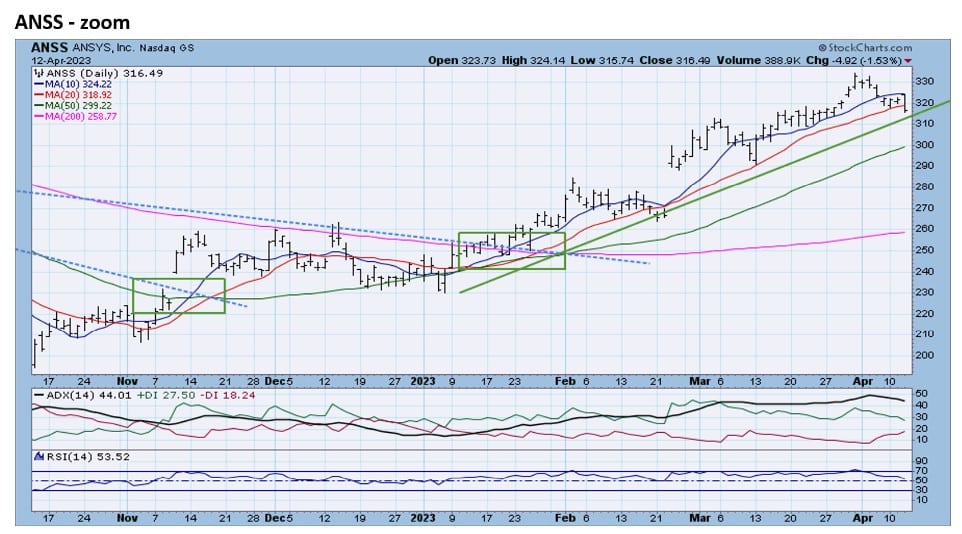
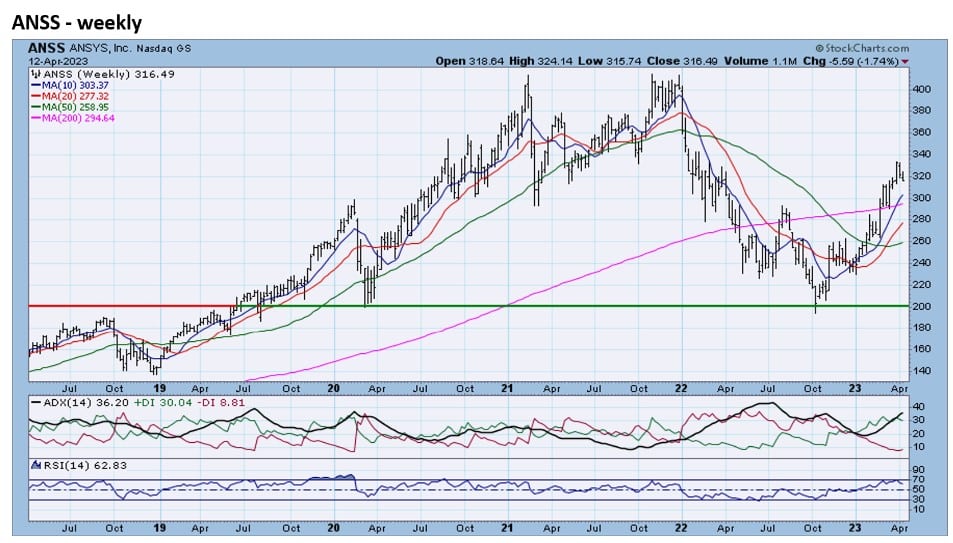
- ANSS rose above its steep 2022 downtrend in January 2023. ANSS had declined over 50% from the highs of December 2021 to the lows of October 2022. The zoom chart shows that ANSS has recently declined back to support from its new uptrend support. The weekly chart shows that the inflection point in October confirms long-term support.
RRG analysis shows that ANSS ranks #88 out of the Russell 1000; with a score of score of+3.11.


Jeff Marcus founded Turning Point Analytics (TPA) in 2009 after 25 years on trading desks and 13 years as a head trader to provide strategic and technical research to institutional clients. Turning Point Analytics (TPA) provides a unique strategy that works as an overlay to clients’ good fundamental analysis. After 10 years of serving only large institutions, TPA now offers its research services to mid and small managers, RIA’s, and wealthy sophisticated individuals looking for a way to increase their returns and outperform their peers.
Subscribe 2 Week Trial
Customer Relationship Summary (Form CRS)