


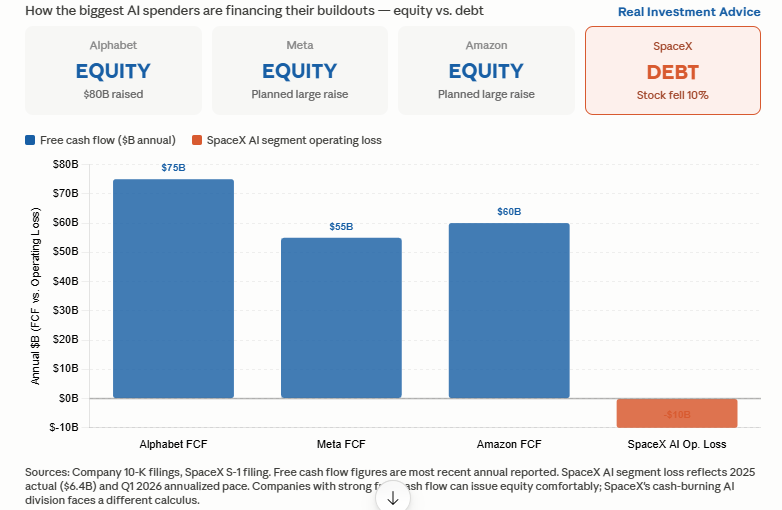
Three weeks ago, we wrote A Supply Tsunami Is Coming. The article discussed why the world’s largest technology companies are choosing equity versus debt to fund their AI infrastructure buildouts. Simply, at 5% interest rates, issuing stock carries no interest expense, no refinancing risk, and no margin pressure. Alphabet raised $80 billion in equity. Meta and Amazon are planning similarly large offerings. SpaceX (SPCX), which just conducted its record-sized IPO, just did the opposite.
Late last week, SPCX fell more than 10% after announcing plans to issue debt to finance its AI development. Given the strong demand for its IPO, if there ever was a moment to issue equity, it is now, with investor enthusiasm running hot and a minimal 5% float keeping SPCX equity supply scarce.
So why did SPCX choose debt over equity? We think there are three possibilities:
- Valuation discipline: If SPCX management believes the stock is cheap, then issuing equity means selling ownership at a price they consider too low. Debt is currently expensive but has a finite life, while equity dilution at the wrong price is permanent.
- Float management: SPCX’s 5% public float is keeping the stock elevated. Issuing new equity grows the float, potentially lowering the price, which would not bode well for its original investors waiting for their sale lockout periods to end.
- Cash burn: Could the xAI cash burn be accelerating faster than the IPO proceeds can cover? Cash on hand fell from $24.75 billion to $15.85 billion in the last quarter. If that trajectory continues, debt issuance may be less a strategic choice and more a financial necessity.
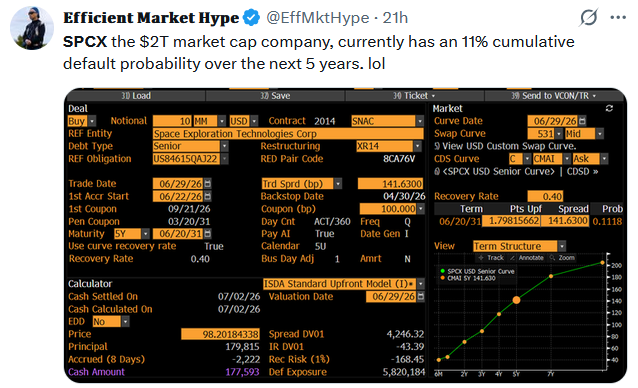
SPCX’s AI segment posted a $6.4 billion operating loss in 2025, with losses accelerating in 2026. Equity issuance makes sense for companies with strong balance sheets and significant positive cash flows. SPCX is certainly not in that camp. Today’s Tweet of the Day shows the markets are aware of SPCX risks.
What To Watch Today
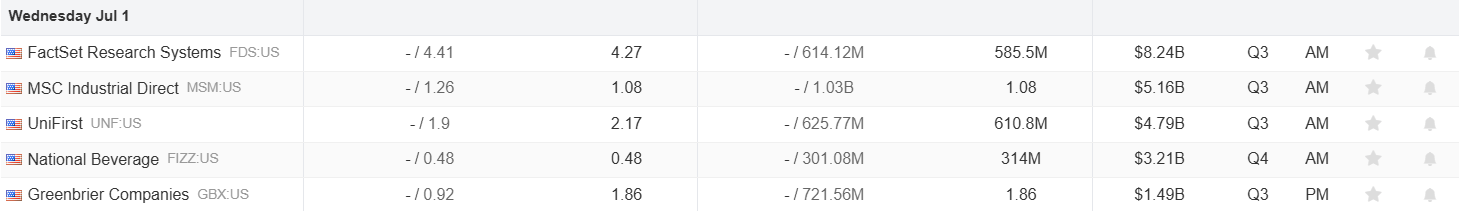
Earnings
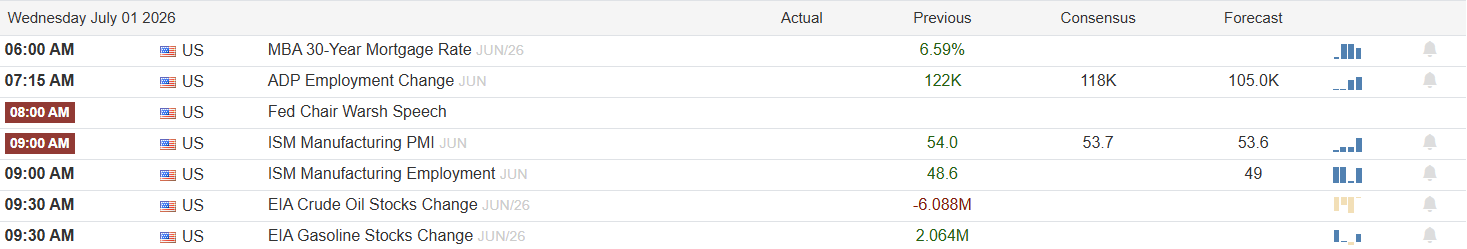
Economy
Market Trading Update
Yesterday, we discussed the recent rotation we made from value to growth. Q3 earnings season begins today and will kick off in earnest next week.
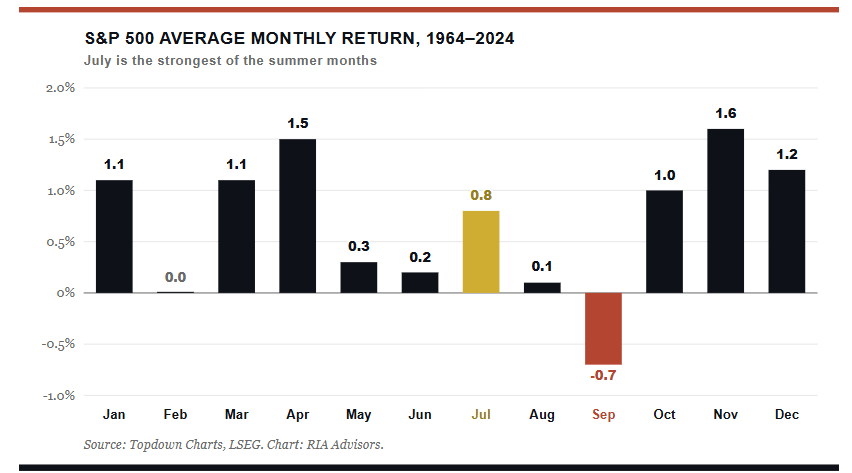
Q3 opens with the calendar on its side. Since 1964, July has averaged a 0.8% gain for the S&P 500, the strongest return of the four summer months, and a clear step up from June, August, and a historically negative September. As the chart below shows, the seasonal lean is real but not overwhelming, with a 54% hit rate that supports participation over conviction.
The setup matters more this year because June faded into quarter-end, when pension funds and balanced strategies sell equities to rebalance back toward bonds. That selling pressure typically clears once the new quarter opens. The money that was left in late June often finds its way back over the first two weeks of July, and with prices already firm, that mechanical reversal could supply the bid that carries us into mid-summer.
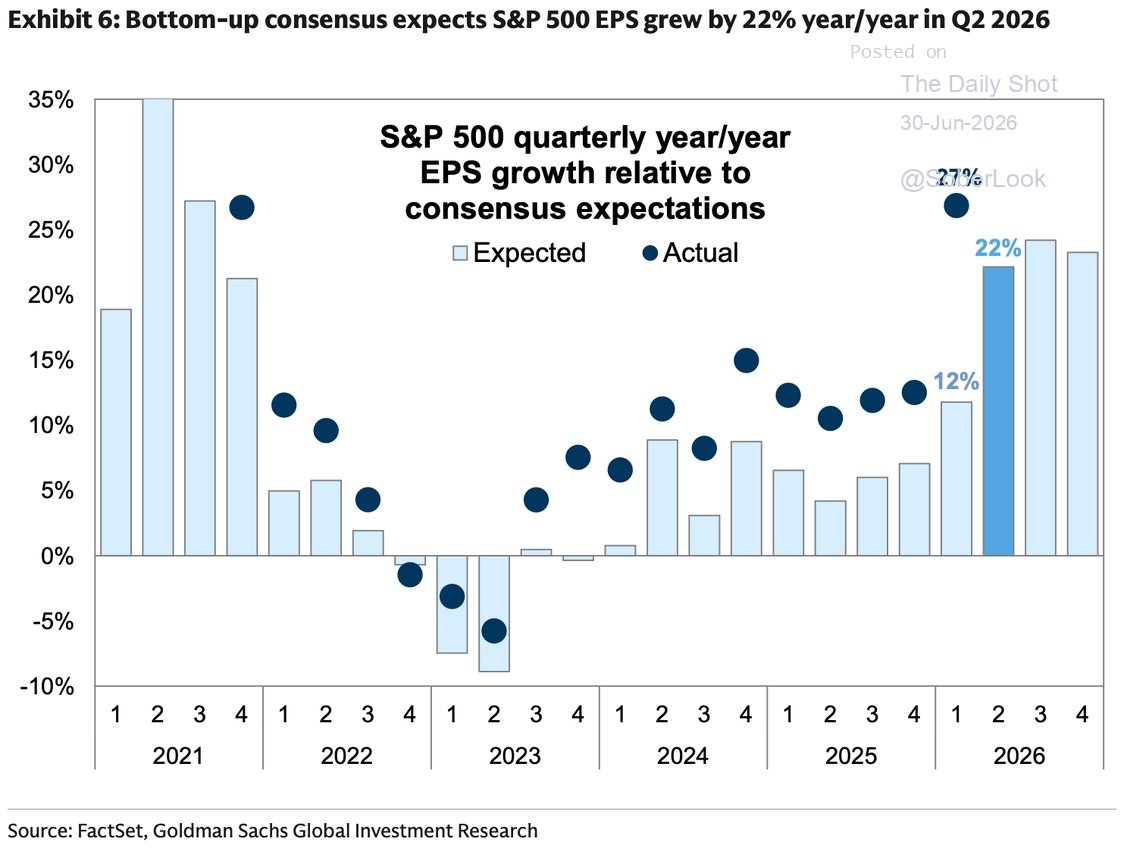
Furthermore, the earnings backdrop reinforces the optimism, at least at the index level. The Q2 reporting season, which kicks off in July, arrives with bottom-up consensus expecting S&P 500 EPS growth north of 20% year over year, climbing to 27% once you strip out Financials and Utilities. That is a strong number.
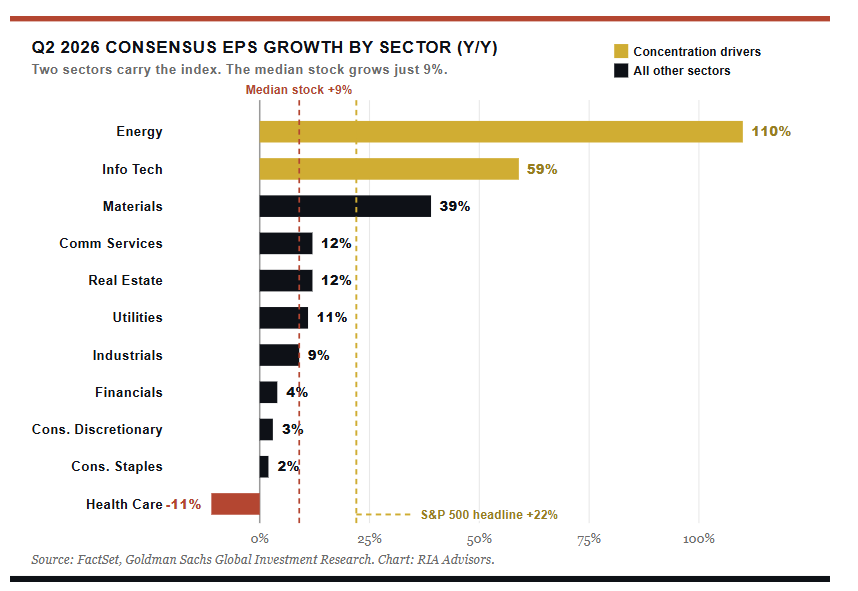
The problem is where it comes from. As the second chart makes plain, Energy carries a 110% growth estimate off depressed year-ago comparisons, and Information Technology another 59% on the back of the AI capital spending cycle. Outside those two engines, the picture thins fast. The median stock is expected to grow earnings just 9%, a yawning gap beneath the 22% headline. Bob Farrell’s Rule #7 warned that markets are strongest when broad and weakest when they narrow to a handful of names. A quarter where the average company grows at less than half the index rate is the definition of narrow leadership.
This is where the flow data deserves a hard look. Global fund flows into US equities are running near 2.4% of assets year to date, riding the top of the historical range and far above a long-run average that sits flat to slightly negative. Flows like that are a tailwind until they are a warning. As Howard Marks reminds us, the riskiest moment arrives when everyone is convinced there is no risk. Demand this strong this early in the year tends to pull future buying forward, leaving less dry powder to chase prices in the back half.
For the model portfolios, we are staying constructive but not complacent. The seasonal tailwind and the rebalancing reversal argue for letting current allocations work into July. The earnings concentration and the stretched flow picture argue against adding aggressively here. We laid out this discipline in “Adding Mag7 Into The Selloff,” and the logic holds. Take what the market gives over the next few weeks, respect the narrowing breadth, and keep the exit rules in place.

Credit Card Delinquencies Rise
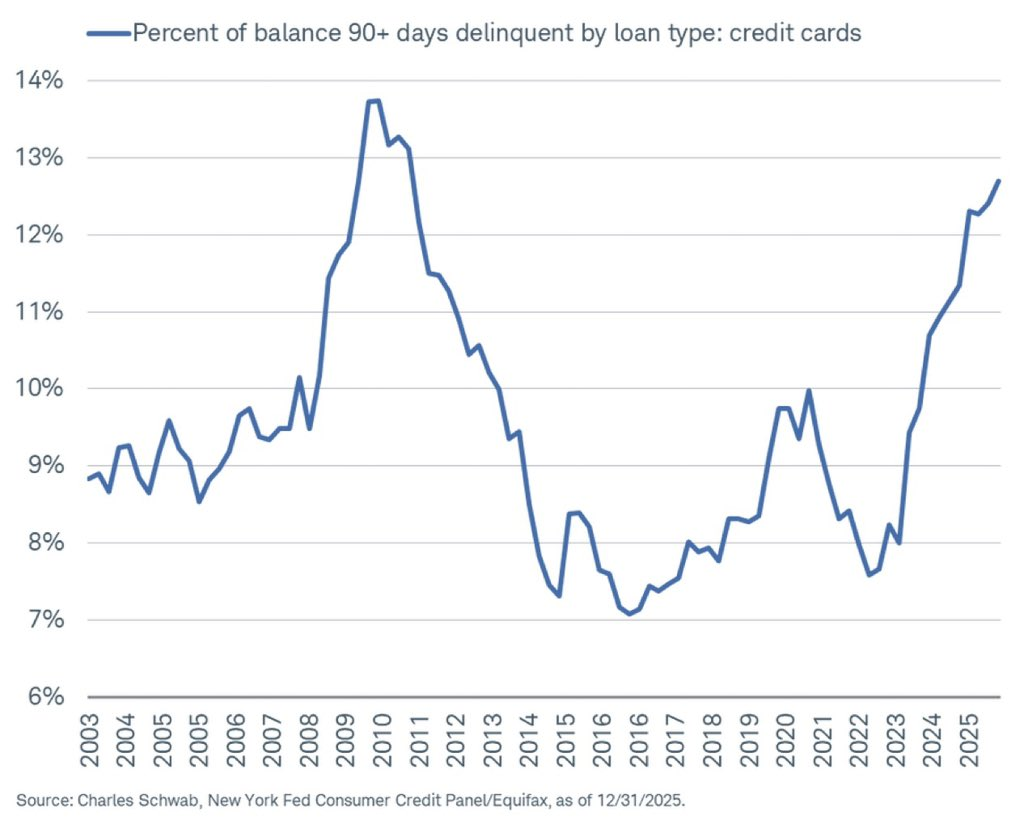
Consumers are becoming delinquent on credit card payments at a rate not seen since the aftermath of the 2008 financial crisis. 13.12% of credit card balances are now 90 or more days delinquent, up sharply from 8% just one year earlier. Total credit card debt stands at $1.25 trillion. Consumer financial stress is not isolated. Auto loan delinquencies recently hit a record, and student loan delinquencies reached their worst level since the pandemic payment pause ended.
While the data is concerning, context matters. Credit cards account for only about 7% of total household debt, far less than mortgages. Moreover, the percentage of all household debt 90 days delinquent is 3.4%, in line with pre-pandemic norms. Household debt service as a share of disposable income remains below pre-pandemic levels, and liquid net worth is near a three-decade high.
The takeaway is two-tiered. A relatively small but growing group of already-struggling consumers is sinking deeper into delinquency, while roughly half of all cardholders pay their balances in full every month and avoid the problem entirely. This is not a consumer collapse, but most likely a continued widening gap between households managing fine and a subset falling behind.

Tweet of the Day
New UPDATED Trading Rules With Desktop Printout
“Want to achieve better long-term success in managing your portfolio? Here are our 15-trading rules for managing market risks.”
Please subscribe to the daily commentary to receive these updates every morning before the opening bell.
If you found this blog useful, please send it to someone else, share it on social media, or contact us to set up a meeting.