


Click on either image below for the entire TPA-RRG Report!
Find more in-depth explanations and links to instructional videos.
THE REPORT
TPA-RRG Weekly Commentary
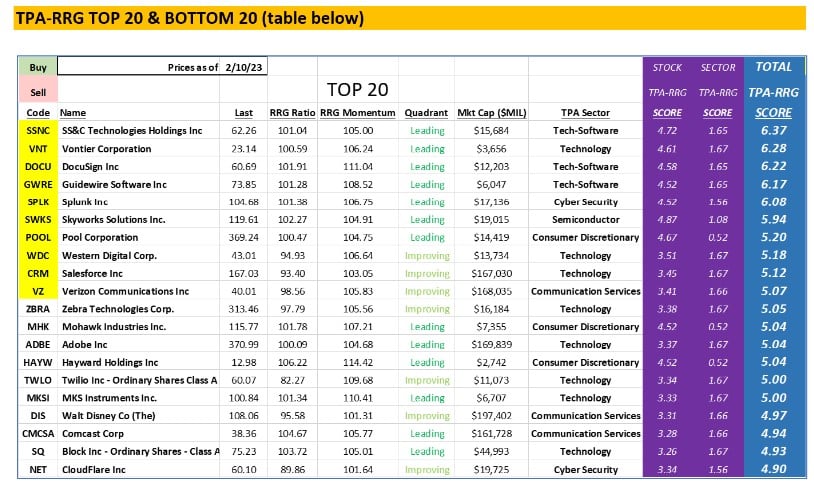
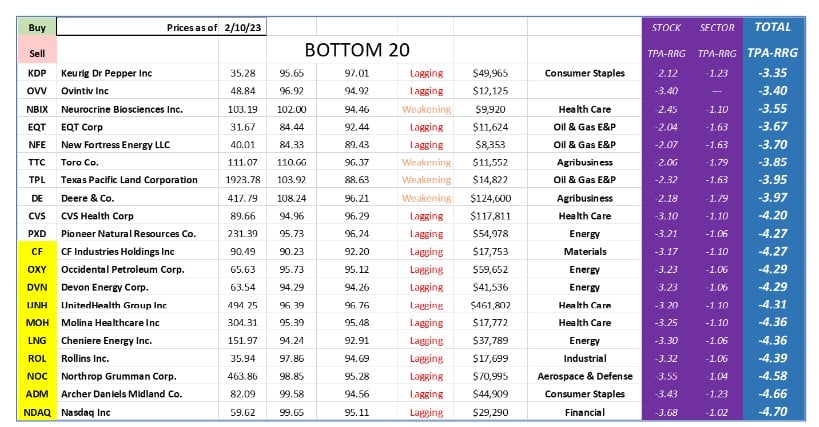
Top 20-Bottom 20
The Top 20 and Bottom 20 constituents are mostly as it was on 2/3/23; the top stocks are mostly TECH and Communications, while the Bottom stocks are Energy, Commodity, and a smattering of Health Care. Although TECH was weak last week, the general pattern toward a changing of the guard seems to be in place.
Sectors
Sector ranking remains mostly as it did last week. An area for concern can be seen in the highlighted section of the Sector RRG below as TECH (XLK) and SEMI (SMH) have lost momentum. This brings them off course, but our guess is that they will return to their trajectory of the past weeks soon.
Sector RRG – zoom
Market
The market, as a whole, treaded water last week, with TECH breaking from the plan and putting in the worst performance (table below). Still, the S&P500 remains over 4000, which means its recent breakout is intact (chart below)


Jeff Marcus founded Turning Point Analytics (TPA) in 2009 after 25 years on trading desks and 13 years as a head trader to provide strategic and technical research to institutional clients. Turning Point Analytics (TPA) provides a unique strategy that works as an overlay to clients’ good fundamental analysis. After 10 years of serving only large institutions, TPA now offers its research services to mid and small managers, RIA’s, and wealthy sophisticated individuals looking for a way to increase their returns and outperform their peers.
Subscribe 2 Week Trial
Customer Relationship Summary (Form CRS)