


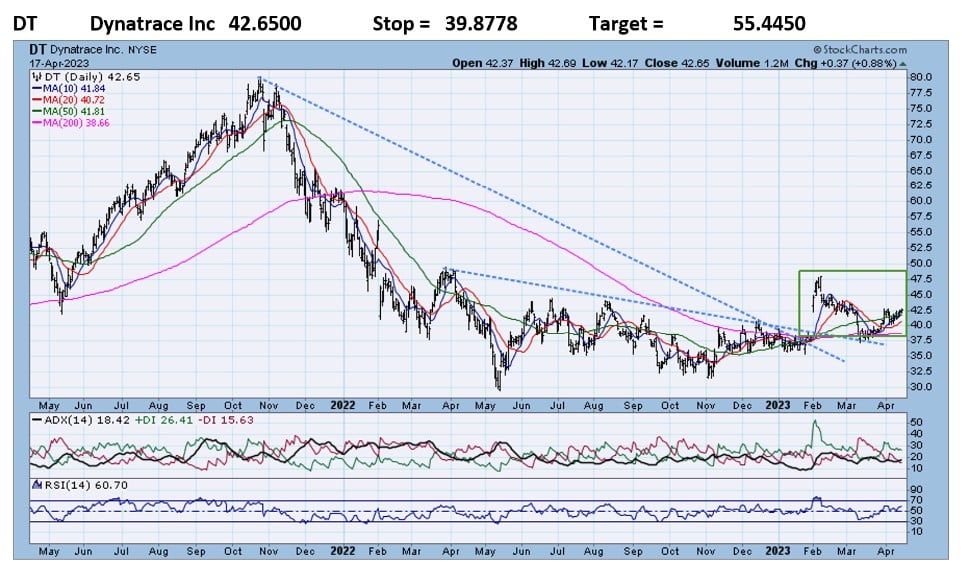
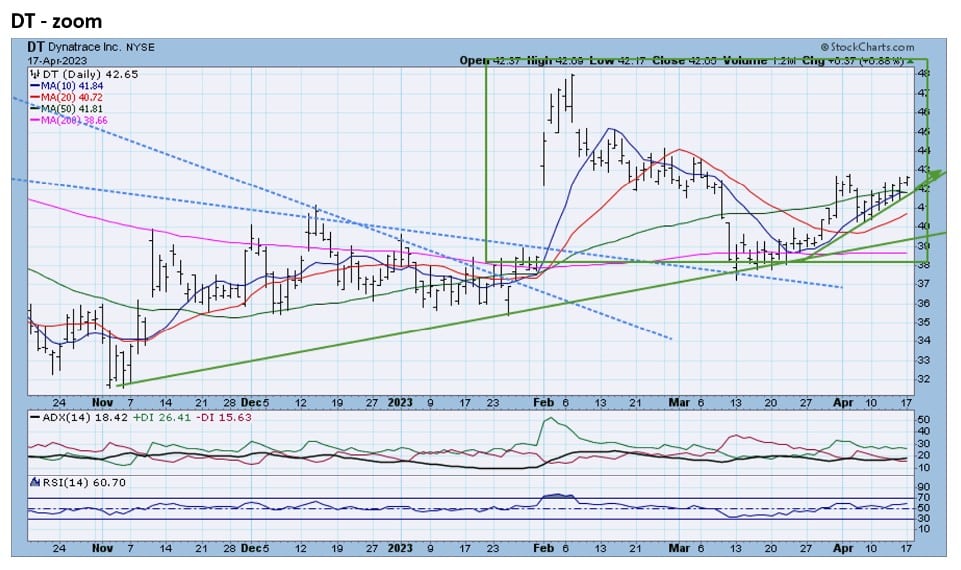
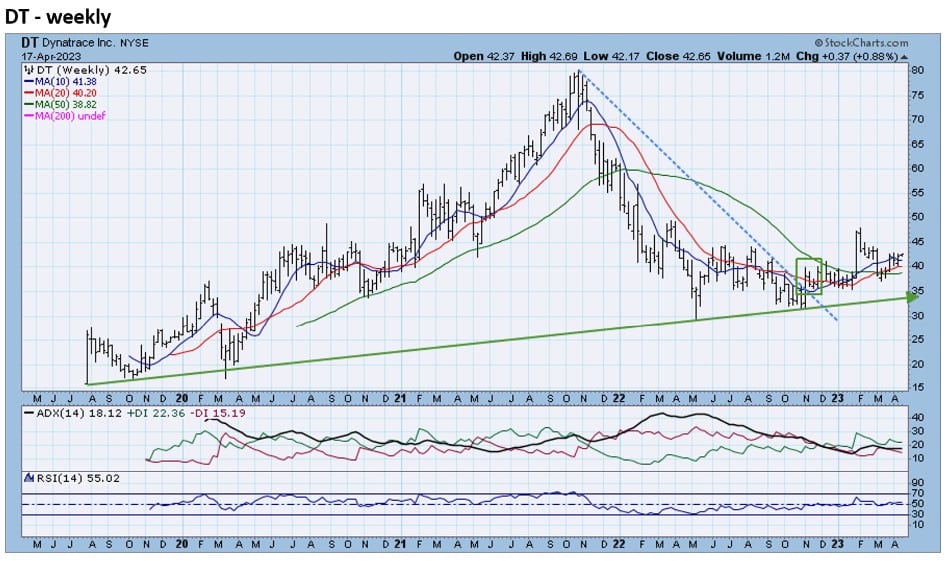
- DT rose above its 14-month and 10-month downtrend lines in January and February, respectively. DT had fallen over 60% from the October 2021 highs to the May 2022 lows. It was a slow climb out of the dregs of 2022, but the gap-up day in early February was a warning sign for any shorts that think this is a safe place to hide. DT fell 20% in a month, but has now established a pattern of higher lows and higher highs = uptrend. The momentum of DT should carry it finally above the highs of March 2022 and February 2023 or approximately the 49 level. The weekly chart shows that DT has maintained its long-term uptrend.
RRG analysis shows that DT is ranked #5 out of the Russell 1000 in this week’s TPA-RRG report.
Relative Rotation Graphs (RRG) – explanation video


Jeff Marcus founded Turning Point Analytics (TPA) in 2009 after 25 years on trading desks and 13 years as a head trader to provide strategic and technical research to institutional clients. Turning Point Analytics (TPA) provides a unique strategy that works as an overlay to clients’ good fundamental analysis. After 10 years of serving only large institutions, TPA now offers its research services to mid and small managers, RIA’s, and wealthy sophisticated individuals looking for a way to increase their returns and outperform their peers.
Subscribe 2 Week Trial
Customer Relationship Summary (Form CRS)