


In our Commentary 2023 Challenge: Contradiction, we discussed Lance’s recent article, The Technicals Vs. The Fundamentals. Specifically, the two pieces aim to raise awareness that technical studies are a reason for bullishness, while fundamentals tend to argue a bearish case. As if the divergence between technicals and fundamentals was not enough to grapple with, there is a lot of confusion and divergence of economic data. A week ago, the unemployment rate hit a 53-year low. However, many leading economic indicators point to high odds of a recession.
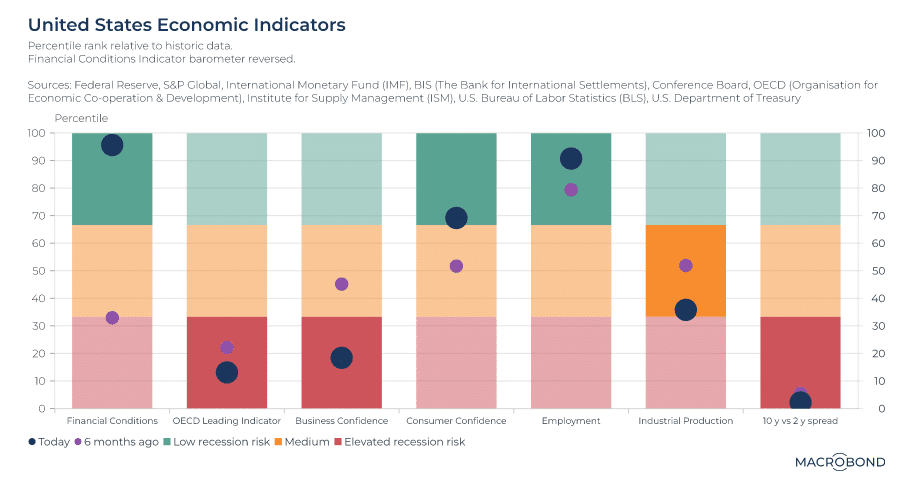
The MacroBond graph below highlights the prevailing economic confusion.
Financial conditions are extremely easy, and consumer confidence is robust, and, as we noted earlier, the labor market is among the strongest in recent history. At the same time, three critical leading indicators, OECD, business confidence, and the 2/10yr UST yield curve, point to elevated recession risk. MacroBond helps break the economic confusion tie as follows:
Industrial production – moving from neutral to borderline red over the past six months – might be the tiebreaker.
What To Watch Today
Economy
- No notable reports are scheduled for release.
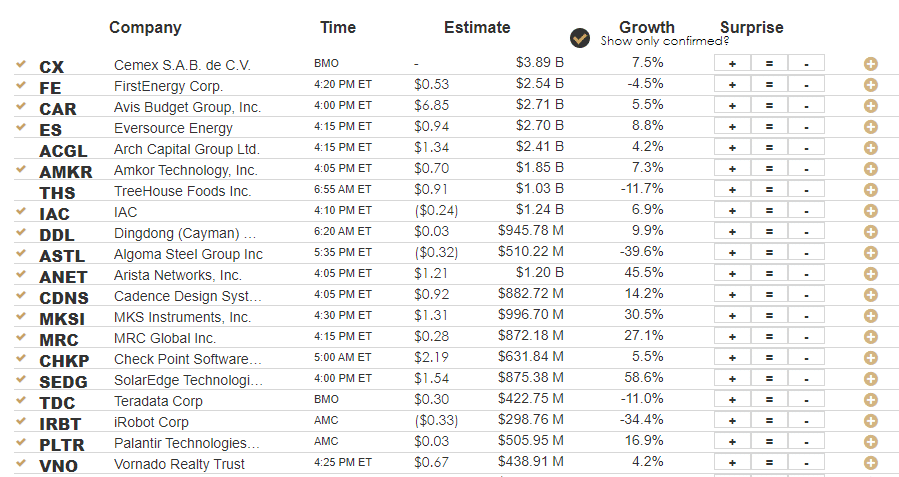
Earnings
Market Correction Has Started
In our newsletter the week before last, we discussed the bullish signals the market was giving despite the Fed’s continued hawkish stance on monetary policy.
The market surge continued last week but ran into resistance on Friday as markets are pushing well into 3-standard deviations above the 50-DMA. However, while the weakness on Friday was not unexpected, it is also necessary to determine whether the current breakout is legitimate.
If the “bear market” is “canceled,” we will know relatively soon. To confirm whether the breakout is sustainable, thereby canceling the bear market, a pullback to the previous downtrend line that holds is crucial. Such a pullback would accomplish several things, from working off the overbought conditions, turning previous resistance into support, and reloading market shorts to support a move higher. The final piece of the puzzle, if the pullback to support holds, will be a break above the highs of this past week, confirming the next leg higher. Such would put 4300-4400 as a target in place.
A break BELOW the downtrend line, and the current intersection of the 50- and 200-DMA, will suggest the breakout was indeed a “head fake.” Such will confirm the bear market remains, and a retest of last year’s lows is likely.
The commentary remains vital to this week’s analysis as our primary short-term “sell” indicator has been triggered for the first time since early December. While that sell signal does NOT mean the market is about to crash, it does suggest that over the next couple of weeks to months, the market will likely consolidate or trade lower. Such is why we reduced our equity risk last week ahead of the Fed meeting.
The previous analysis remains crucial heading into next week. There are currently multiple levels of support for the S&P 500, as shown in the chart below.
- 4045 is the downtrend line from the June and December rally peaks (dotted black line)
- 4010 is the previous 38.2% retracement level from the October lows.
- 3969 is the rising 50-DMA moving average which has now crossed above the 200-DMA (orange line)
- 3942 is the intersection of both the neckline of the inverse head-and-shoulders bottoming pattern and the 200-DMA (black line)

If the market violates all of those supports, such will suggest the “bear market” remains intact and the rally from the October lows was another “head fake.”
However, the underlying technicals remain bullish until those support levels are violated. A correction that works off the overbought condition and tests and holds support will add further support to the bullish thesis.
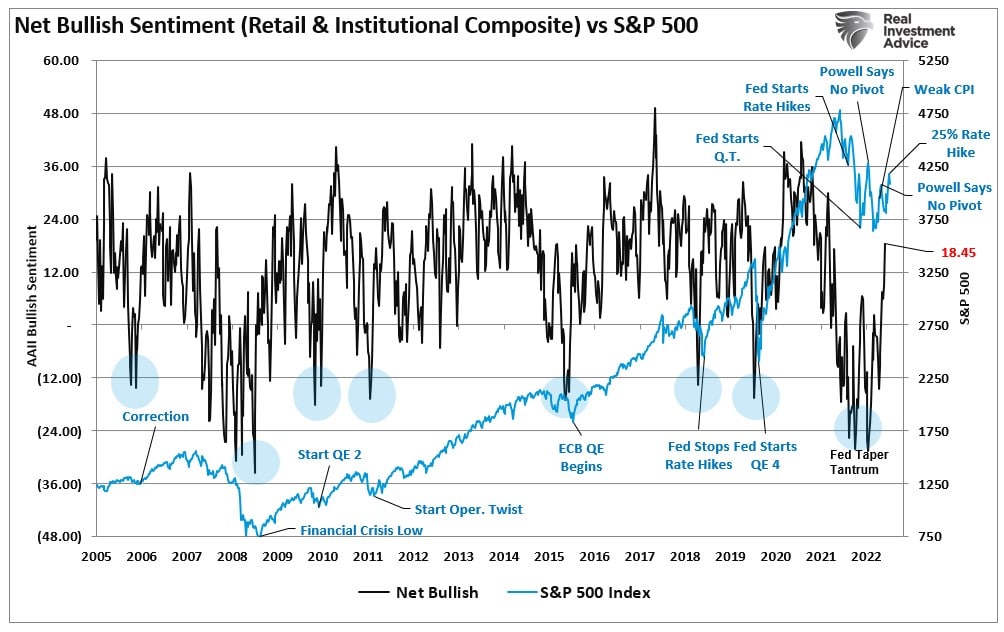
The one certainty is that since January, the market has resembled the next Fast & Furious movie title: “Too Far, Too Fast.” Furthermore, retail investor sentiment has become increasingly bullish, suggesting a near-term correction is likely.
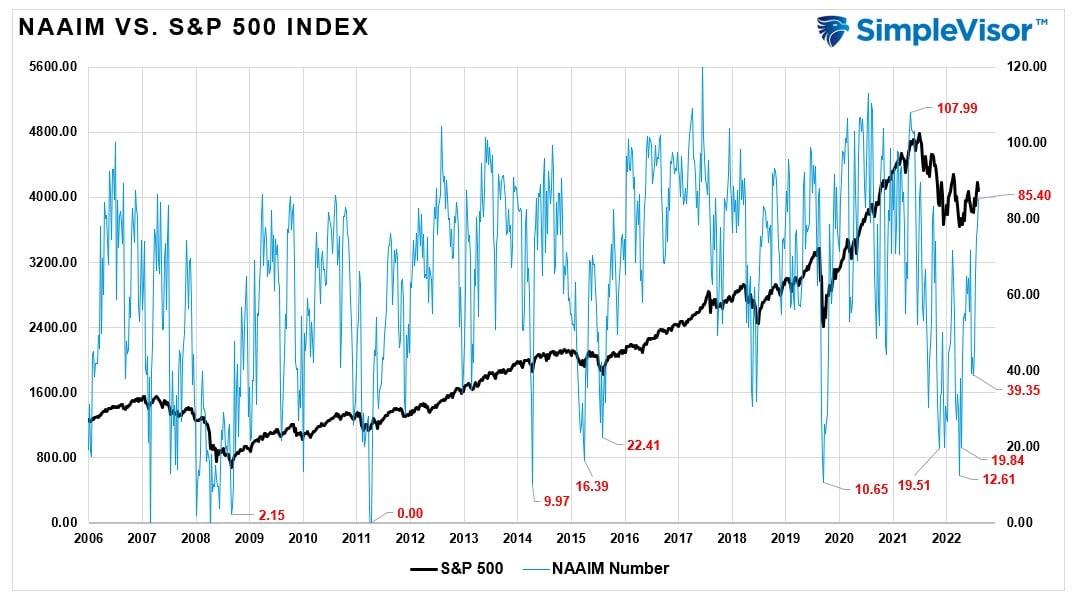
Also, professional investors have piled into the market in recent weeks, pushing exposures to more bullish levels.
In the near term, a correction is needed to work off the froth of the market and allow the bulls a chance to prove their case.
The Week Ahead
This week, three economic measures the Fed heavily relies on will be released. On Tuesday, the BLS will release CPI. The consensus expects the monthly figure to increase from +0.1% last month to +0.4%. The year-over-year rate should fall from 5.7% to 5.5%. On Friday, the BLS revised December’s monthly CPI data from -0.1% to +0.1%. Following CPI, on Wednesday will be retail sales. Given personal consumption accounts for nearly two-thirds of economic activity, investors will be on guard for signs of economic deterioration. Current expectations are for a 1.5% gain following last month’s 1.1% decline. More inflation data ensues on Thursday with PPI. Economists expect PPI to rise by 0.4%, following a 0.5% decline last month. Given the recent volatility of prices in many sectors, we may get another instance of economic confusion regarding inflation.
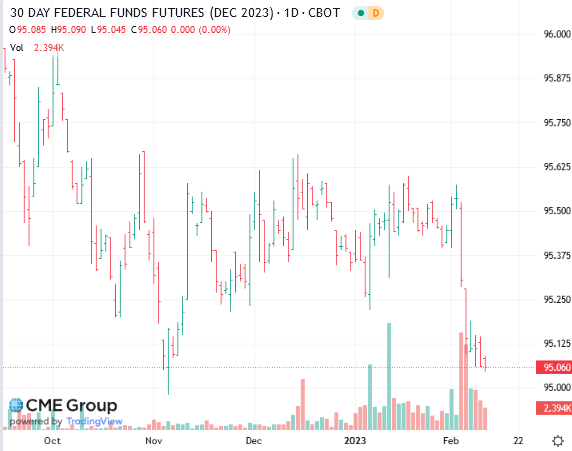
We expect the Fed to continue with its relatively hawkish rhetoric. As they did last week, they will stress the “higher for longer” outlook for Fed Funds. The bond market appears to be listening. As we show in the CME graph below, the price of the December 2023 Fed Funds contract fell approximately 50bps over the last week. The contract implies Fed Funds will end the year at 4.96% (100-95.06). It was south of 4.50% at the start of February.
The Labor Market is Hot, But its Breadth is Questionable
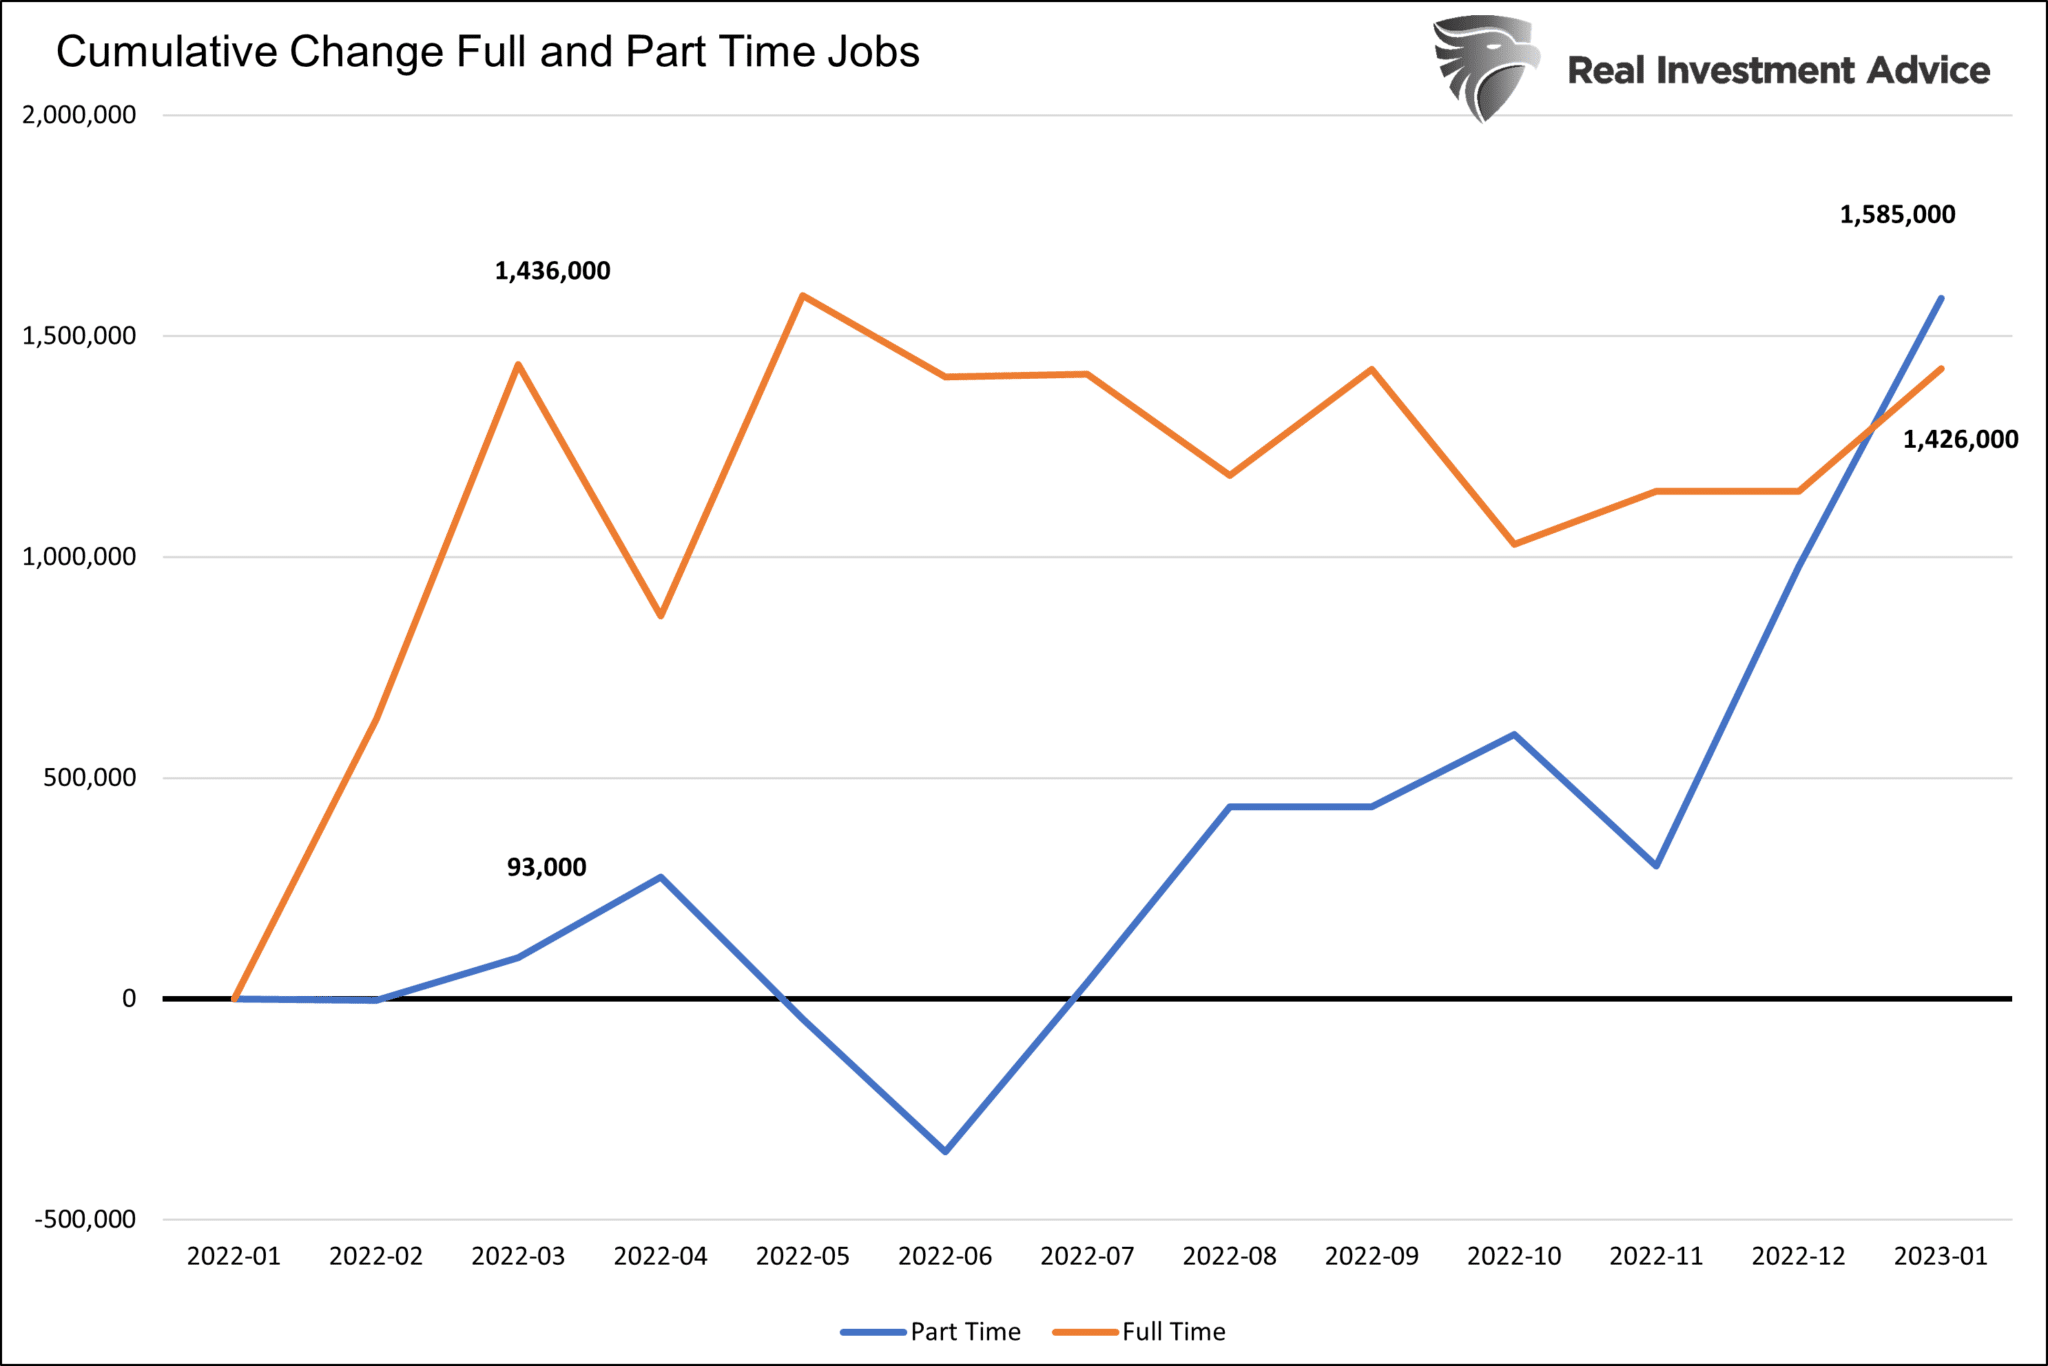
While a plethora of data paints the picture of a hot labor market, there are concerning signs beneath the surface. In the past, we have mentioned that job losses are occurring in higher-paying sectors and are being replaced with significant job growth in lower-paying sectors like leisure and hospitality. While the number of net jobs is rising, the quality of jobs is deteriorating. The graph below points to another worry. Since March 2022, the number of full-time jobs has shrunk slightly. However, the number of part-time jobs has increased by 1.5 million. The entire growth of the labor force for the last ten months is over 100% due to part-time jobs.
It’s worth noting the BLS non-farm payroll data is based on surveys of companies. These surveys can result in double and triple counting of individuals. For instance, the BLS may survey my three employers and count me as three people if I have three part-time jobs. The BLS will revise the data to correct for such faults, but such often occurs well after it is reported. We will likely find out next year that today’s labor market is not as hot as it appears.

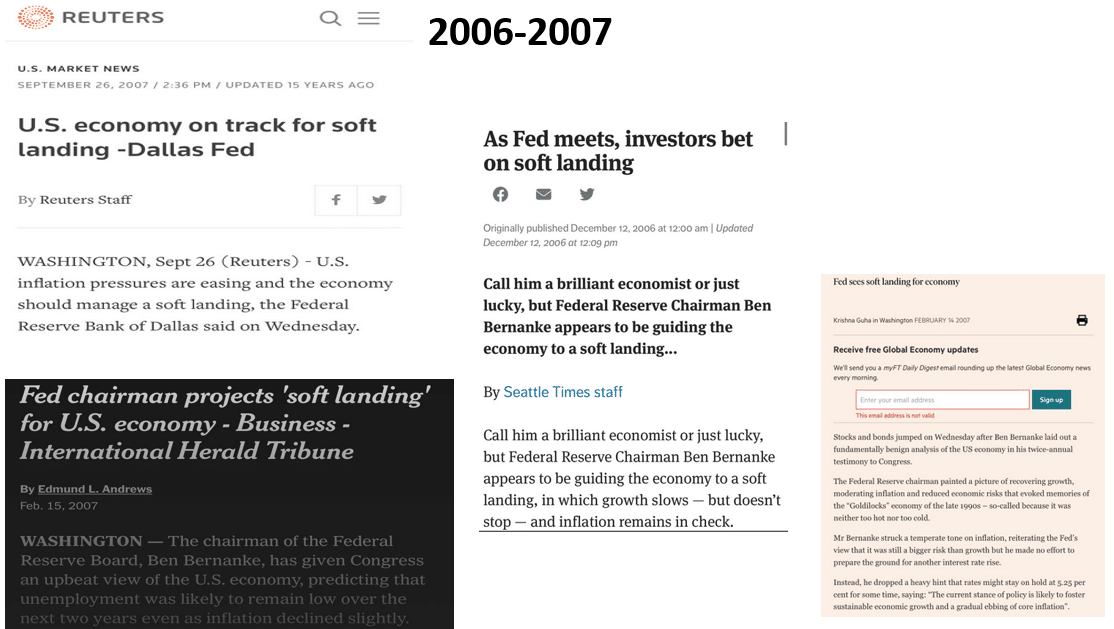
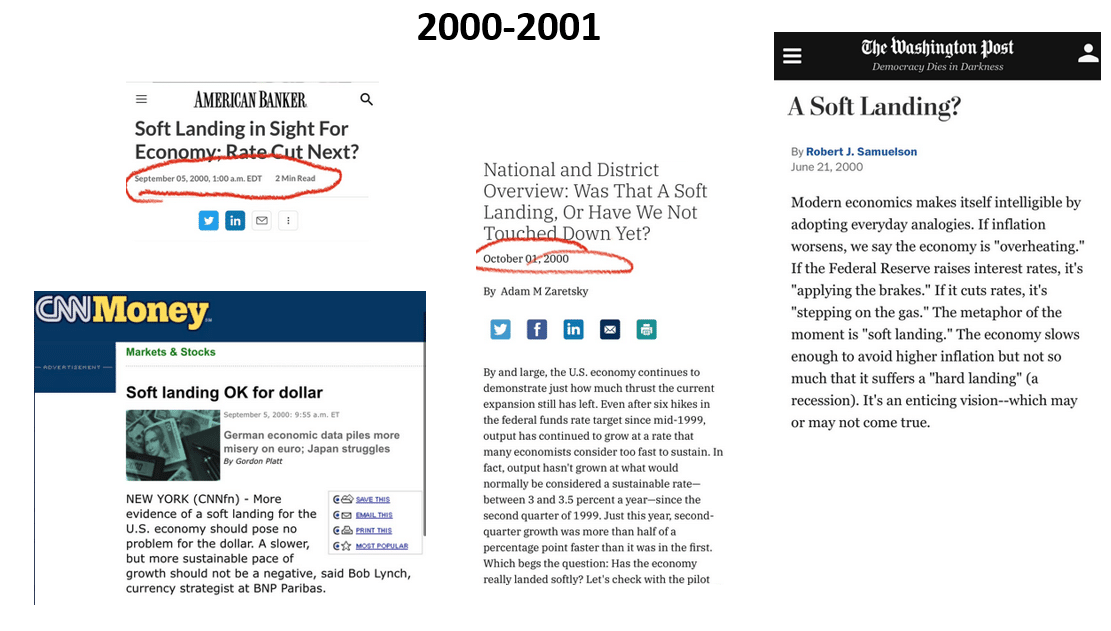
Recollections of Prior Soft Landings
The following graphics are courtesy of Michael Kantro of Piper Sandler. He shares them to remind us that it’s not uncommon for the Fed, Wall Street economists and investors to wrongly believe that higher interest rates and slowing economic activity will produce a soft landing and not a recession. What higher interest rates hold in store this time has yet to be seen. However, we mustn’t wholeheartedly buy into a soft landing scenario just because those often considered the most knowledgeable about the economy and financial markets think such will occur.
Tweet of the Day

Please subscribe to the daily commentary to receive these updates every morning before the opening bell.
If you found this blog useful, please send it to someone else, share it on social media, or contact us to set up a meeting.