


🔎 At a Glance
🏛️ Market Brief – Earnings Season Opens On A Raised Bar
The S&P 500 gained 1.1% this week to close Friday at 7,811.51, just shy of Tuesday’s record close of 7,818.93. The Dow added 0.9%, and the Nasdaq Composite rose 0.6%, while small caps slipped nearly 1%. Last week’s Q4 outlook noted that Treasuries now offer a return that stocks haven’t matched since 2002. This week, the 10-year yield pushed to its highest level since 2002 on Wednesday, then eased to about 5.25% after strong demand at the 10-year auction. Brent crude held above $100 after President Trump said the U.S. would not strike Iran before the midterm elections.
The bigger story was positioning for Q3 earnings, which start in earnest Tuesday with the big banks. As Friday’s Daily Market Commentary laid out, Wall Street did something unusual this quarter. It raised the bar. Per FactSet, Q3 estimates rose 1.4% during the quarter, against an average cut of 2.2% over the past five years. A record 72 companies issued positive guidance, and expected growth now sits at 29.6%.
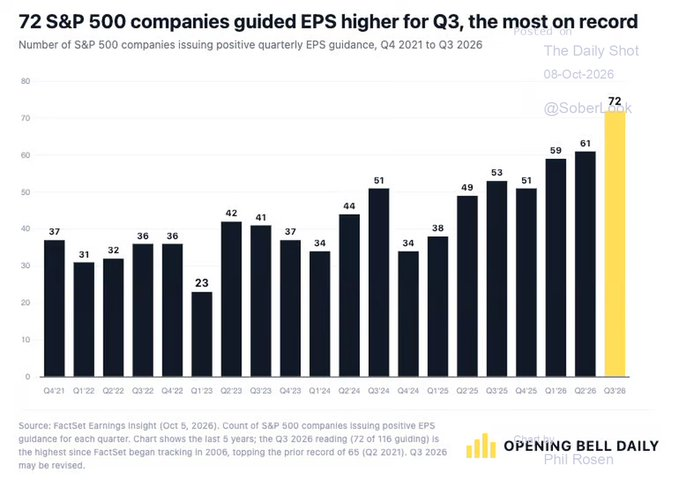
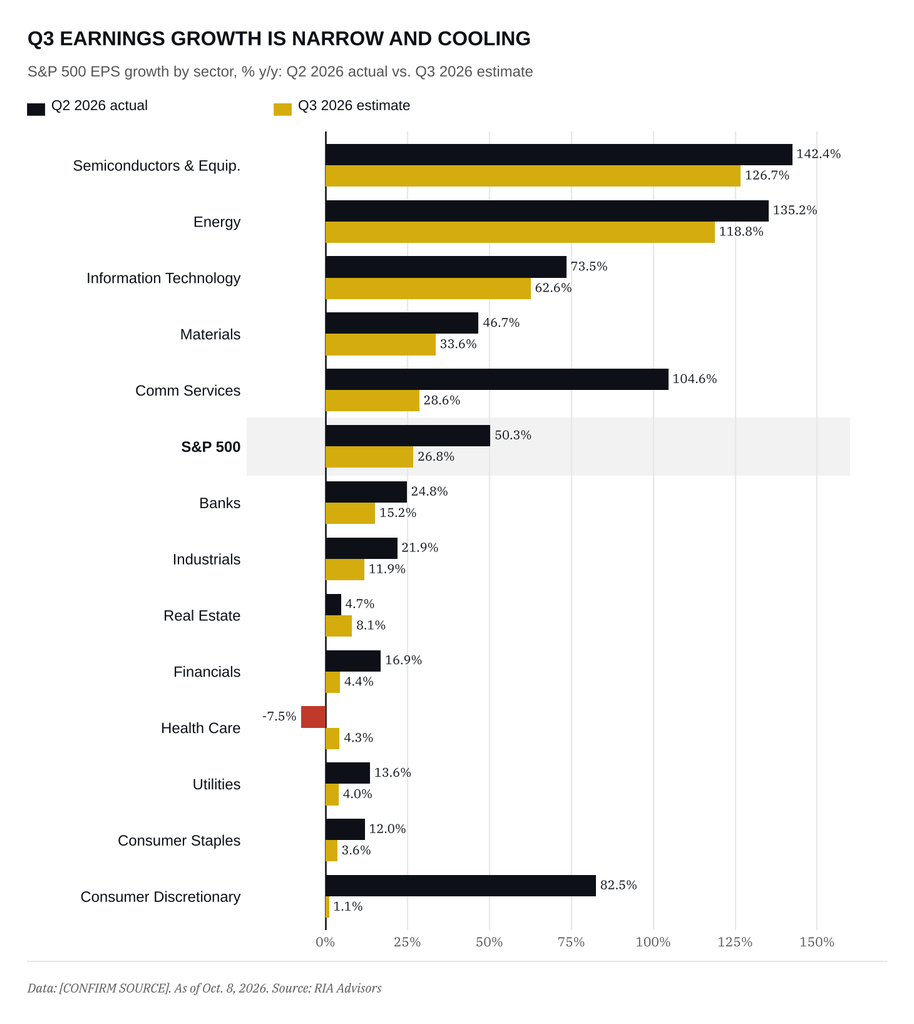
History says that the number often climbs higher. Actual growth has topped the end-of-quarter estimate in 37 of the last 40 quarters, and FactSet’s math implies Q3 growth above 35%. That math is why the “beat rate” headlines rarely disappoint. The early reports fit the pattern, with 84% of the first 19 companies beating estimates. The catch is where the growth lives. Semiconductors are expected to grow earnings by 126.7%, energy by 118.8%, and technology by 62.6%. Consumer discretionary, utilities, health care, and financials range from 1% to 4.4%. The earnings tape is as narrow as the price tape.
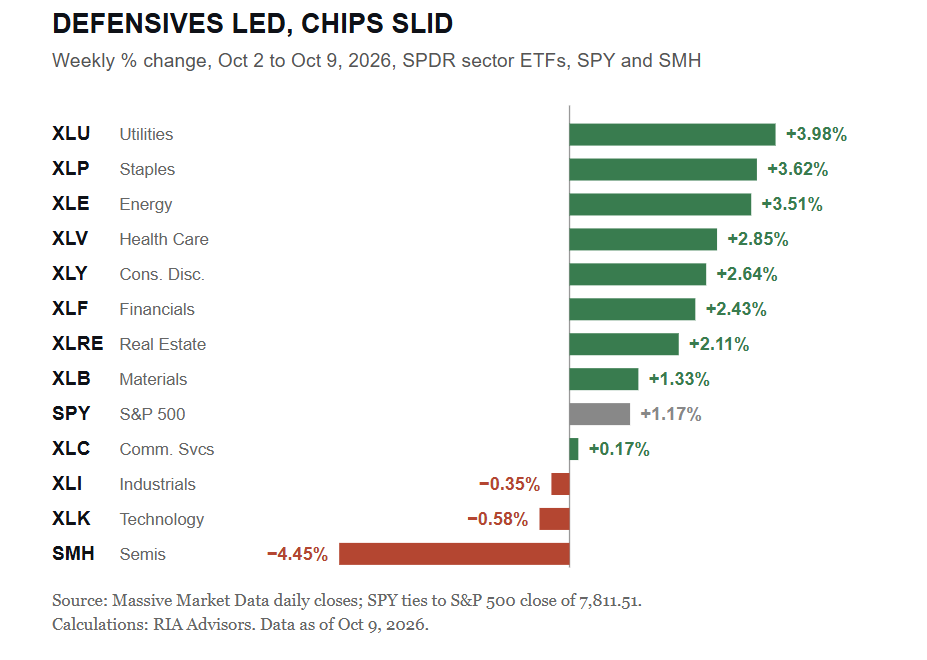
Now look at where the money went. Utilities, staples, and energy led, while technology slipped and the semiconductor ETF fell 4.5%. The equal-weight S&P 500 gained 1.6%, beating the cap-weighted index. Outside of energy, investors bought sectors expecting roughly 4% growth and sold the group expecting 127%. Such is the tension heading into the season. The index still leans on the chipmakers to deliver, while money is quietly hedging against them.
The Fed adds a wrinkle. September’s minutes showed most participants expect another hike by year-end, even as payrolls slowed to 29,000 and core PCE came in at 3.0%. With analysts raising numbers and companies guiding higher, consensus has rarely leaned this hard in one direction. From a contrarian view, when the experts all agree, something else tends to happen.
Tuesday’s bank reports are the first real test. A clean read from the financials would support the broadening that started this week. However, after this coming week, a stumble by the leaders will hit the only part of the index doing the heavy lifting.
📈Technical Backdrop – MACD Turns Up Just Below The Record
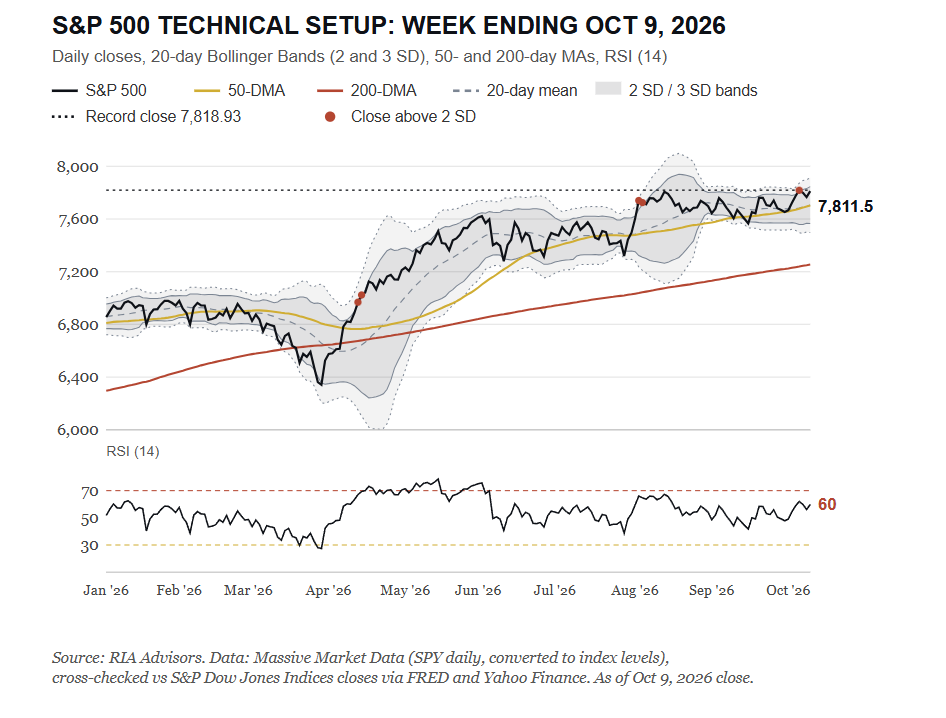
As noted, the S&P 500 closed Friday at 7,811.51, up 1.15% for the week and less than 0.1% below Tuesday’s record close. The index sits 1.4% above its 50-day moving average near 7,700 and 7.7% above its 200-day average near 7,250. Both averages are rising, which keeps the primary trend intact.
Zoom out, and the chart shows a market that spent two months in a range. Since mid-August, the index has chopped between roughly 7,570 and 7,800 before this week’s push to a record close. Ranges that resolve near the highs usually favor continuation, but this one is resolving on a narrow foundation. The 200-day average sits 7.7% below the close, so the longer-term trend has plenty of cushion. That distance also shows how far a normal correction could run without breaking the bull market.
Momentum improved. The 14-day RSI rose to 59.8 from 54.5 a week ago, leaving room before the 70 line that marks overbought territory. MACD crossed back above its signal line this week, a fresh buy signal after September’s chop. The index also sits about 1.5 standard deviations above its 20-day mean, so the upper Bollinger Band near 7,846 is the first ceiling.
Breadth is where the story gets more complicated. Only three of the 11 sector ETFs sit above their 50-day averages. Technology leads at 5.1% above, followed by energy at 3.7% and health care at 1.2%, which reclaimed its line this week. Last week, only two sectors cleared that bar. The laggards also closed much of the gap. Real estate improved to 4.1% below its average from 7.1%, and utilities to 2.0% below its average from 6.7%. Financials, the group that reports first next week, still sit 3.1% below their average.
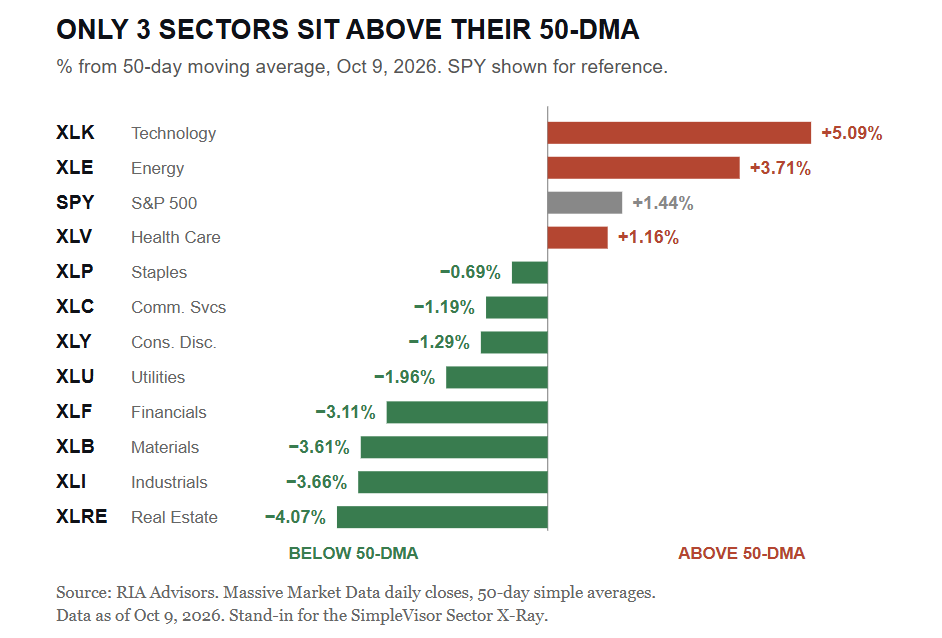
That improvement cuts both ways. Oversold sectors are exactly where a broadening move has to come from, and the equal-weight index outperformed this week. But the defensive rally came as semiconductors fell 4.5%, with chips driving earnings growth. Evercore also counts a record 140 S&P 500 members with negative beta, per Friday’s commentary. A record standing on a few names is NOT the same as a broad advance.
For traders, the playbook is simple. Don’t chase the market while it’s sitting at the resistance of previous highs. A close above the record and the upper band near 7,846, with semis participating, would open a run toward 8,000. Pullbacks toward the 50-day average near 7,700 are the place to add exposure. A break below the Sept. 16 low of 7,567, which also lines up with the lower Bollinger Band, would warrant raising hedges and cash. We continue to recommend rebalancing winners back to target weights ahead of earnings and using the 50-day average as the stop-loss line.
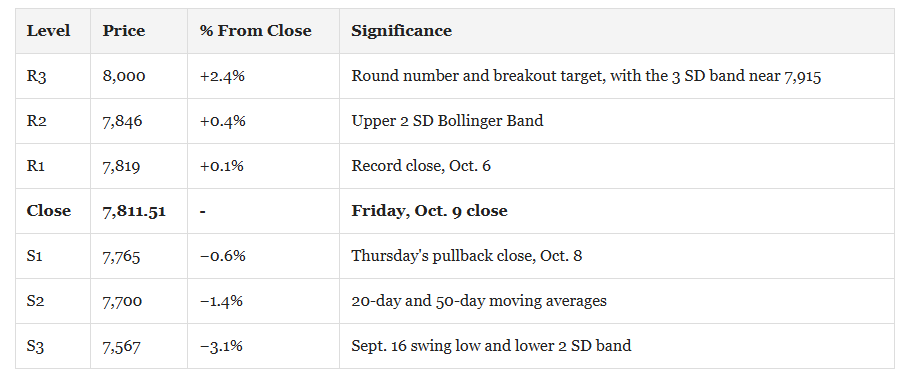
The level that matters next week is the record close at 7,818.93. A close above it with chips joining in confirms the breakout. A failure there, with bank earnings and CPI on deck, likely keeps the index boxed between 7,700 and 7,850. A close below 7,700 would shift the near-term trend back to neutral.
🔑 Key Catalysts Next Week
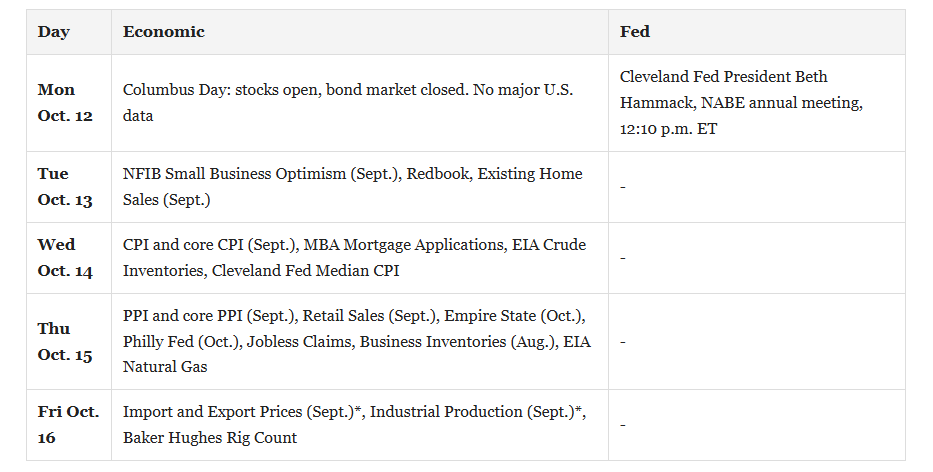
Two narratives collide next week. Q3 earnings season starts in earnest with the big banks, and the September inflation data lands before the Fed goes quiet ahead of its Oct. 27-28 meeting. Monday is Columbus Day, so stocks trade while the bond market stays closed.
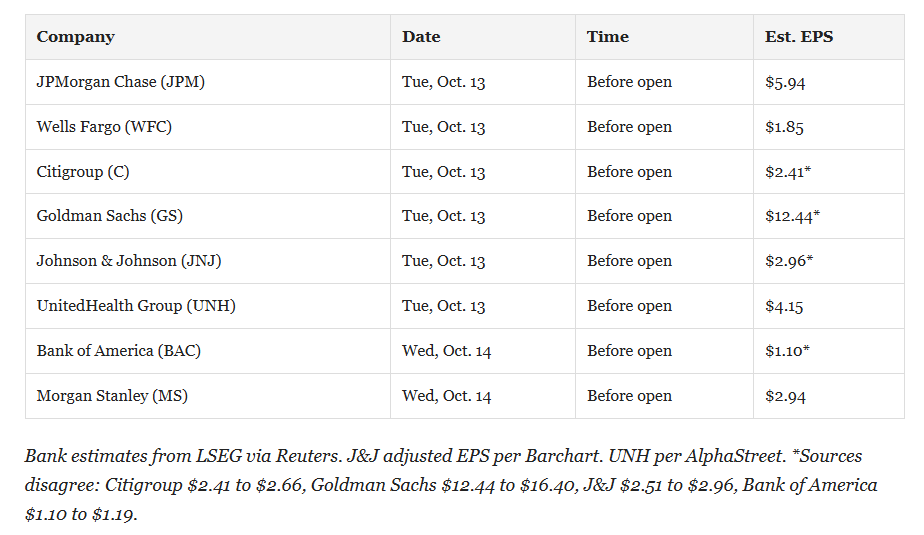
Tuesday morning brings JPMorgan, Wells Fargo, Citigroup, and Goldman Sachs, along with Johnson & Johnson and UnitedHealth. Bank of America, Morgan Stanley, BlackRock, Progressive, and ASML follow on Wednesday. Thursday is the heavyweight session, with Taiwan Semiconductor, Charles Schwab, PNC, U.S. Bancorp, BNY, and Prologis. Travelers closes the week on Friday.
Banks are expected to grow earnings 15.2%, well above the 4.4% expected for the financial sector overall. Watch net interest income, loan growth, and credit quality with yields near their highest level since 2002. If the banks show loan growth and steady credit with the 10-year above 5%, the broadening case gets real support. TSMC on Thursday is the most important read on AI demand after this week’s chip selloff, and ASML gives the equipment side a day earlier.
On the data side, Wednesday’s CPI report is the main event after August’s headline rate of 3.4%. Thursday is crowded, with PPI expected to be up 0.5% for the month, retail sales expected to be up 0.3%, plus the Empire State and Philly Fed surveys. Cleveland Fed President Beth Hammack speaks Monday.
Markets are currently pricing in roughly a 20% chance of an October hike, but traders see about an 80% chance of a move by December. The Fed’s quiet period begins Saturday, Oct. 17, so next week is the last chance for officials to shape expectations before the meeting. Expect any hawkish or dovish lean in their remarks to show up quickly in the 2-year yield.
Oil remains the wild card. Trump’s pledge not to strike Iran before the Nov. 3 midterms pulled Brent back, but it still sits above $100.
The single most market-moving event is Wednesday’s CPI. A soft print would support the “pause” camp and pull the 10-year back toward 5%. A hot one revives bets on December rate hikes and pushes yields higher, which matters more than usual given that stocks offer little premium over bonds.
Need Help With Your Investing Strategy?
Are you looking for comprehensive financial, insurance, and estate planning services? Need a risk-managed portfolio management strategy to grow and protect your savings? Whatever your needs are, we are here to help.

💰 Equity Risk Premium Has Vanished, And Stocks Aren’t Cheap.
Last week’s Q4 market outlook laid out why the calendar, earnings, and buybacks lean bullish into year-end. I still think that. But one line in that report deserved more than a sentence. With the 10-year above 5%, Treasuries now offer a “risk-free” return that stocks haven’t matched since 2002. So this week, I rebuilt that claim from the raw data. The equity risk premium, the extra return investors demand for owning stocks over bonds, is the thinnest it’s been in a generation. What history says happens next is the more interesting part.
The Equity Risk Premium Has Turned Negative
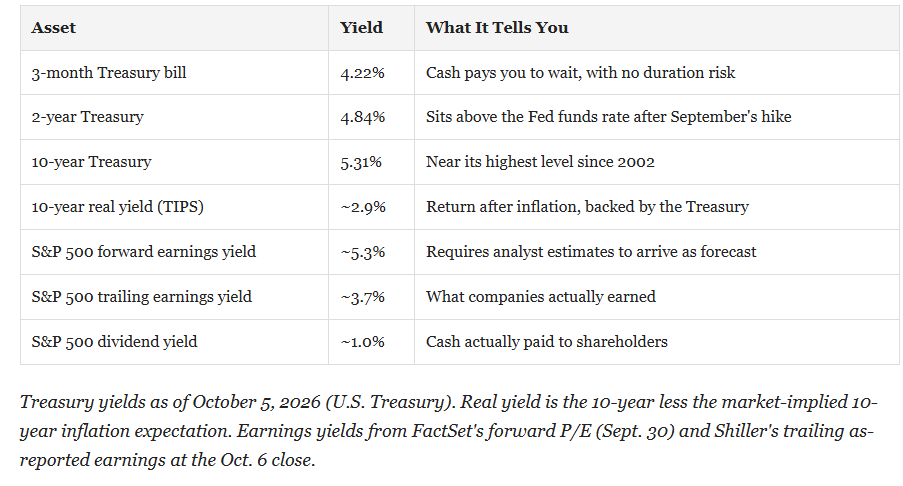
The simplest version of the math compares what the S&P 500 earns with what a Treasury note pays. At Tuesday’s record close of 7,818.93, the index traded at about 27 times trailing as-reported earnings, according to Robert Shiller’s data. ChartRow’s independent count is 26.4. Either way, that’s an earnings yield of roughly 3.7%. The 10-year closed at 5.31% on Monday. In other words, every dollar in the index currently “earns” about 1.6 percentage points less than a dollar parked in a government bond.
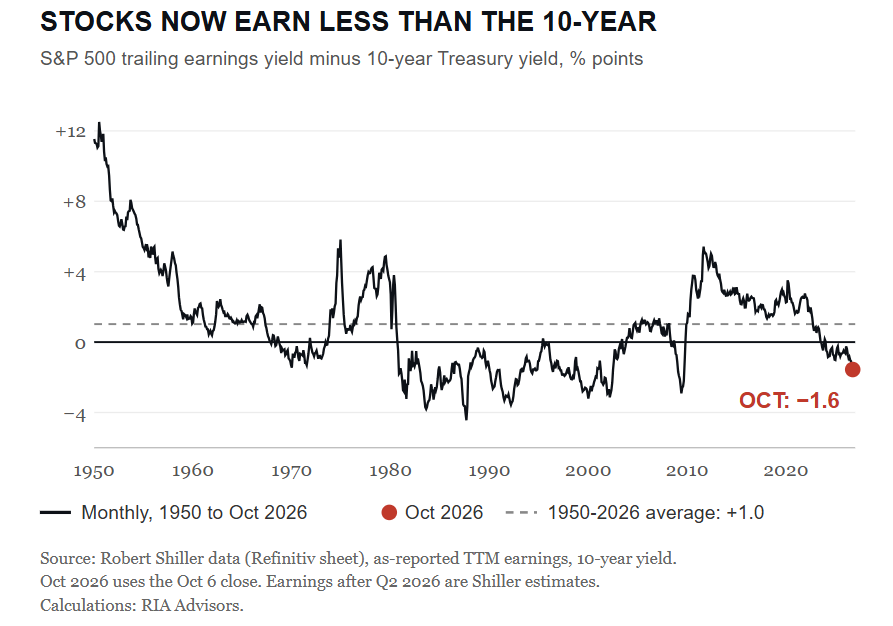
Notice in the chart above how rarely the spread sits this far below zero. Shiller’s monthly data, now running through October 2026, puts the average since 1950 at about +1.0 point. Aside from the 2009 earnings collapse, the last time stocks yielded this much less than bonds was in 2002.
Someone will tell you trailing earnings are the wrong yardstick when profits are growing at nearly 30%. Fair enough. Use the forward numbers instead. FactSet’s forward P/E of 19.0 implies an earnings yield of about 5.3%, which is right on top of the 10-year. Such is the problem. Even on Wall Street’s most optimistic earnings math, investors get paid next to nothing extra to own stocks over bonds.
A Negative Premium Only Hurts When Stocks Are Expensive
Here’s where it gets interesting, and where I had to check my own bias. I sorted every month since 1950 by its starting premium, then measured the S&P 500’s real total return over the following decade. A negative premium on its own was NOT a reliable sell signal. The 1980s are the reason. Through the first half of that decade, the 10-year yielded well into double digits, stocks earned less than bonds month after month, and investors who bought anyway were rewarded with one of the best ten-year runs the market has ever produced.
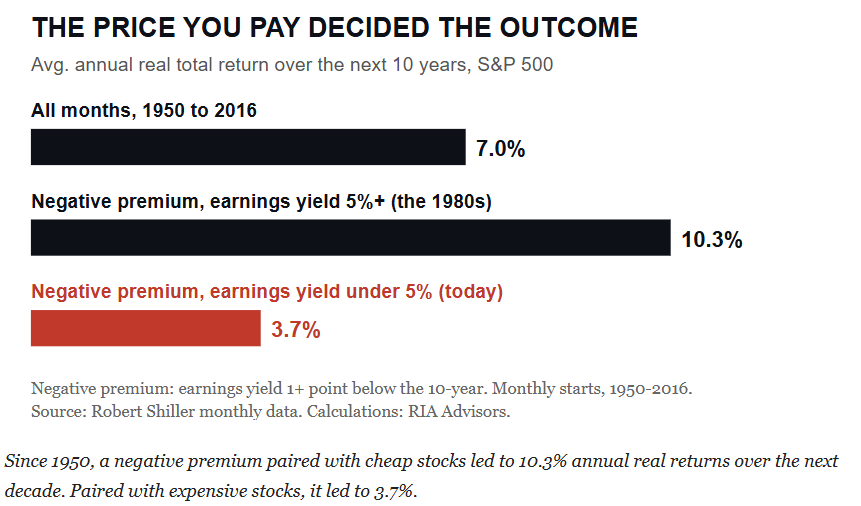
The difference was the starting price. In the early 1980s, the S&P 500 carried an earnings yield above 5%, and at times above 12%. Stocks were cheap, and bonds were cheaper. The premium was negative because yields were enormous, and when yields collapsed, both assets soared. Starting points like that averaged a 10.3% real annual return over the next ten years. Only about one in twenty lost money.
Now look at the other bucket. When the premium was negative and the earnings yield was below 5%, the average real return fell to 3.7% per year. More than one in four of those ten-year stretches finished in the red. Most of those starting points came during the 1990s run-up and the dot-com peak. Such is the distinction that matters. Today’s 3.7% earnings yield puts us squarely in the expensive bucket, not the 1980s one.
A negative premium is survivable when you buy cheap. It’s a problem when you pay up for the privilege.
Cash And Bonds Now Pay You To Wait
For the better part of fifteen years, zero-yield money markets fueled the “there is no alternative” trade. Savers got pushed out of the risk curve because cash paid nothing. That flow can run in reverse, and Michael Lebowitz laid out why in “From TINA To TIGA.” Here’s what the alternatives pay today.
“Stocks return 10% over time. Why would I lock in 5%?”
Because that 10% assumes you start at an average valuation, and we aren’t starting there. Adam Taggart and I covered this on October 3rd in our conversation about buying bonds if a bear market worries you. A 5.3% Treasury held to maturity has no drawdown risk on the way to that return.
The bulls do have a valid point. When you measure stocks against inflation-protected Treasuries, instead of nominal ones, the premium survives. Currently, that premium ranges from roughly 0.8 to 2.3 points, depending on whose earnings you trust. That’s a thin margin, and the higher end depends on nearly 30% earnings growth arriving on schedule. For me, there is also some irony here. In my view, yields will eventually come down due to the disinflationary impact of debt on the economy. This is why I’ve argued for keeping bonds in your portfolio rather than ditching them. If yields fall, the premium rebuilds from the bond side, and stocks get rescued by the same math that hurts them today. If they don’t, the comparison to 1997 through 2002 stops being an analogy.
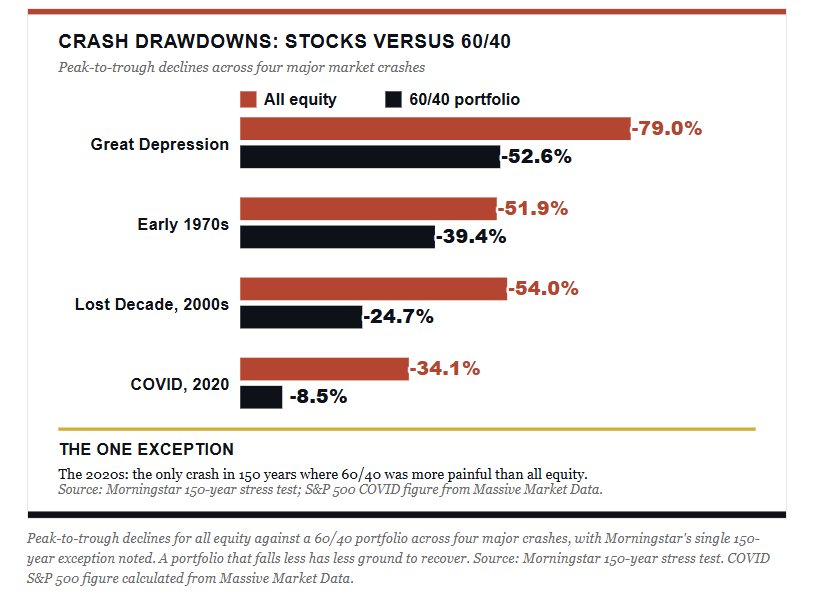
Notably, the recovery math is what investors consistently underestimate. We previously discussed that if a portfolio suffers a 24.7% drawdown, it requires a 33% gain to get back to even. However, if it suffers a more “Financial Crisis” impact of a 52.6% decline, that 111% recovery can take years to return to the previous level. Bonds not only reduce losses but also shorten the climb back, and that difference compounds over the years of a retirement timeline.
Here is another crucial point for owning bonds in your portfolio, particularly if nearing retirement. Income is better today than at any point in two decades. The 10-year yields 5.3%, more than three times what it paid at the end of 2021. That is contractual cash flow rather than hoped-for appreciation, which means you aren’t forced to sell equities into weakness to fund a withdrawal.
Lastly, the behavioral issue determines outcomes. DALBAR’s 2026 study found that the average fixed-income investor earned 2.41% in 2025, while the Bloomberg Aggregate returned 7.30%, a gap of 4.89 percentage points. Investors pulled a record 2.30% of assets out in a single month, July 2025.8 Read that again. The asset class returned more than 7%, while the people who owned it captured a third of the return. They sold into the drawdown and bought back after the recovery, which is the same behavior that the stock-bond correlation debate is now encouraging on a much larger scale.
What Should Investors Do Now
Let’s state the obvious: none of this discussion is about wholesale dumping of stocks before year-end. As discussed in last week’s report, the seasonal and earnings tailwinds still stand. Furthermore, the equity risk premium is a ten-year signal, not a ten-week timing tool. However, it does argue for changing what you own and how much risk you carry while you own it. A negative equity risk premium only normalizes in two ways. Bond yields fall, or stock prices do. The table below presents both outcomes simultaneously.
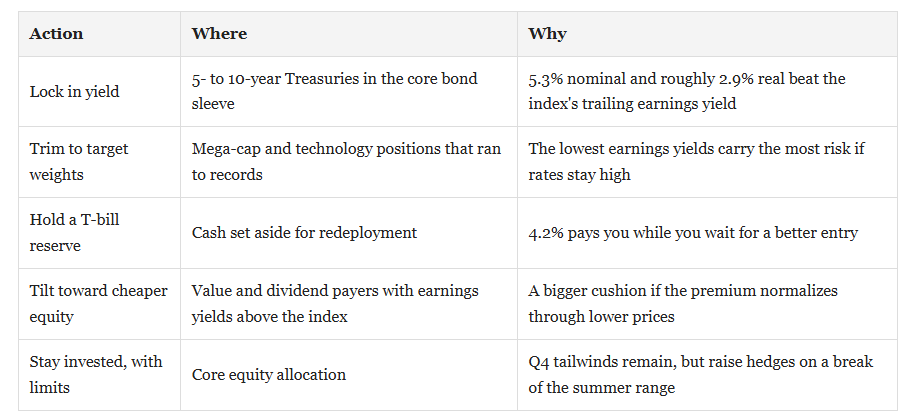
For our clients, this means a few recent changes. We shortened the duration slightly, but are still maintaining the overall bond allocations across all stock/bond allocation models. This is not because bonds are exciting, nor because the past five years treated them kindly. We keep those bond allocations because they remain the cheapest insurance against the one scenario that most severely damages a retirement plan. That is when a deep equity drawdown arrives early in the withdrawal phase.
Owning bonds in your portfolio is a choice. If you choose not to, there is nothing wrong with that decision as long as you can manage portfolio risk. If you choose to own bonds in your portfolio, they should be sized to your circumstances rather than to a number somebody printed in 1952. Forty percent is not a law of nature. Your income needs, your time horizon, and your honest tolerance for watching a statement fall determine that figure.
Understand the limitation clearly. Duration protects you in a growth shock and hurts you in an inflation shock. If inflation is the risk that keeps you awake, the answer is inflation-sensitive assets and a shorter duration.
The bond market is finally paying investors to be patient. The stock market is still charging full price for impatience.
🖊️ From Lance’s Desk
This week’s #MacroView blog explores the rising Gen Z gambling epidemic that is quietly moving a generation’s money from the market to the house, and the bill comes due later.

Also Posted This Week:
📹 Watch & Listen
The S&P 500’s breakout to all-time highs is losing momentum. With stocks retreating into their recent trading range, is this a failed breakout or a healthy pullback before a stronger fourth-quarter rally?
Subscribe To Our YouTube Channel To Get Notified Of All Our Videos
📊 Market Statistics & Analysis
Weekly technical overview across key sectors, risk indicators, and market internals

💸 Market & Sector X-Ray: Market Gains Ground
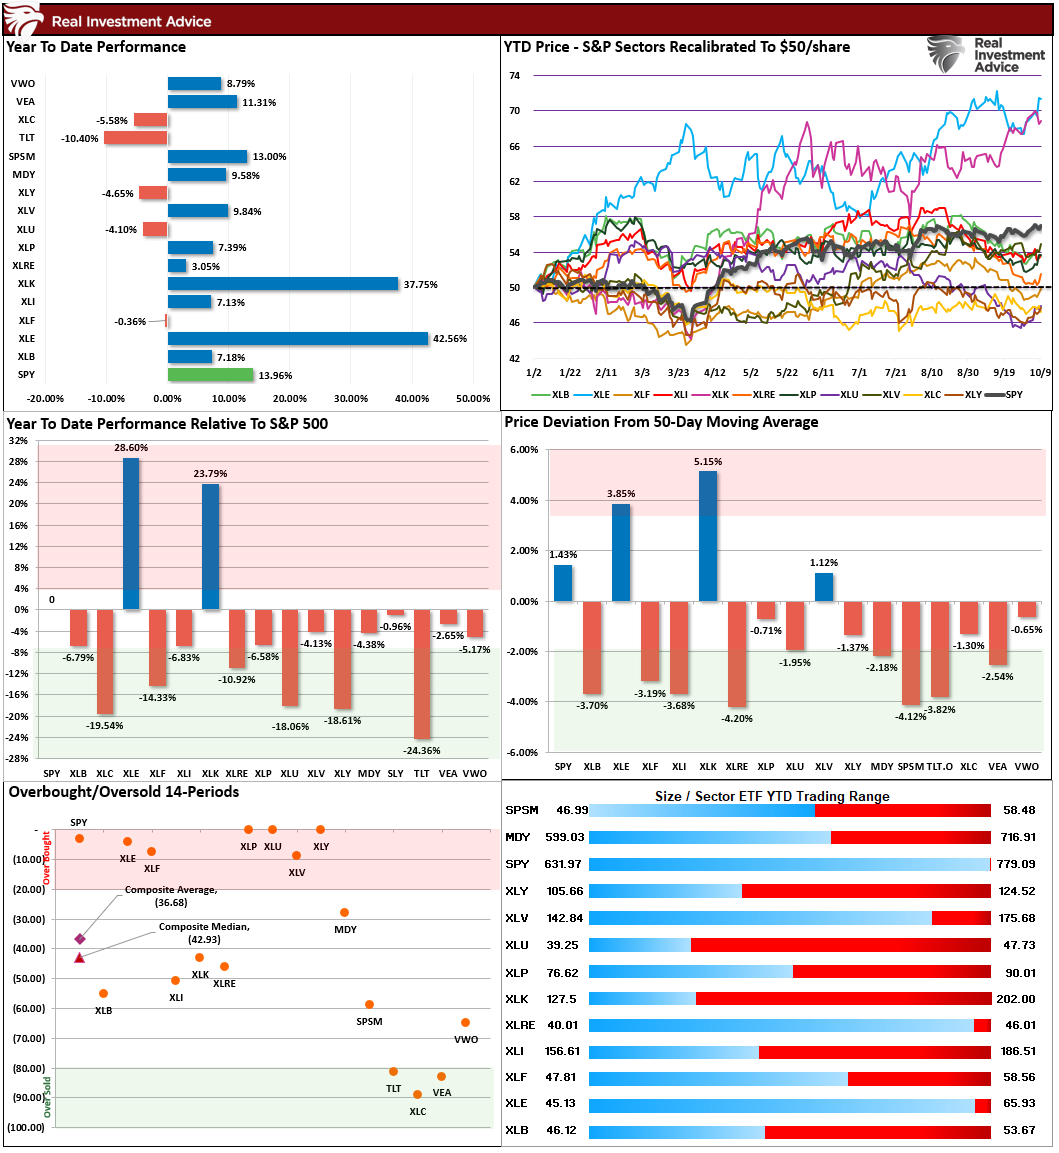
As we kick off Q4, Technology and Energy remain the key market drivers and are overbought relative to most other markets and sectors. This setup continues to suggest, as noted in the Factor Model below, that a market rotation from growth to value is becoming more likely heading into year-end. On a short-term basis, bonds and interest rate sectors are extremely oversold and are likely opportunistic for a tradeable rally.
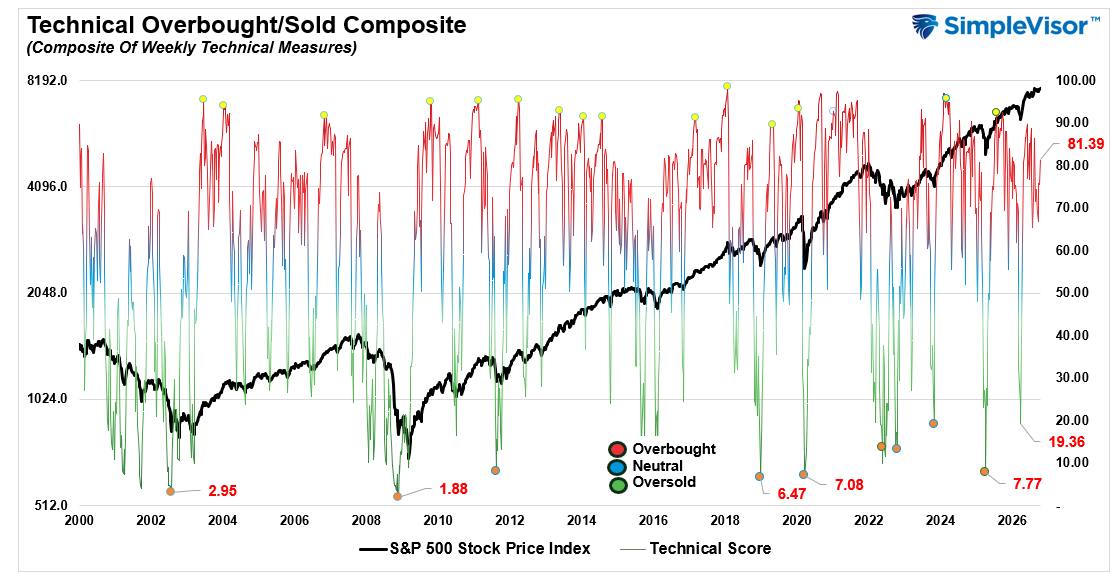
📐 Technical Composite: 81.39 – Increased Sharply This Week, Still Overbought
The technical condition increased sharply this past week. However, overall, the market remains technically overbought, and sentiment remains mostly bullish for now with no significant technical breaks. The indicator does suggest more struggles for the market next week.
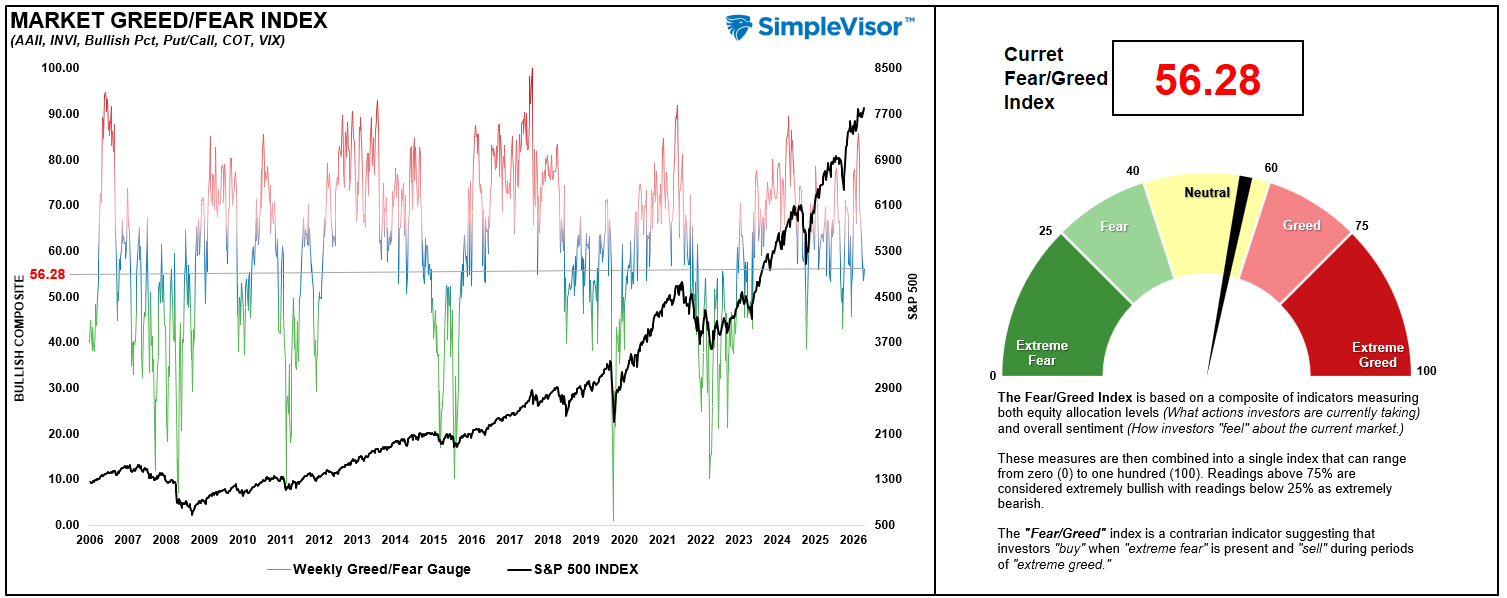
🤑 Fear/Greed Index: 56.28 – Holding At Neutral
Even though the market rose a bit last week, the underlying market allocation and sentiment remains more bearish. There was a continued drop in the Commitment of Traders equity allocations, however, investor sentiment turned slightly more bullish last week. If the market can continue to hold up into earnings season, it could present a good buying opportunity over the next month or so.
🔁 Relative Factor Performance
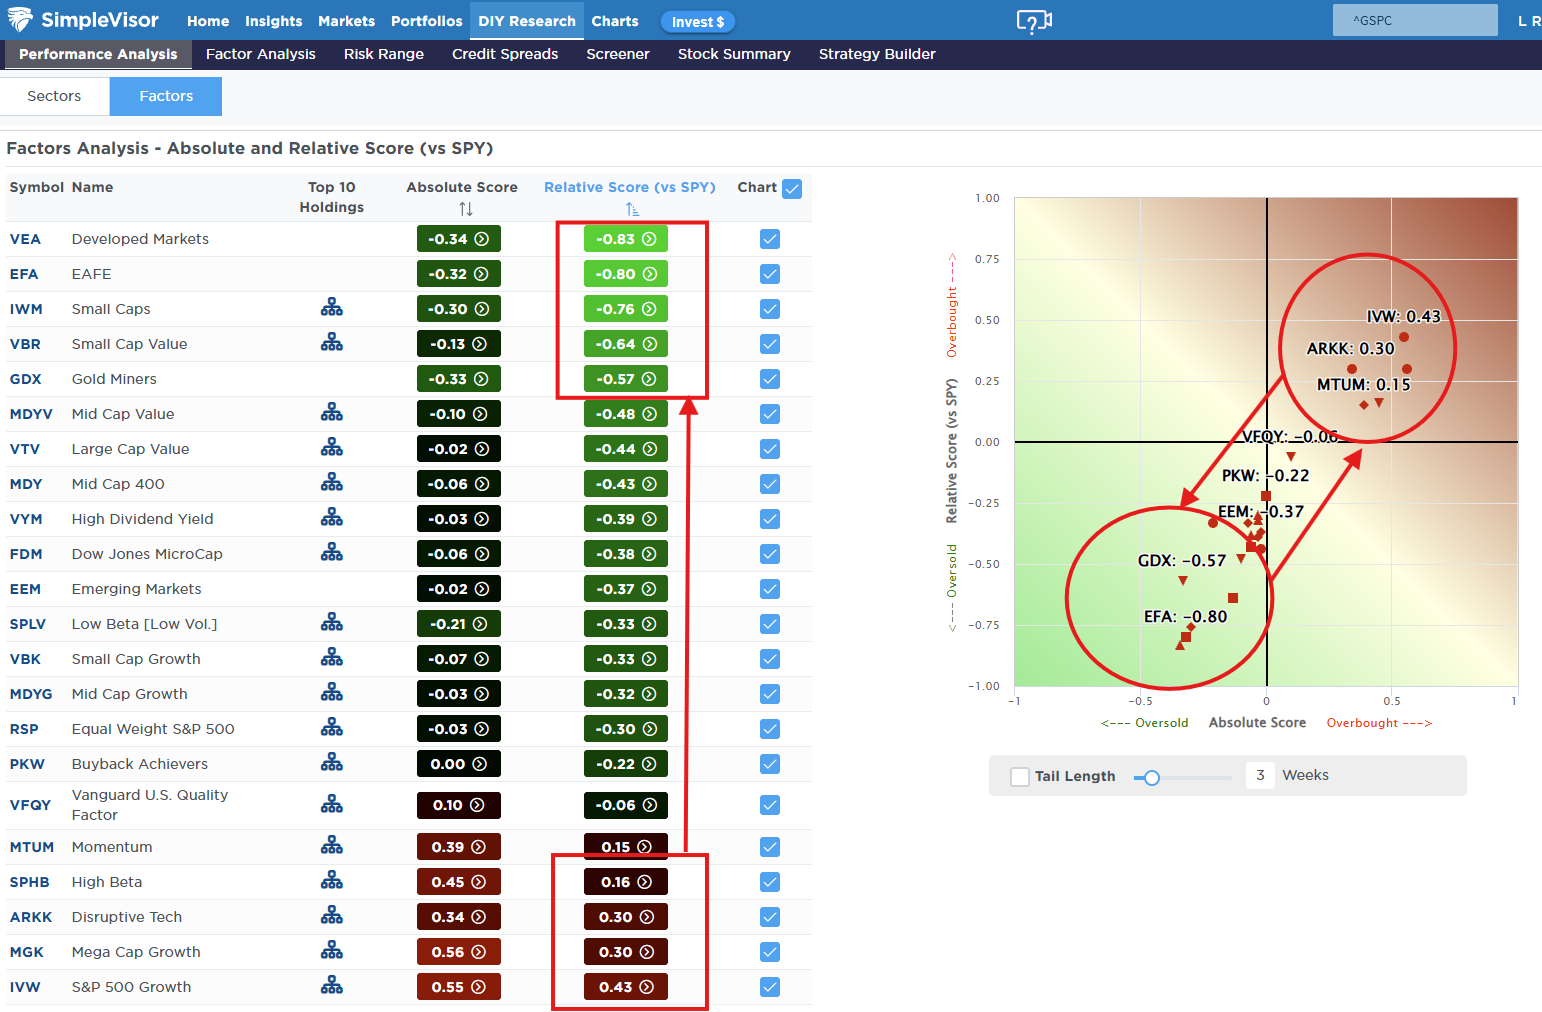
Last week, we stated that “Factor performance has diverged over the last couple of weeks, with Growth, Speculative Technology, and Megacaps now extremely overbought, while Value, Low Beta and Dividend Yield (interest rate sensitive sectors) now the most oversold.” This past week, we saw the early stages of a potential reversal occurring as the growth factors pulled back somewhat what the value sectors advanced. With earnings starting this week, we will see if these factors continue to converge.
📊 MFBR Index (Money Flow/Breadth Ratio Indicator)
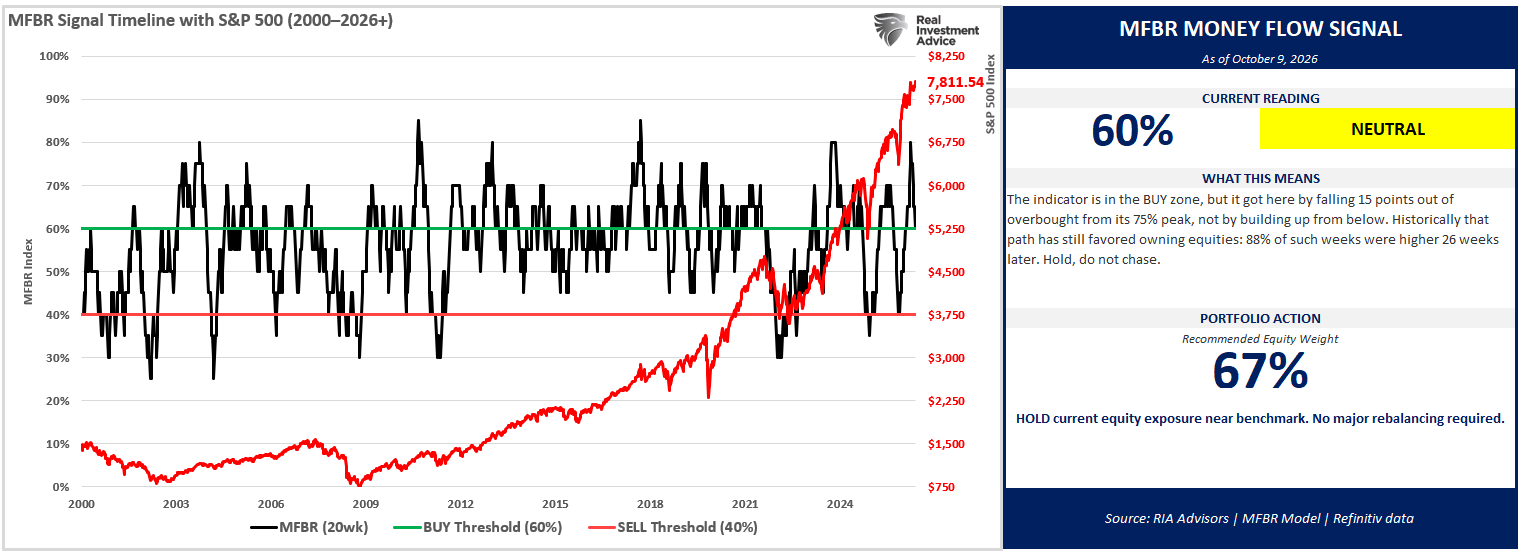
The Money Flow Breadth Ratio (MFBR) model is a rules-based equity allocation framework that uses weekly S&P 500 money flow data to generate buy, sell, and neutral signals. The MFBR systematically adjusts portfolio equity exposure in response to the direction and persistence of institutional capital flows. It aims to reduce drawdowns while capturing the majority of market upside.
“As of October 9, 2026, with the S&P 500 at 7,811.54, the Money Flow Breadth Ratio (MFBR) stands at 60%, down from a peak of 75% set 7 weeks ago and flat versus 60% the prior week. The trailing four-week change is still -10 percentage points, but the near-term trend has rolled over. This places the indicator in BUY territory (60-70%). The raw zone signal reads NEUTRAL, but the model still flags a TOP REVERSAL, with 15 points now off the peak. Read that NEUTRAL as a zone label, not as fresh confirmation – the model reached this band by falling out of overbought, not by building up from below.
Bottom line: hold the target weight. The roll-over off the 75% peak is real and worth watching, but it has carried the gauge into the band that has historically been the best place to own equities. This is neither a chase nor a de-risk. A sustained break below 60% would move the grid to an underweight; a move back above 70% would re-engage the contrarian trim.”
📊 Sector Model & Risk Ranges
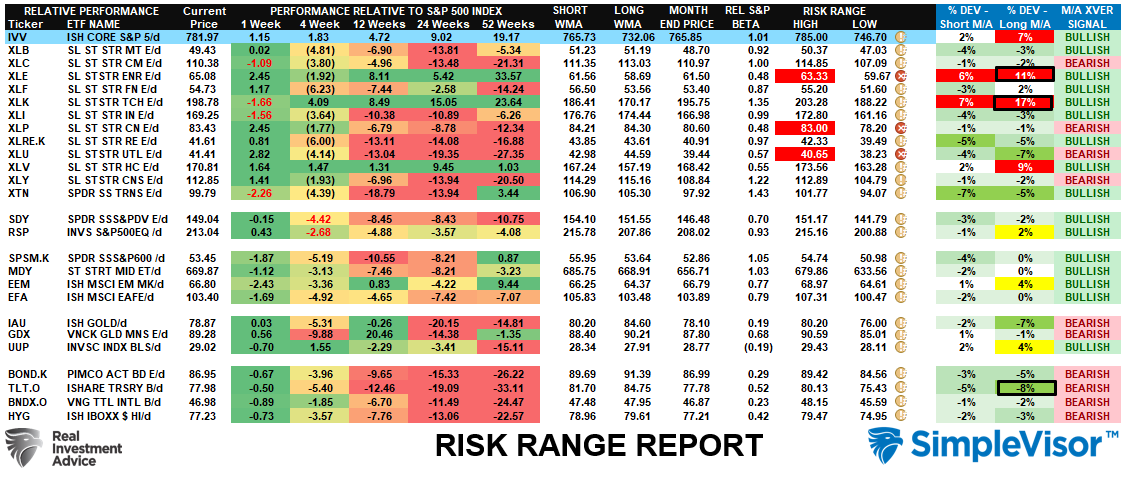
This past week, the two leading sectors continued to lead, Energy and Technology, and are now extremely deviated above their long-term weekly means. Historically, such deviations lead to corrections or consolidations so profit-taking and rebalancing is recommended. Conversely, bonds are now extremely oversold, along with Transportation, Utilities, Real Estate and Financials. Any reversal in rates in the coming months could see a pick up in performance.
Have a great week.
Lance Roberts, CIO, RIA Advisors


Lance Roberts is a Chief Portfolio Strategist/Economist for RIA Advisors. He is also the host of “The Lance Roberts Podcast” and Chief Editor of the “Real Investment Advice” website and author of “Real Investment Daily” blog and “Real Investment Report“. Follow Lance on Facebook, Twitter, Linked-In and YouTube
Customer Relationship Summary (Form CRS)