


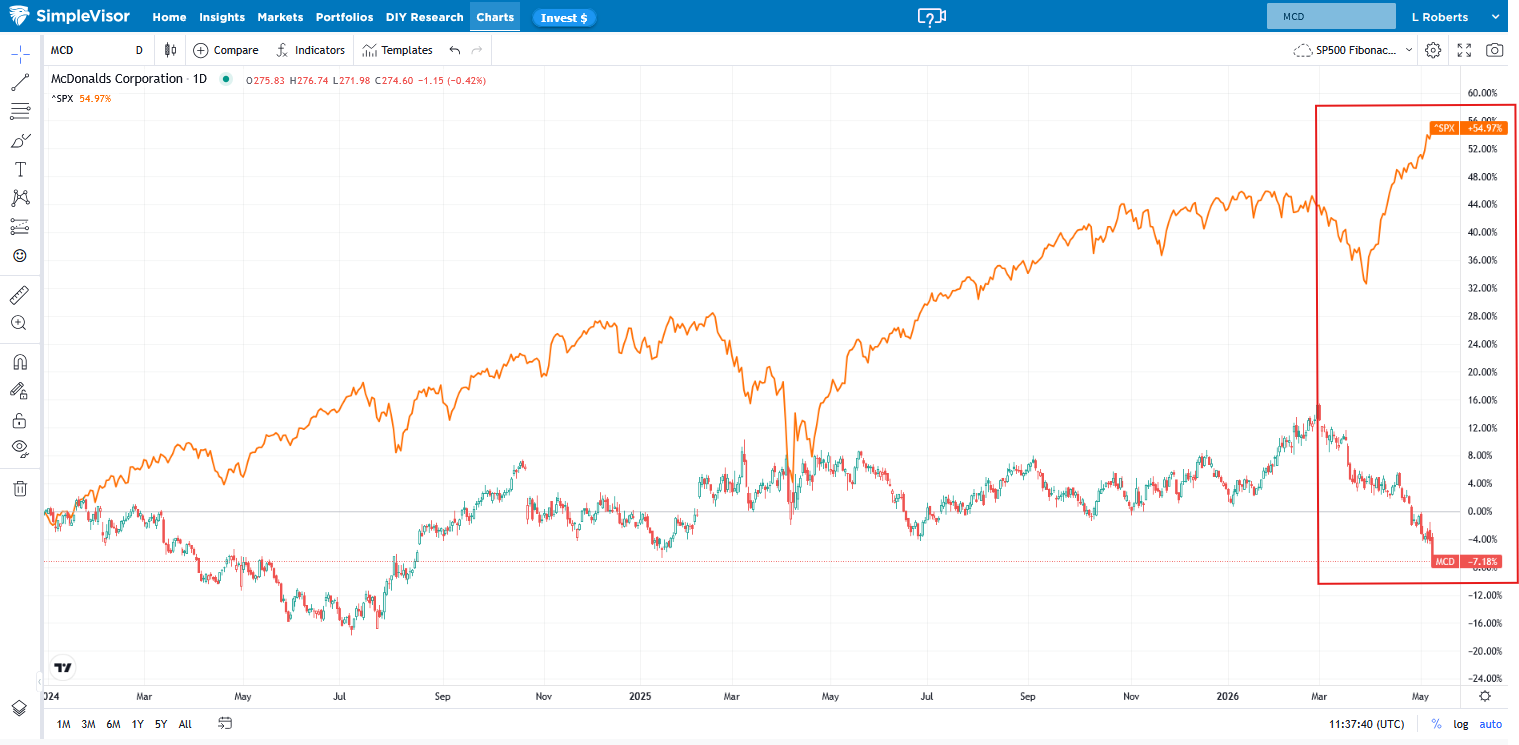
Since the start of 2024, McDonald’s (MCD) stock has fallen 7% while the S&P 500 has risen over 50%. More recently, since the start of hostilities with Iran, MCD is down nearly 20% while the broader market recovered initial losses and rallied to record highs. It’s not just fast food giant MCD trading poorly. Many of its competitors are at or near 52-week lows. The bullet points below show how far other fast food retailers are from their 52-week highs.
- Yum Brands: -10.3%
- Domino’s: -37.2%
- Chipotle: -45.2%
- Wendy’s: -46%
- Shake Shack: -55.4%
- Wingstop: –66.7%
So the obvious question is: why are fast food companies trading so poorly? There are a few reasons. Leading the list is that consumers at the lower end of the wealth spectrum are tapped out due to higher inflation and spending less on eating out. Moreover, profit margins are under pressure as expenses rise due to minimum wage hikes in many states and rising food costs.
Outside of the more typical structural challenges are the new headwind being caused by GLP-1 weight loss drugs. JP Morgan estimates that one in eight US adults is taking a GLP-1 drug. Not only are those users reducing their caloric intake, but there is also growing evidence that GLP-1 users develop a preference for nutrient-rich, higher-protein foods. With GLP-1 uptake increasing rapidly, the fast-food companies that can modify their menus toward healthier, lower-calorie offerings may be the ones that outperform the industry.
What To Watch Today
Earnings

Economy

Market Trading Update
Yesterday, we touched on bonds and the current setup for a tradeable opportunity that will arise with the ending of the Iran crisis. However, today, I would like to talk about an event that happened this past Friday.
The S&P 500 closed Friday, May 8, at 7,398.93, capping its sixth consecutive weekly gain. That’s the longest weekly winning streak since 2024, and it has the financial press leaning hard into the bullish narrative. Before we get carried away, let’s look at what the data actually says about returns after streaks like this.
Since 1950, the S&P 500 has logged 51 weekly winning streaks of six or more weeks, according to the Stock Trader’s Almanac. The longest ever was 13 weeks in 1957. So this kind of run is uncommon. However, it’s not vanishingly rare. It happens often enough that we have a real sample to work with.
Yes. That’s the short answer, and it’s what makes this setup tricky for active investors. When a six-week streak finally breaks, the typical sequence runs like this. Week one of the unwind delivers the headline pullback, usually a little over 1%. Week two, the index finds footing and trades sideways. Week three, dip-buyers step in and the index claws back most of what it lost. By the end of week four, the cumulative return from the streak’s peak is essentially flat to slightly positive.

As shown, the average 4-week forward return after similar momentum extremes is at +0.1%, which is worse than the +0.7% baseline for any random 4-week window. In other words, the market doesn’t go anywhere for a month, but it doesn’t go down meaningfully either. That’s the buyable-dip window. The pullbacks are shallow, they don’t last, and they get scooped up by everyone who missed the original move. We’ve watched this play out repeatedly since the March 30 low, with the largest peak-to-trough drawdown landing in the low single digits.
The math gets uglier as you stretch the time horizon. The 6-month forward return is just +2.7%, versus a typical +4.4%. The 12-month forward return, however, printed +9.2%, versus a long-term baseline near +8.9%. Volatility was also lower across those windows. Motley Fool ran a separate study on 7-month winning streaks across 100 years of data. After those streaks, the median 12-month forward return dropped to roughly 5%, compared with the long-term median near 10%. Roughly half the typical pace.

Please take a look at the pattern. Streaks don’t predict crashes. They predict mediocrity. That has both tactical and strategic implications. Tactically, the next two to three weeks should offer a shallow pullback worth buying for anyone who is underweight in equities. The math says those dips get bought. Strategically, the next six to twelve months are likely to deliver returns well below the historical average. So don’t extrapolate the last six weeks into next year.
The current setup also faces a few headwinds that could weigh on future returns. Valuations are stretched. AI-related names account for close to half of the S&P 500’s market cap. The Fed is on hold. Oil is trading near $100 due to the Iran situation. April payrolls came in at 115,000, decent but cooling. None of that is fatal. All of it argues for moderating expectations.
If you are underweight equities, you can buy the shallow dip if you get one in the next few weeks, but trim your 6 to 12-month forward return assumptions. The rally has earned the benefit of the doubt. It hasn’t earned blind faith.

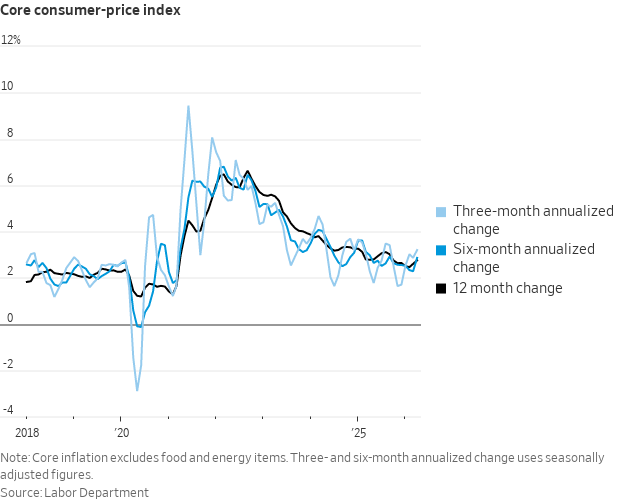
CPI
CPI was slightly hotter than expected, with both the headline and core figures coming in 0.1% higher than expected. There are a lot of factors that make this CPI print tough to sort out.
For starters, monthly energy prices rose 3.8% in April, accounting for over 40% of the CPI increase. While we can account for energy inflation by looking at core CPI, it’s much more difficult to see how higher energy prices filter into the prices of other goods and services.
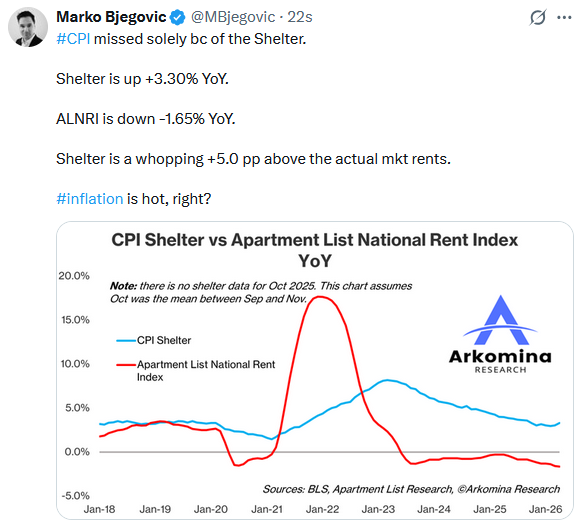
Shelter prices, accounting for over 40% of CPI, rose 0.6%, the largest monthly increase in over two years. The problem with the figure is stark evidence from many real-time private market indexes that rent prices are flat to declining. The Tweet of the Day below shows the large divergence between CPI rent and the Apartment List national rent index.
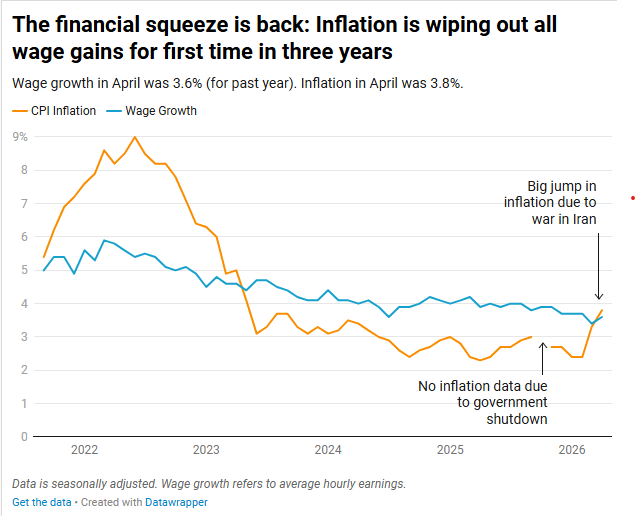
We led off today’s Commentary with a discussion of the headwinds facing fast food companies. The graph below indicates a major problem facing these restaurants. With yesterday’s higher-than-expected CPI, inflation is now rising faster than wage growth. Negative real wages will further limit consumers’ ability to eat out.
Lastly, we share commentary from Nick Timiraos of the Wall Street Journal, who shares a positive take on the data:
The optimistic story on inflation has been that the recent firming has been tariff-led (which would show up in goods) and therefore won’t be sustained as tariffs aren’t going to ratchet higher year after year.
Tweet of the Day
“Want to achieve better long-term success in managing your portfolio? Here are our 15-trading rules for managing market risks.”
Please subscribe to the daily commentary to receive these updates every morning before the opening bell.
If you found this blog useful, please send it to someone else, share it on social media, or contact us to set up a meeting.