


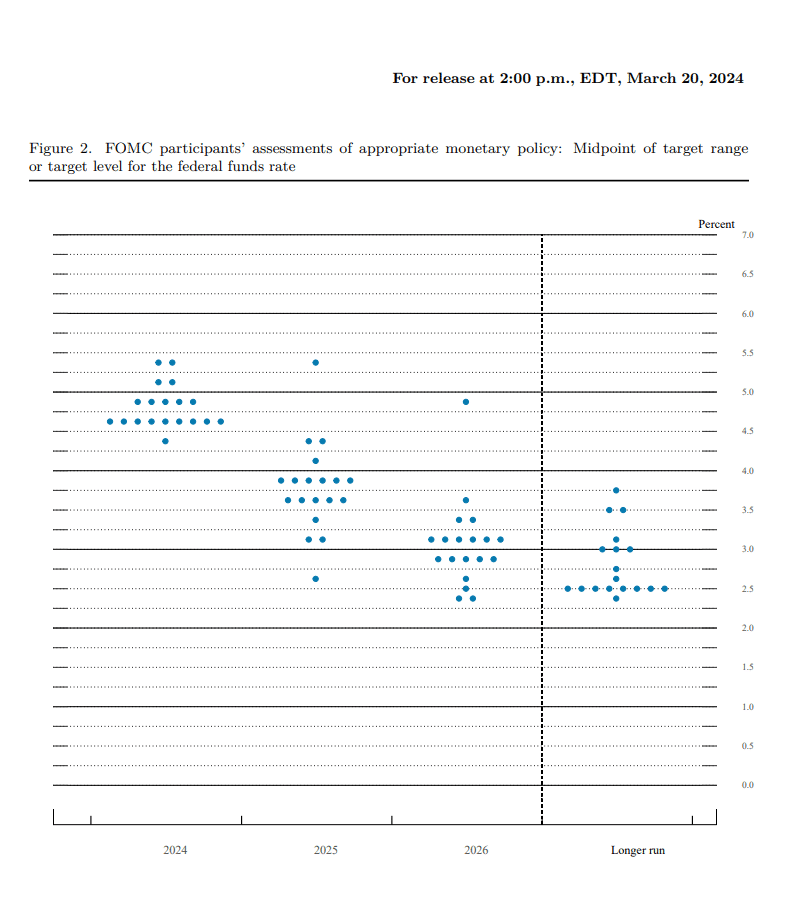
The last release of the Fed’s quarterly Summary of Economic Projections, aka dot plots, was in December. At the time, the median 2024 GDP projection of the 19 Fed members was a relatively slow 1.4% growth. Further, they expected PCE prices to decline to 2.4% by year-end. Both estimates were slightly lower than their September projections. Economic growth has been stronger than expected through the beginning of 2024, and inflation is sticky. The December dot plots projected that the Fed would cut rates 3x in 2024 (2 more than expected in September). No members thought they would raise rates. The markets were bullish on the forecasts. They interpreted them as the Fed would stay on hold until the spring and then cut rates as many as 6-7 times. Investors have since backed off their rate-cut estimates. Before yesterday’s FOMC meeting, investors aligned with the December dot plot Fed Funds expectation.
The new dot plots point to a more upbeat Fed than a few months ago. They raised their GDP forecast from 1.4% to 2.1%, and core PCE inflation rose 0.2% to 2.6%. Most importantly, the median Fed estimate still calls for three rate cuts in 2024 and three more in 2025. However, two of the nineteen members surveyed are predicting no cuts this year. One of them doesn’t foresee cuts in 2025, either.
The Fed minutes are virtually unchanged. Powell anticipates reducing the monthly amount of QT “fairly soon.” During the press conference, Powell affirmed that they are confident that lower market rents will show up in CPI prices and, as we have written, will lower inflation. Despite recent sticky inflation, they still think the overall story of inflation moving down to 2% “on a bumpy road” is still valid.
What To Watch Today
Earnings
Economy
Market Trading Update

Might The BOJ Rate Hike Signal A US Recession?
Yesterday’s Commentary touched on the historic rate increase by the BOJ and how it could impact global financial markets. To wit:
The BOJ policy shift has implications for global markets. For starters, Japan is one of the world’s largest exporters of capital. Low and negative interest rates have incentivized individuals, corporations, and pension funds to convert their yen to other currencies and buy much higher-yielding assets in other countries. Secondly, the so-called yen carry trade allows non-Japanese investors to borrow in yen, convert the yen to other currencies, and invest in other countries. This trade, estimated at $20 trillion, bolsters asset prices in the United States and around the world.
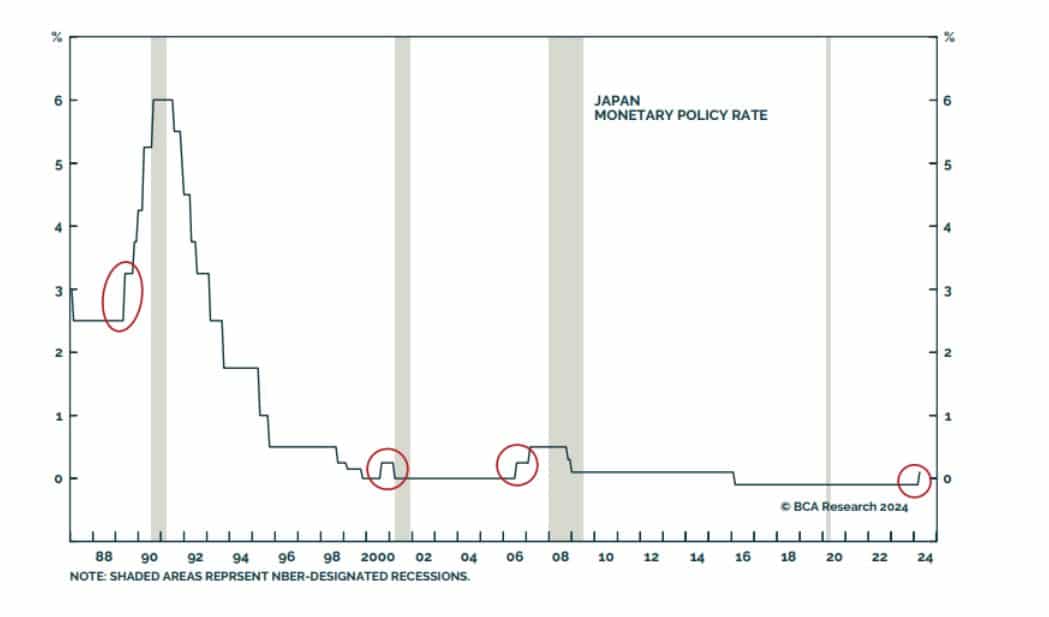
The following graph provides an interesting twist linking prior BOJ rate hikes with U.S. recessions. As the chart from BCA Research shows, the BOJ has hiked rates three times in the last 35 years before yesterday’s rate increase. Each rate hike was followed by a recession, regardless of how much or little they increased rates. The 2020 pandemic-related recession is the only outlier.
The Lag Effect Of Higher Interest Rates Is Hitting Households
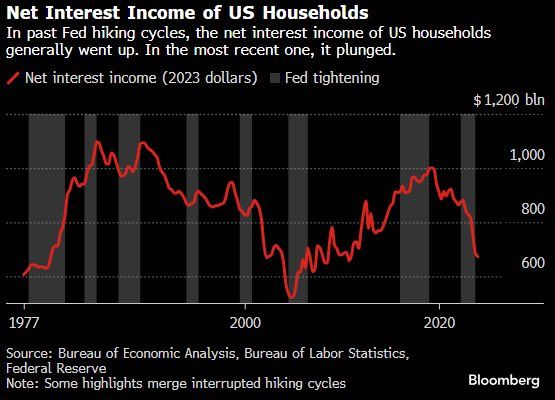
The following Bloomberg graph provides evidence that the rising interest rate cost to debtors offsets the benefits of higher interest rates for savers. Households’ total annual interest expense on their mortgages, credit cards, and other forms of debt has risen by nearly $420 billion since the Fed started hiking rates in 2022. Over the same two-year period, interest income was only $280 billion. As we wrote about in Bougie Broke, consumers are slowly running out of the means to keep up with above-average consumption. Further, any weakness in the labor markets would further weigh on personal consumption. Keep in mind that personal consumption represents about two-thirds of GDP.
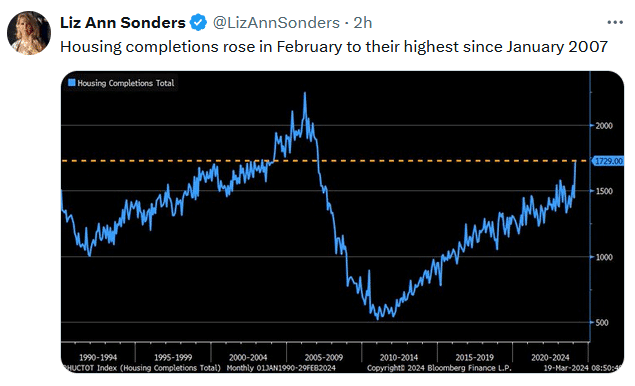
Tweet of the Day
“Want to have better long-term success in managing your portfolio? Here are our 15-trading rules for managing market risks.”
Please subscribe to the daily commentary to receive these updates every morning before the opening bell.
If you found this blog useful, please send it to someone else, share it on social media, or contact us to set up a meeting.
Post Views: 5
2024/03/21