


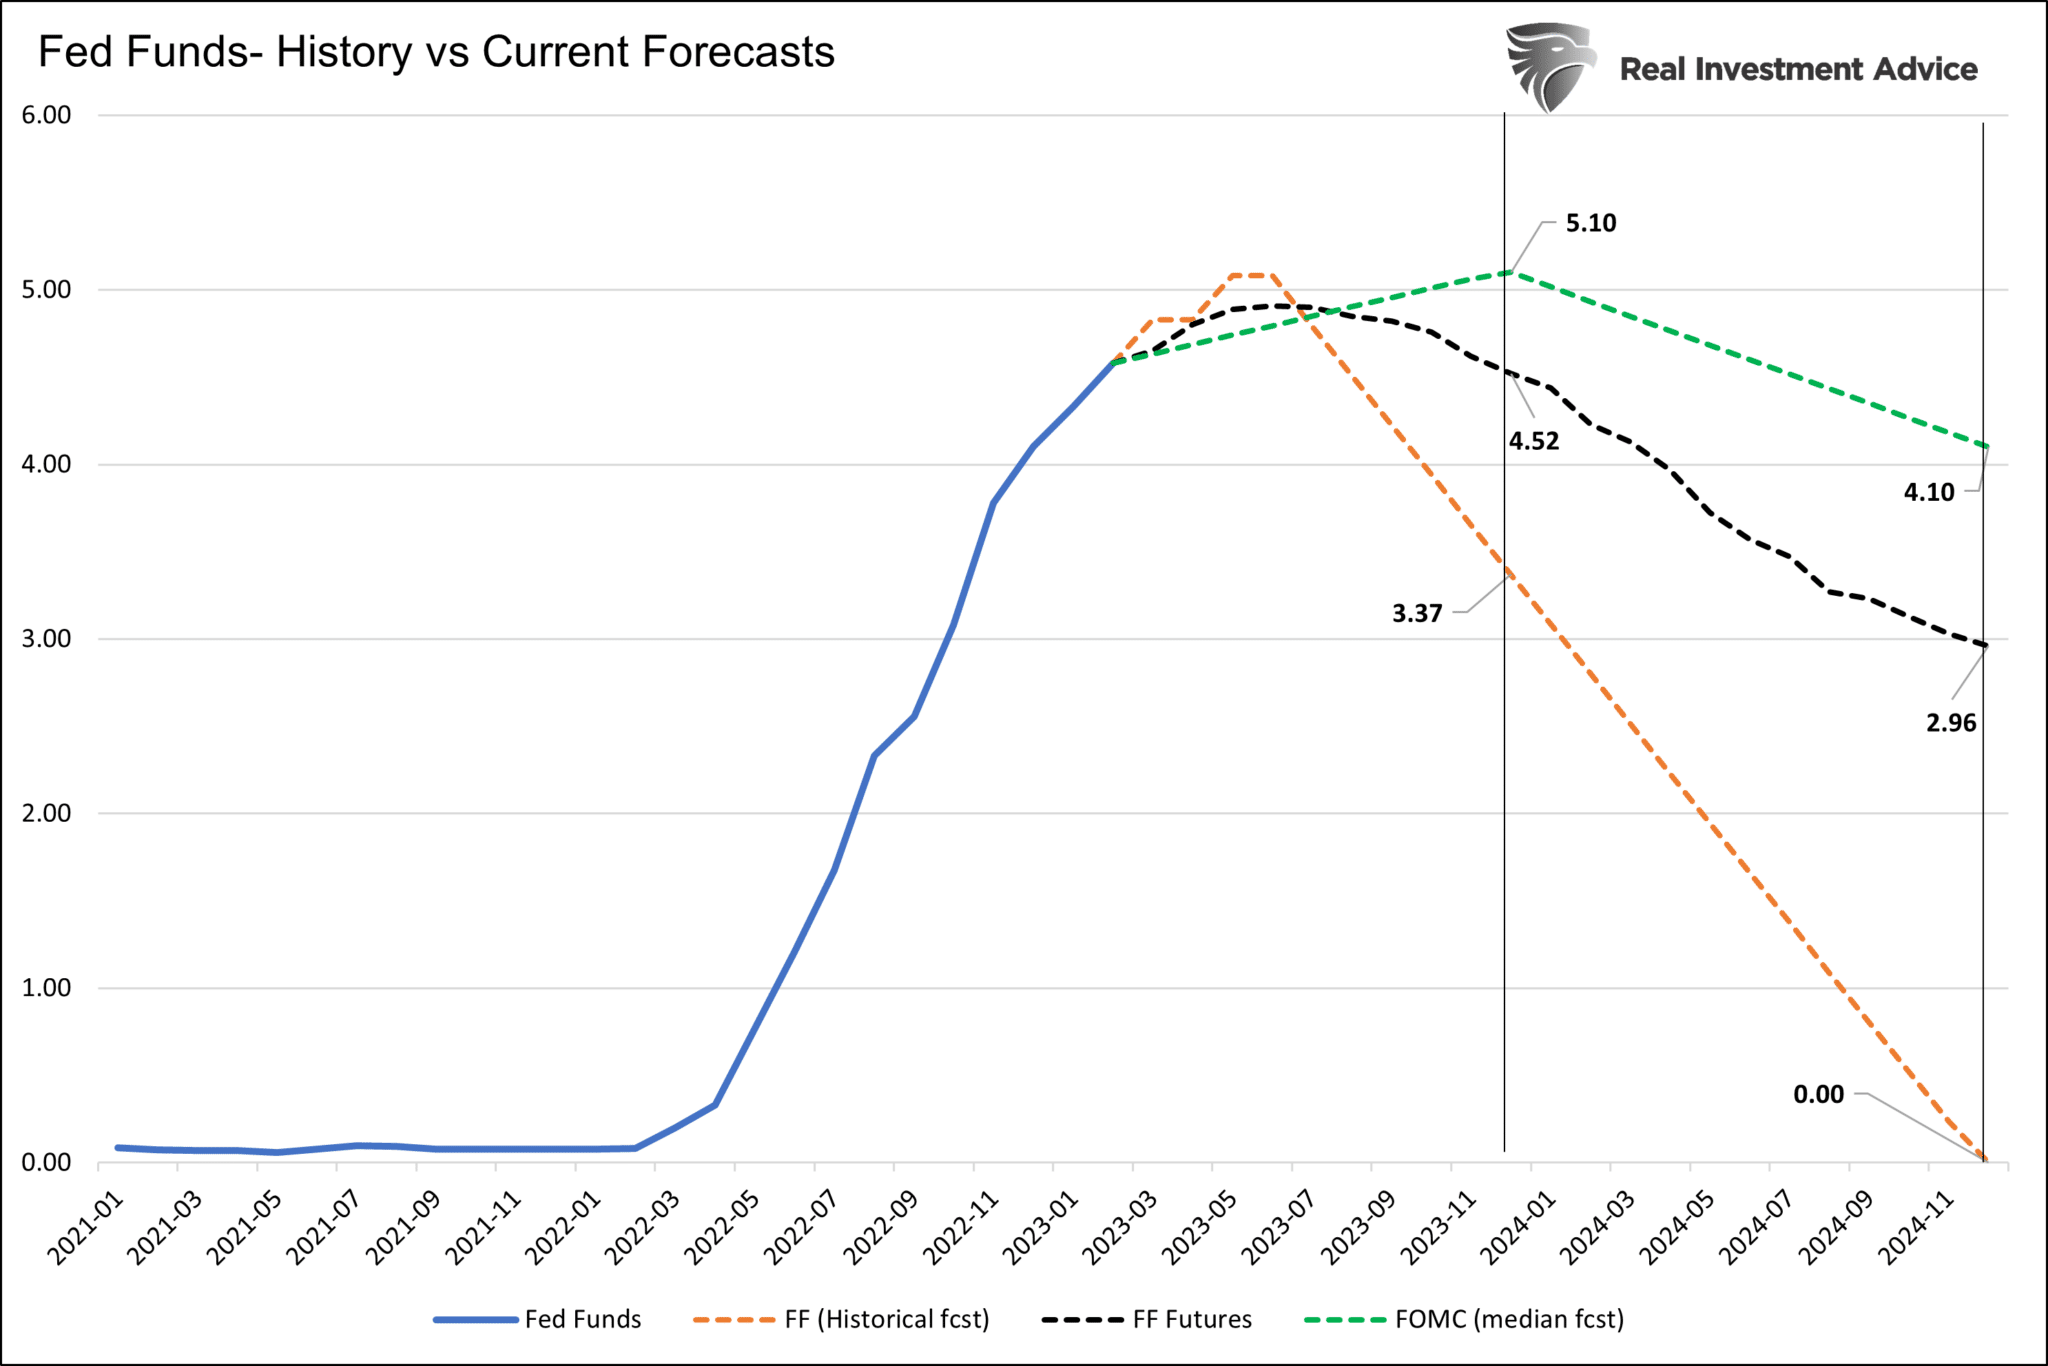
As we consider how the Fed might adjust the Fed Funds rate on Wednesday, it’s also worth contemplating various Fed Funds forecasts for this year and next. The graph below shows there is a decent gap in Fed Fund Forecasts between what the Fed projects (green), what the market implies (black), and historical observations of rate cuts (black). As time marches on, the Fed Funds forecasts will converge. Depending on which of the three forecasts, or any other paths, the markets may offer significant volatility as the Fed’s or investors’ outlooks adopt a new outlook.
The three Fed Funds forecasts shown below are based on the following:
- FOMC- The Fed’s 12/15/2022 median year-end Fed Fund forecasts
- FF Futures- Market implied rates based on Fed Funds futures
- FF Historical- Based on the last four recessions. On average, Fed Funds fell by 4.76% over 1.5 years, or 0.29% monthly.
What To Watch Today
Economy
- 10:30 a.m. ET: Dallas Fed Manufacturing Activity, January (-15.0 expected, -18.8 during prior month)
Earnings

Market Trading Update
Over the last few weeks, we repeatedly discussed the consolidation occurring in the market. The compression of prices between the downtrend line from the January 2022 peak and the rising lows since October was an important focal point for investors. Such is shown in the chart below.
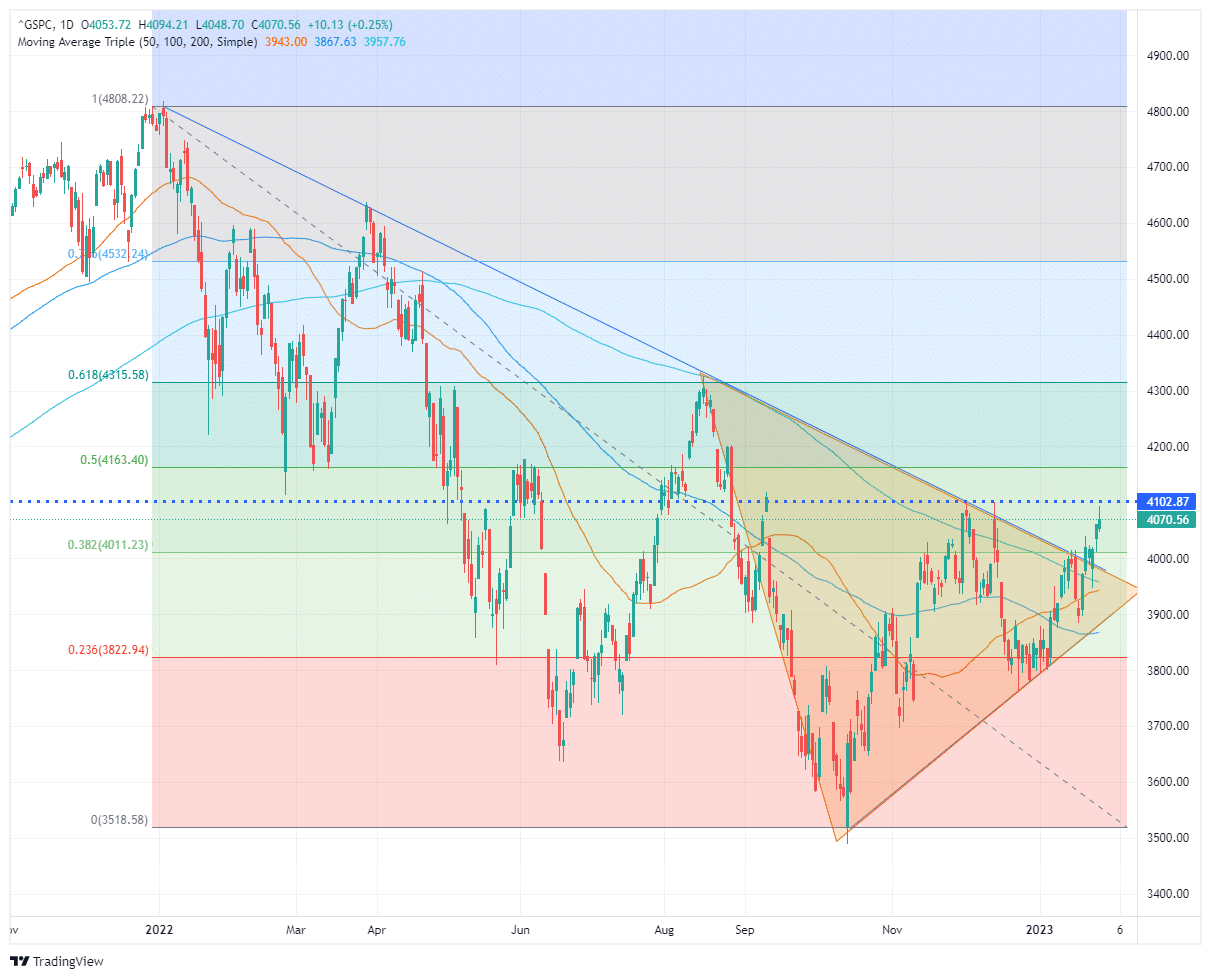
As you will note, since January’s market peak, each attempt to break above the falling downtrend line was a “head fake,” leading to lower prices. The good news is that, eventually, this cycle will end. At some point, the market will effectively “price in” the worst outcomes, and a break above the downtrend line will become sustainable. Such will confirm the beginning of a new bullish cycle for prices.
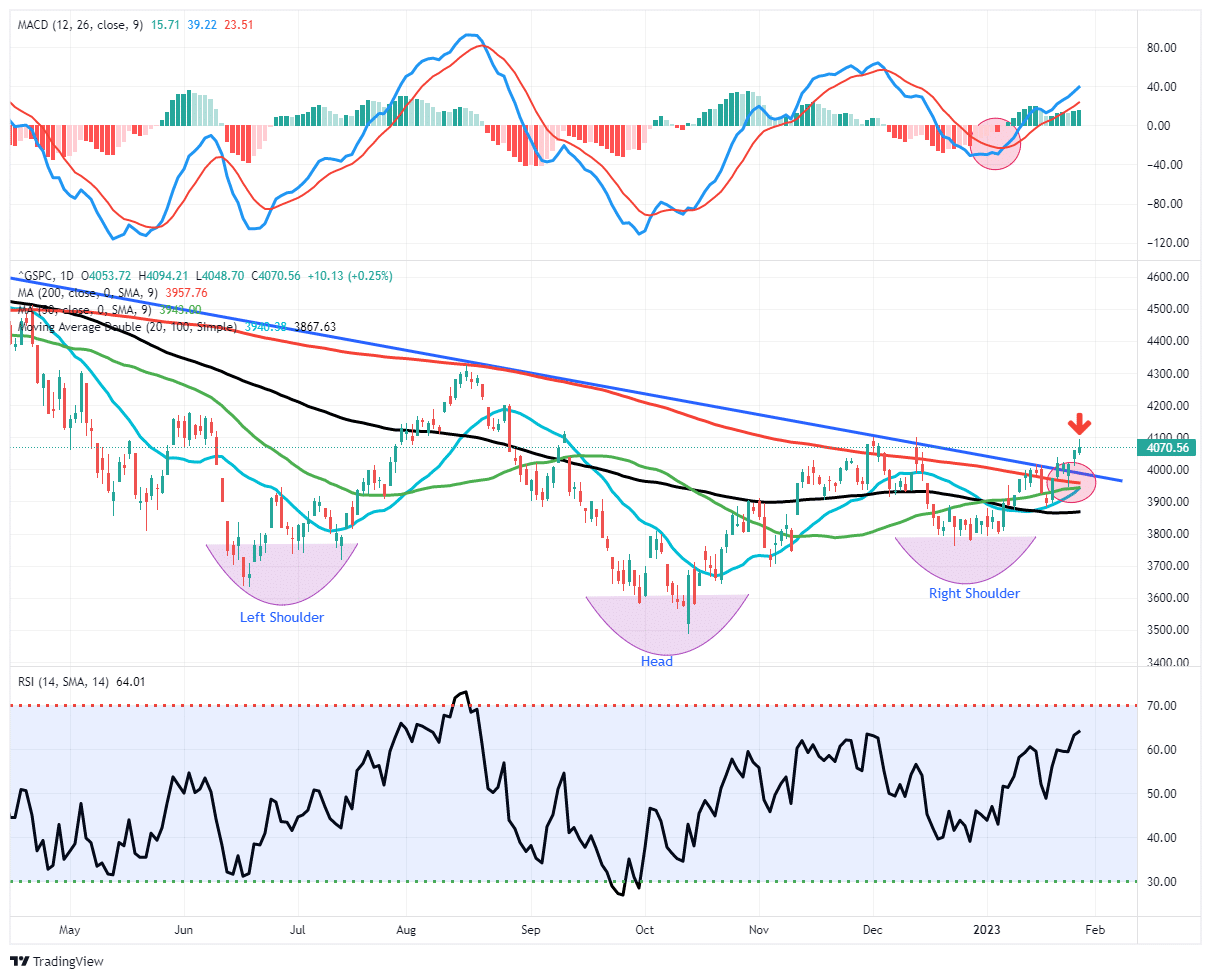
The evidence of a clear sustained break above the downtrend is not evident. That keeps the risk of a “head fake” high for now. But, as shown below, several technical improvements to the broad market are worth watching.
While the flow of economic news and media headlines are filled with stories of an impending recession, the market has been firming since October, suggesting a potentially different outcome. As we noted, the inverse “head-and-shoulder” pattern already suggests a market bottom has formed. A solid break above the downtrend line would confirm the completion of that pattern.
Furthermore, the market is not extremely overbought, and shorter-term moving averages are slopping positively. Notably, the 50-DMA is rapidly closing in on a cross above the declining 200-DMA. Such is known as the “golden cross” and historically signifies a more bullish setup for markets moving forward.
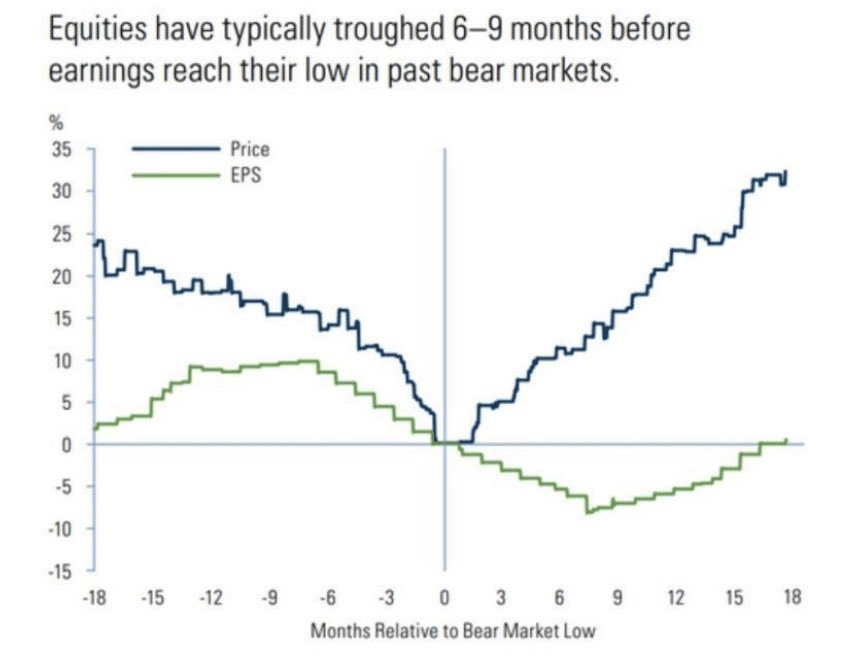
While it is possible that some bad news or an overly aggressive Fed could cause a “head fake” in the market short-term. Many of these bullish signals will complete in the months ahead. While that seems odd given the negative flow of economic and earnings data near term, historically, market prices tend to trough 6-9 months before earnings bottom. Such is because the market anticipates outcomes and was the subject of this week’s post on “Contrarianism.”
“As a contrarian investor, excesses get built when everyone is on the same side of the trade. Everyone is so bearish the markets could respond in a manner no one expects. This is why equities have historically bottomed between 6-to-9 months before the earnings trough.”
There are plenty of reasons to be very concerned about the market over the next few months. Given the market leads the economy, we must respect the market’s action today for potentially what it is telling us about tomorrow.
While this may be a “head fake” currently, I wouldn’t entirely dismiss the message of improving technicals either.
The Week Ahead
Between the Fed meeting on Wednesday, Unemployment on Friday, and a slew of earnings reports from many large companies, this will be a significant and possibly volatile week ahead for the markets.
At 2 pm ET on Wednesday, the Fed will likely increase the Fed Funds rate by 25bps. Following, at 2:30, Jerome Powell will answer questions from the press. The Fed will maintain its hawkish stance and remain vigilant against inflation. The bigger question is how the markets will interpret it. If the Fed lets on that they are more comfortable that inflation is peaking and falling, the markets may continue higher. However, if the Fed offers concern that tight labor markets, wage pressures, and financial conditions might keep inflation higher for longer, the bears may win the day.
JOLTS and ADP on Wednesday, along with the BLS employment report on Friday, will update the status of the labor markets. Based on recent initial jobless claims and continuing claims, it’s likely the data will continue to show a robust labor market. ISM manufacturing on Wednesday and services on Friday will provide a real-time look at sentiment among business leaders. ISM has proven to be a great leading economic indicator. Assuming it stays below 50, it will continue to signal a recession later this year.
Apple, Google, Amazon, Meta, Eli Lilly, McDonald’s, Shell, and a host of other large companies report earnings this week.
NBER Recession Factors
The NBER, not GDP, is the official determinant of recessions. Accordingly, we thought it might be insightful to understand which factors they prefer to use to help guide their decisions. In the NBER’s Business Cycle Dating guide, we found the following:
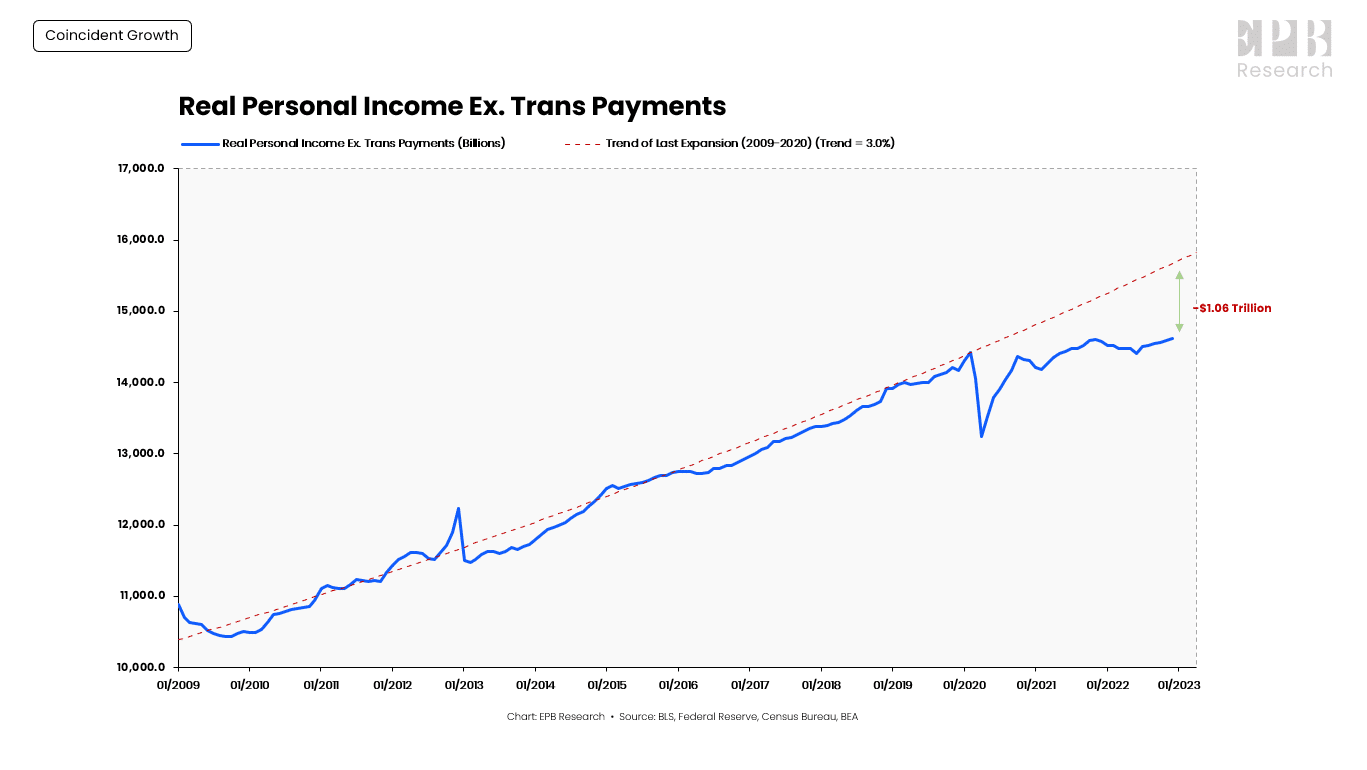
In recent decades, the two measures we have put the most weight on are real personal income less transfers and nonfarm payroll employment.
Of the data the NBER tracks, real personal Income (excluding government subsidies and inflation) and employment are significant. The employment market is still red hot and shows few signs of slowing down. However, as the EPB Research graph shows below, real personal income is well below the last decade’s trend and below levels of over a year ago. While far from enough evidence to call a recession, if employment and general economic activity decline, the threshold for an official recession designation may be closer than many think.

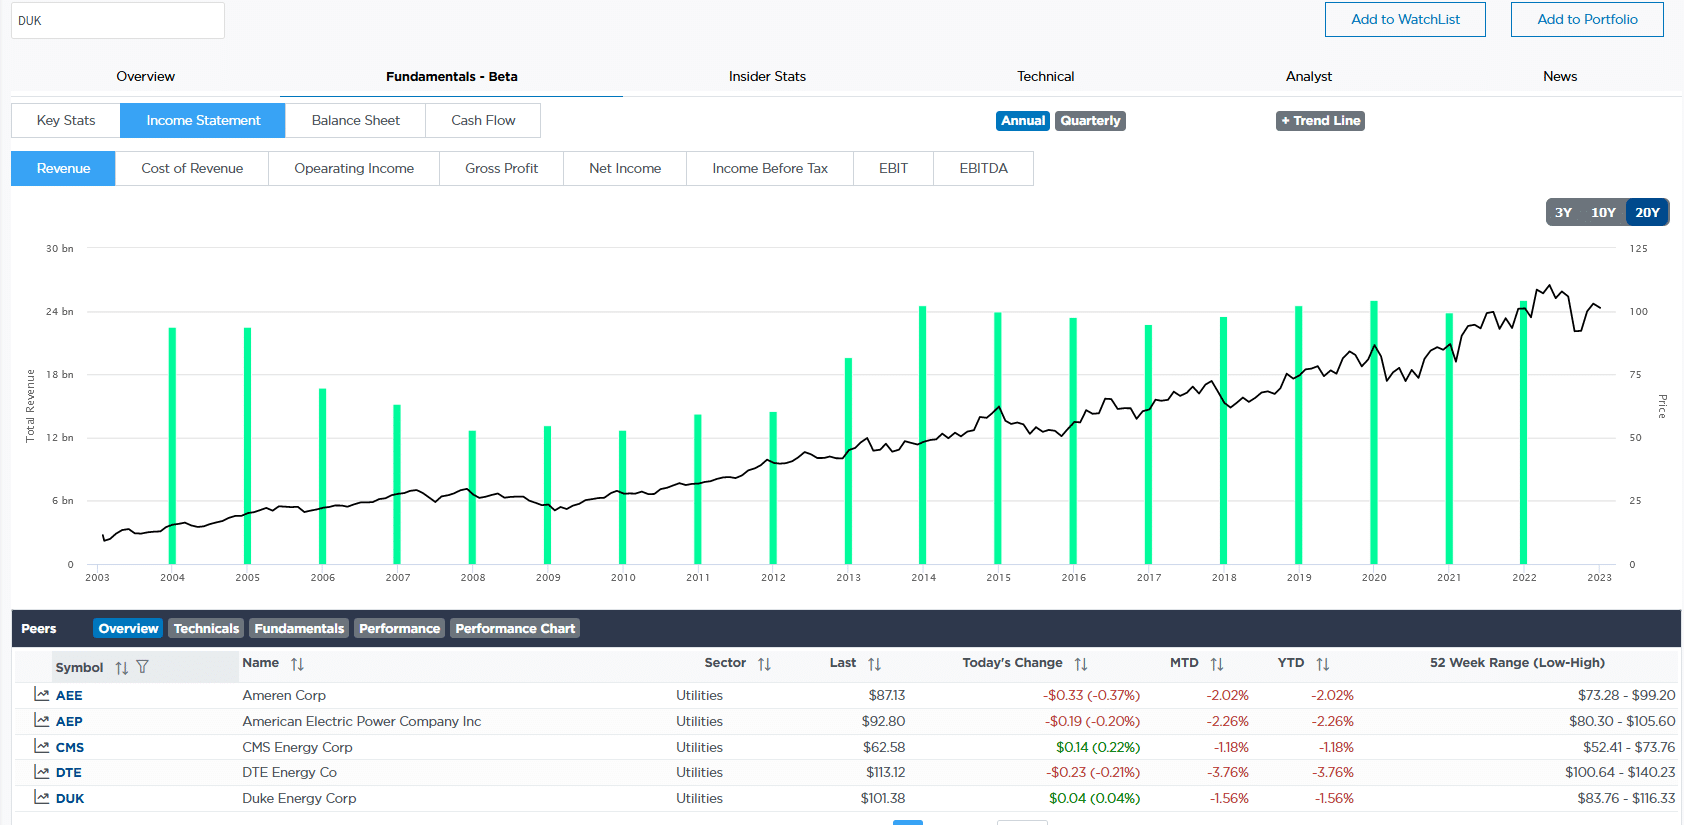
Enhanced Fundamentals
SimpleVisor has made a substantial enhancement allowing investors to chart fundamental data and their growth trends. The screenshot below shows users can chart various data from the income statement, balance sheet, and cash flow statement. The graph shows revenues for DUK for the last 20 years on an annual basis. Absolute and percentage growth trends can be applied to the graph. We will be adding valuations and financial ratios shortly.
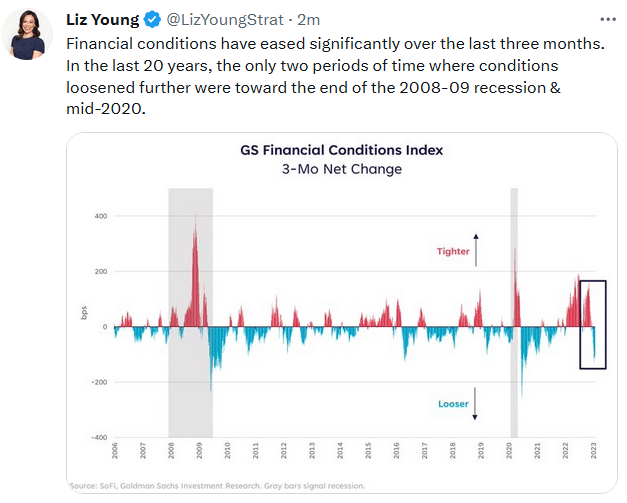
Tweet of the Day
Please subscribe to the daily commentary to receive these updates every morning before the opening bell.
If you found this blog useful, please send it to someone else, share it on social media, or contact us to set up a meeting.