


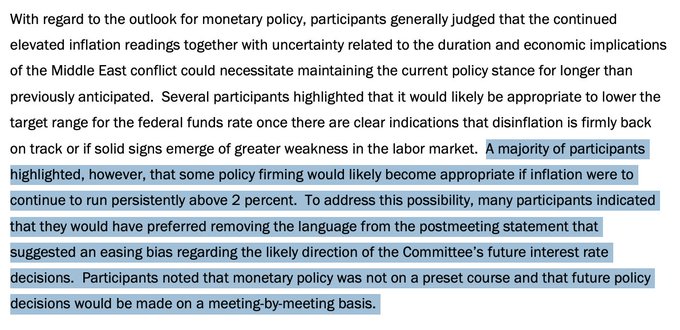
Last week’s release of the April FOMC minutes shows a growing push among the FOMC members to drop any indication of an easing bias. This has led the media to assume the Fed is more hawkish. Three weeks ago, at that meeting, three members dissented because they felt the language in the statement was biased toward easing. With the minutes released, we now know that there were more than three members with similar views but were unwilling to officially dissent at the meeting. Their chief concern is that inflationary pressures driven by tariffs, energy costs, and geopolitical risks in the Middle East could keep interest rates elevated for longer.
We think the Fed’s mindset is largely neutral, not necessarily hawkish, as the media and markets largely portray. Fed members are trying to assess how transitory the jump in energy and related costs is. Thus, given the volatile situation in Iran, which could end in peace within days or with missiles across the Middle East, most Fed members are not ready to be hawkish and hike rates or dovish and cut rates. As the minutes state in the last sentence below, “monetary policy was not on a preset course.”
The second graphic shows that the market believes the Fed has a slight hawkish bias. Fed Funds futures markets are pricing in a 72% probability that the Fed will hike rates at least once over the next year.

What To Watch Today
Earnings

Economy

Market Trading Update
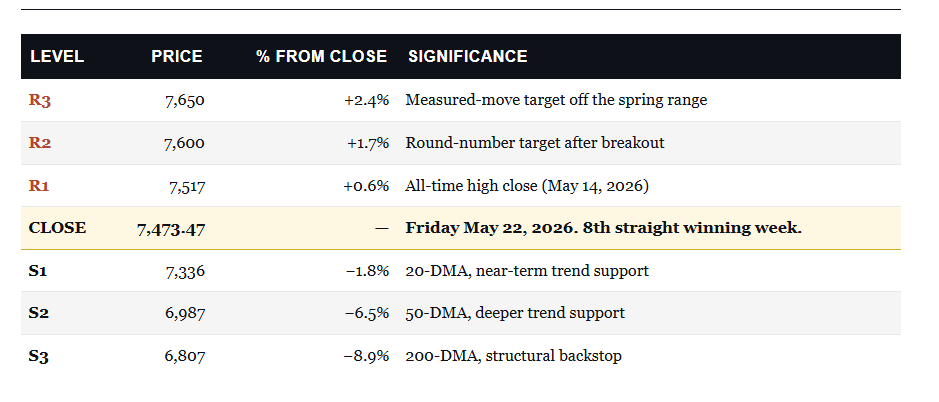
The S&P 500 closed Friday at 7,473.47, just 43 points and 0.6% below the May 14 all-time high of 7,517.12. The index put in an intraday high of 7,506.32 on Friday before fading slightly into the close. We’re now sitting comfortably above all three major moving averages, forming a textbook bullish setup. The 20-day sits at 7,336 (1.8% below price), the 50-day at 6,987 (6.5% below), and the 200-day at 6,807 (8.9% below). The bull trend is intact, momentum has improved, and the only thing standing between us and a fresh record is a clean breakout above 7,517.
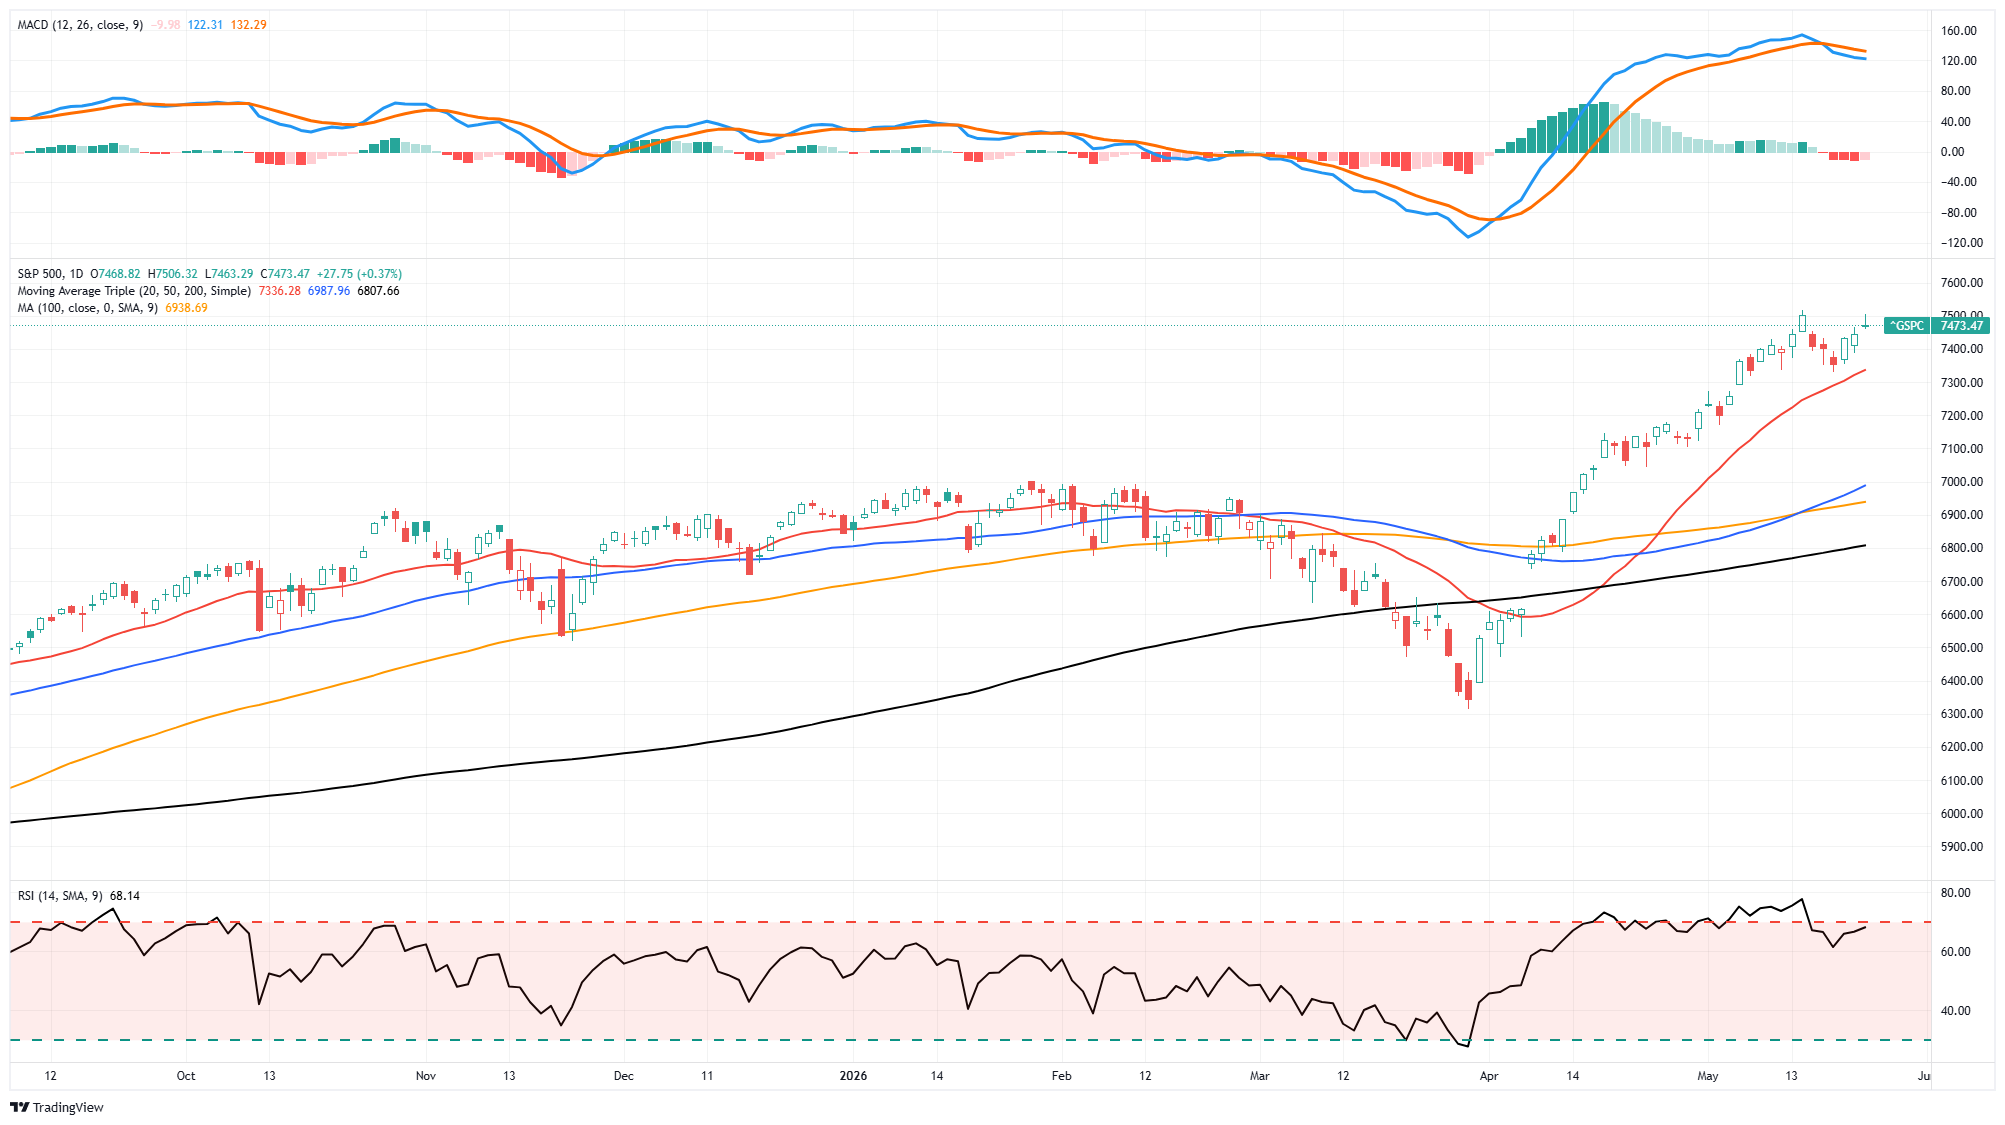
The 14-day RSI climbed to 68, up from 57 a week ago. That’s moving toward overbought, but not there yet. Historically, RSI readings between 60 and 70 during established uptrends produce more gains than losses. The acceleration in the MACD (momentum) indicator suggests a bit more risk, and the sell signal triggered last week remains intact. While that doesn’t mean the market will decline, the risk of a correction is increasing. Nonetheless, it does suggest that gains may be somewhat limited.
Breadth tells the same story but more cautiously. Roughly 55% of S&P 500 stocks now trade above their 200-day average, up from 53.7% midweek but still below the 70% reading from April. The Health Care rotation this past week was the first sign that breadth might be broadening. If that continues with Industrials and Financials catching a bid next week on any soft inflation print, the bull case strengthens substantially. If breadth narrows back to just the AI complex carrying the load, that’s the warning sign to watch.
For traders, the rules for next week are straightforward.
- A clean break above 7,517 with a daily close opens the path to 7,600 quickly.
- The next resistance after that sits near 7,650, a measured-move target off the spring trading range.
- On the downside, the 20-DMA at 7,336 is the first real test of the uptrend.
- A close below it that holds for more than 48 hours puts the 7,300 round number in play, then 7,200.
- Below those, the 50-DMA at 6,987 is the deeper trend test, and the 200-DMA at 6,807 is the structural backstop. Both of those would represent 6%-plus pullbacks from Friday’s close, which we’d consider buying opportunities rather than regime changes.
The most important signal from the technicals right now is resilience. The market closed Friday just below record highs despite the 30-year yield touching a near-two-decade high earlier in the week. It did so despite the Fed Chair transition that same morning. That kind of resilience does not happen by accident. It happens when underlying earnings strength and liquidity conditions are firm enough to absorb meaningful macro stress.
Next week, watch the 30-year and 10-year yields first thing Tuesday morning. If long rates resume falling with PCE on deck Friday, equities are set up well for another leg higher. If yields back up on any inflation surprise, the 7,336 20-DMA becomes the first real test of whether the eighth winning week was the top or just a pause.

The Week Ahead
This holiday-shortened week should be quiet on the economic and earnings front. The economic highlight will be the PCE inflation data on Wednesday. Currently, the consensus is for core PCE to increase by 0.4% and headline PCE to rise by 0.7%. The second revision of the first-quarter GDP will also be released that day. The expectation is for an increase from the originally posted +0.5%.
Given the lack of earnings reports from major companies and limited economic data, Iran-related headlines will most likely be the predominant driver of markets.
Rising Interest Rates: Why The Narrative Fails Against The Data
Last Friday closed with the 10-year Treasury yield at 4.60%, a one-year high, and the doom commentary about rising interest rates was waiting before the bell even rang. Hyperinflation. Bond market breakdown. Paradigm shift. A 1981 fair-value retest. The Fed is about to “push the brrrr button” or pop “the everything bubble.” If you spent any time on social media over the weekend that followed, you saw a version of every one of those.
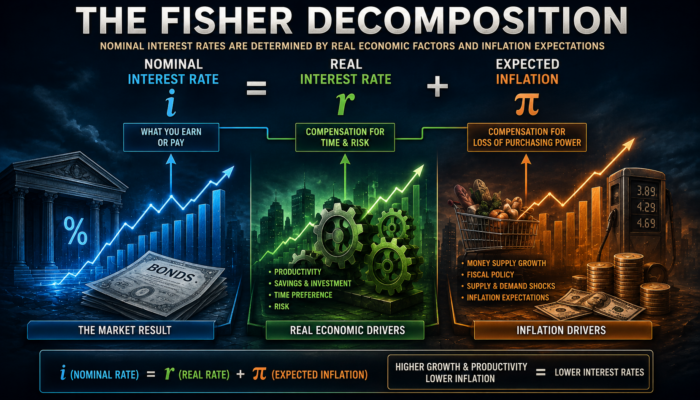
So I posted a short thread that Friday, making a simple point. Over time, yields track growth and inflation. The chart that drew the strongest pushback roughly showed that relationship, and a wave of responses argued that the framework is broken, debt is about to break the bond market, supply-side inflation has changed everything, and rates have nowhere to go but higher.
However, let’s slow down and look at what the data actually says. Some of those critiques are weak. A few are partially right. And one of them deserves a serious answer. I’ll work through them in order. After 30 years of watching market cycles, the pattern in this setup is more familiar than most commentary suggests.
Tweet of the Day
“Want to achieve better long-term success in managing your portfolio? Here are our 15-trading rules for managing market risks.”
Please subscribe to the daily commentary to receive these updates every morning before the opening bell.
If you found this blog useful, please send it to someone else, share it on social media, or contact us to set up a meeting.