


This week’s Five for Friday introduces SimpleVisor’s new Relative Analysis of Sectors. Within SimpleVisor, the analysis can be found under Ideas in the “Relative Analysis – Sectors” section.
The tool uses the price ratio of each sector to the S&P 500 to create a baseline for technical analysis.
As shown below, each of the 12 S&P 500 sectors is scored and color-coded based on how overbought (red) or oversold (green) they are relative to the S&P 500. A score of +1 is the most overbought a sector can get, while -1 is the most oversold.
Below, we show that the Energy and Utilities sectors are the most overbought sectors, while Communications are the most oversold. The other sectors in gray are close to fair value.
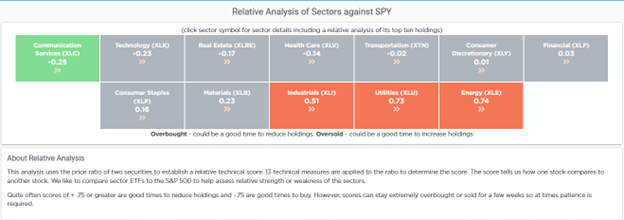
In this article, we highlight the Utilities sector to show how this tool provides relative technical analysis of the sectors and the most prominent companies within the sectors.
Utilities
As shown above, Utilities are very overbought versus the S&P 500 with a score of +.73. Often, a score of +.75 or higher is a good time to sell or reduce holdings in favor of the S&P 500 or other sectors. By clicking on the Utilities box, we receive more detail on the sector ETF and how its underlying stocks score versus each other and the ETF itself.
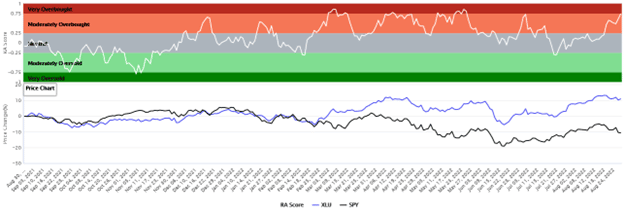
The graph below provides a one-year history of the relative score of XLU vs. SPY and the performance of each. Utilities have been overbought for a good part of the year. Not surprisingly, as the lower portion of the graph shows, XLU has held up well for the last year, while SPY is down about 10%. Remember that while XLU is overbought on a relative basis, it can stay at highly overbought levels for a few weeks.
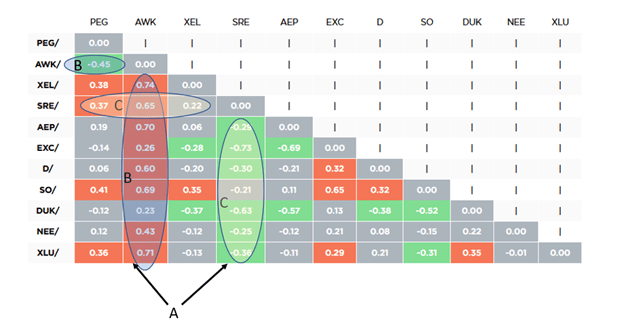
The following table provides guidance on which stocks within the sector are overbought and oversold versus the ETF and each other.
Reading the bottom row (XLU/) across tells you how overbought (red) or oversold (green) XLU is versus each of its top ten holdings. Mousing over each box will give details.
Here is how we might use the table above to help guide our investment process.
For starters, of the ten stocks, XLU is the most overbought (0.71) against AWK and the most oversold versus SRE (-0.36). These are both labeled A above.
Reading across the second row, AWK is moderately oversold against PEG (-.45). Simultaneously, the other nine stocks are all overbought versus AWK. Both instances are circled and labeled B. This may be a bit confusing as the relationship changes reading horizontally versus vertically. When reading from the y-axis horizontally, the relationship is directly as advertised. When reading from the x-axis vertically, the relationship is inverse. The price of AWK versus PEG is oversold. For the rest of the stocks, the relationship is the opposite. It is the other stocks versus AWK.
XEL is the most overbought (.74) versus AWK and DUK is the least overbought versus AWK (0.23).
While AWK is the model’s most oversold stock, SRE is the most overbought. XLU is the most oversold versus SRE (-0.36). SRE is also overbought versus all nine stocks as circled and labeled C.
Trading the Table
Before describing how we might use the table, it’s worth disclaiming that we use a wide array of technical and fundamental analyses in addition to this analysis to make investment decisions.
Utilities have generally outperformed when the broader market has been weak and underperformed when it rallies. If we think the S&P 500 will rebound from recent selling, we should expect XLU to move from overbought to oversold on a relative basis. In such a case, we might want to trim utilities in favor of a sector that’s currently oversold versus the S&P 500, like XLC or XLK.
Instead of reducing our utility holdings, we could also rotate within the utility sector. For instance, we may want to sell SRE or other holdings to buy the most oversold stock, AWK.
Disclosure
This report is not a recommendation to buy or sell the named securities. We intend to elicit ideas about stocks meeting specific criteria and investment themes. Please read our disclosures carefully and do your own research before investing.


Michael Lebowitz, CFA is an Investment Analyst and Portfolio Manager for RIA Advisors. specializing in macroeconomic research, valuations, asset allocation, and risk management. RIA Contributing Editor and Research Director. CFA is an Investment Analyst and Portfolio Manager; Co-founder of 720 Global Research.
Follow Michael on Twitter or go to 720global.com for more research and analysis.
Customer Relationship Summary (Form CRS)