


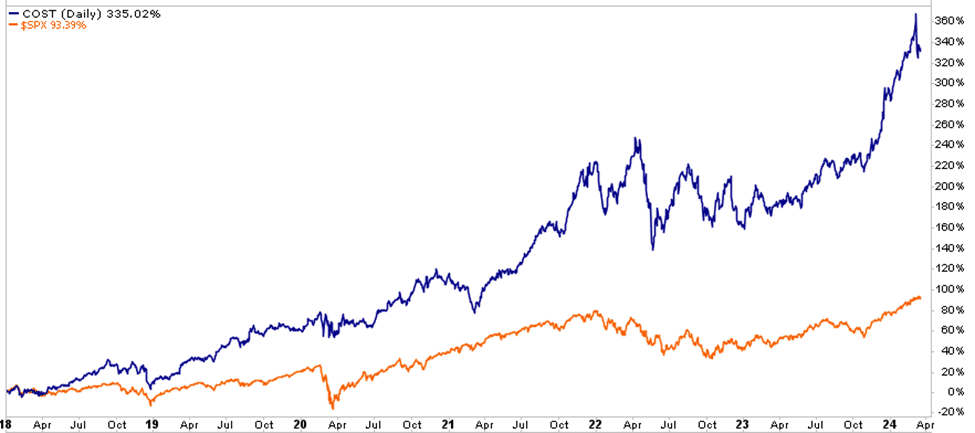
COST has been one of our most consistent holdings over the last few years. Currently, we have a 3.75% allocation to the stock in our equity model. The graph below, comparing COST to the S&P 500, shows our decision has served us well. However, given its recent run-up, it’s worth reviewing COST to assess whether the market is overconfident in the company’s future earnings potential.
Like its stores, its stock has a cult-like following. Consumers see value in their offerings and customer-friendly approach. Likewise, investors recognize COST’s advantages over other retail stores and are willing to pay higher valuations for them.
Valuations
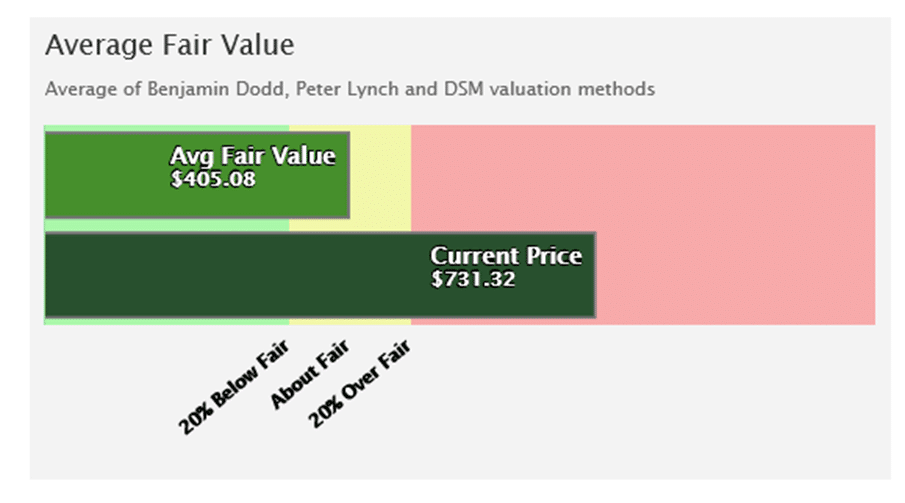
COST is not a cheap stock. The first graphic below shows that the price is well above its average fair value using three well-followed measurements.
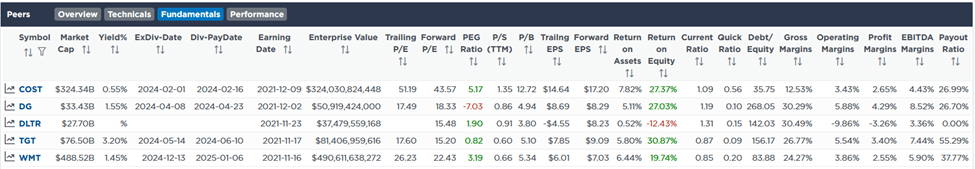
The second table shows COST has a P/E of 51.19, which is above its nearest two competitors, TGT (17.60) and WMT (26.23). One could argue COST investors are betting on much faster growth to justify the valuation differential. Such may not be the case. The PEG ratio, which normalizes the P/E to expected growth, is much higher for COST than WMT and TGT. P/S and P/B show a similar overvaluation. Its P/S is the highest in 20 years and greater than 50% higher than its long-term average. COST has not repurchased its shares to any meaningful degree. WMT and TGT have been buying back their shares. As we have recently written, share buybacks can skew valuations higher than they should be. COST has a strong record of steadily increasing dividends over the last 20 years.
Fundamental
Also, within the table above, note that margins for COST versus WMT and TGT are on par with each other, as are their return on assets and equity calculations. However, COST has much less debt than the other two competitors. If interest rates stay high, that may prove to be a sizeable competitive advantage.
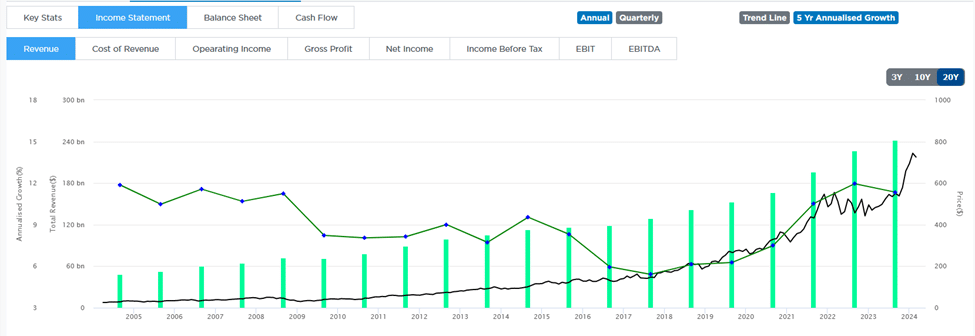
The first graph below shows its revenue has grown over 10% annually over the last five years and has grown considerably over the previous 20 years. Revenue growth for its two competitors mentioned above has been in the mid-single digits.
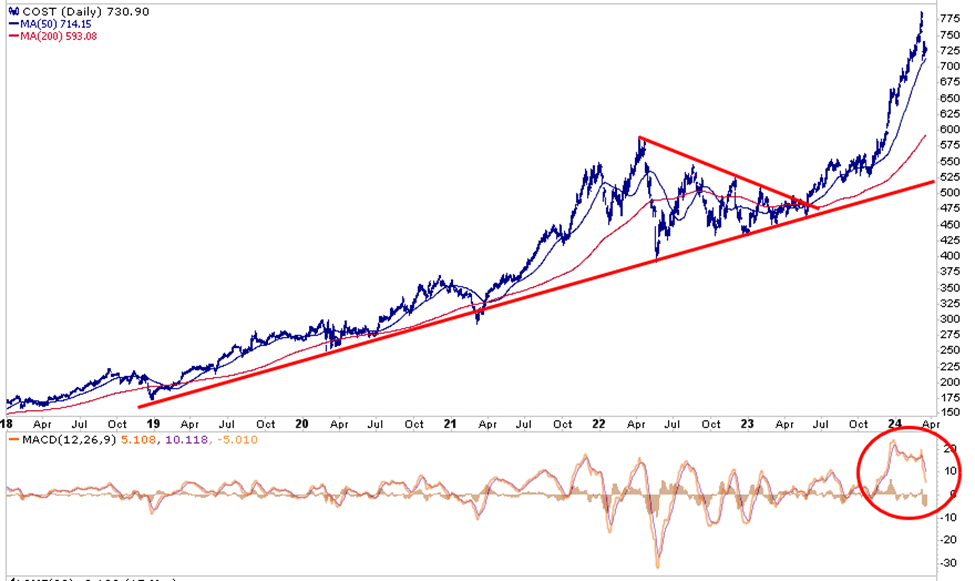
Technical
The stock has been on a tear for the last six months after breaking out of a two-year consolidation. While COST will take its cue from the broader market and could continue upward in sync with the market, it may likely consolidate again or retreat toward its trend. The MACD circled in the lower graph is extended but is in the process of normalizing. The support line (red) offers valuable support for the stock. That level would be a great buying opportunity, all things being equal.
Disclosure
This report is not a recommendation to buy or sell the named securities. We intend to elicit ideas about stocks meeting specific criteria and investment themes. Please read our disclosures carefully and do your own research before investing.