


On Monday, we released a new version of SimpleVisor. The following day’s Daily Commentary, accessible under Insights- Commentaries, shared some thoughts on recent market trends and sector/factor rotations. Part of it included an interesting analysis of the current best-performing sector, utilities.
To help you better understand how to use SimpleVisor to find stocks, we will devote this week’s Friday Favorites to scanning the utility sector.
DIY Research
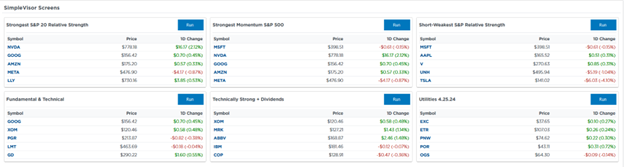
Many SimpleVisor analysis tools are housed in the DIY Research tab. For this analysis, we start with the Screener sub-tab.
When you first enter the page, you will see it’s divided into SimpleVisor Screens and below it, “My Screens.” We created SimpleVisor screens for your use. The Utilities 4.25.24 scan was created for this article and will show up in the SimpleVisor screens.
The My Screens section has the screens you created and saved. This is also where you can create a new screen. To start a screen, click on “+ New Screen.” Then click “Add more filters,” and you can start selecting technical and fundamental measures to help arrive at a roster of stocks that meets your criteria. We find it helpful to click “Run Screen” after adding new filters to update the list of stocks that meet the screen’s qualifications.
The Utility Screen
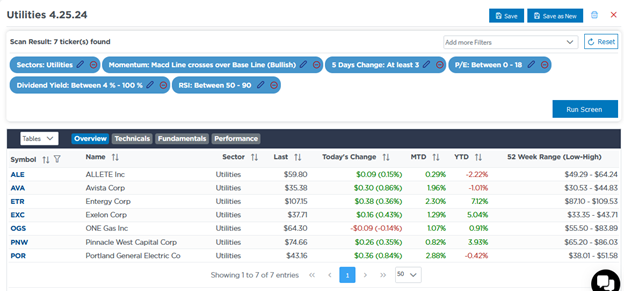
Our Utilities 4.25.24 screen started by whittling down the population of all stocks to just those in the Utility sector. We then added three technical screens, including the MACD above zero, a five-day change of at least 3%, and an RSI greater than 50. We also include a P/E <18 and a dividend yield greater than 4%. The graphic below shows the seven utility stocks that met the criteria.
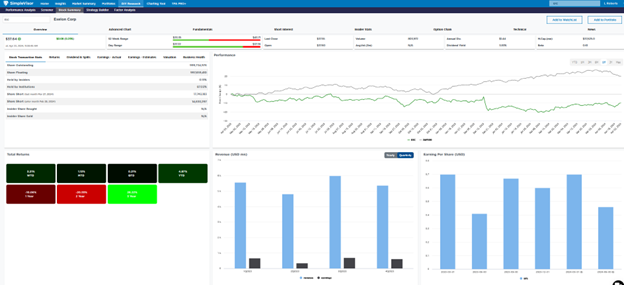
With the seven stocks in hand, we can research the individual stocks. A plethora of data, as shown below, pops up when clicking on the tickers in the screen results.
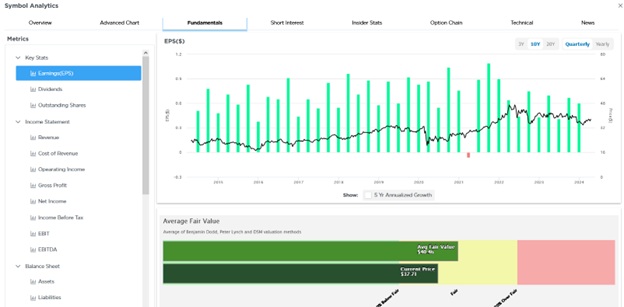
For example, the Fundamental tab allows you to graph 26 items from the company’s balance sheet and income statements. The second graphic charts the EPS for EXC. Below the graph is a fair value price based on the average of three widely used valuation methods. EXC is trading about 10% below fair value in this case.
Charting Tool
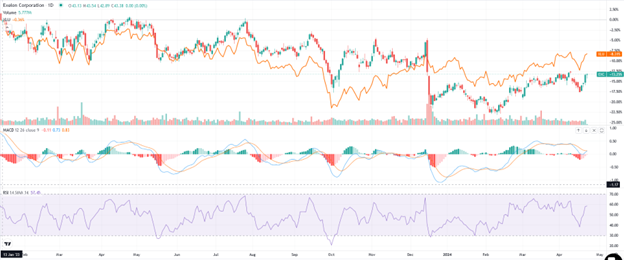
If you find a stock you are interested in, you may also find it valuable to graph it. The Charting Tool provides users with many technical studies to apply to the stock’s graph. The example below shows the price of EXC and the utility sector ETF XLU.
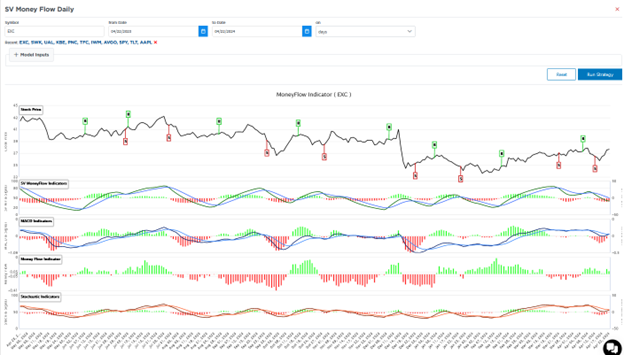
Below it are the MACD and RSI. If you seek further technical analysis, Strategy Builder in DIY Research has more technical studies on the stock’s price and, if you like, on the ratio of the stock’s price to another ETF or stock. Use Strategy Builder to create buy and sell rules to help assess when your technical triggers may warrant a trade. The second graph shows the single stock analysis on EXC. The top graph shows the Buy and Sell signals from our proprietary Money Flow signal strategy.
Summary
We hope you enjoy the new version of SimpleVisor and discover the many tools it offers investors. Please let us know if you have any comments or suggestions.
While working on the latest version, we accumulated a bunch of new ideas that we hope to make available soon. Stay tuned!
Disclosure
This report is not a recommendation to buy or sell the named securities. We intend to elicit ideas about stocks meeting specific criteria and investment themes. Please read our disclosures carefully and do your own research before investing.


Michael Lebowitz, CFA is an Investment Analyst and Portfolio Manager for RIA Advisors. specializing in macroeconomic research, valuations, asset allocation, and risk management. RIA Contributing Editor and Research Director. CFA is an Investment Analyst and Portfolio Manager; Co-founder of 720 Global Research.
Follow Michael on Twitter or go to 720global.com for more research and analysis.
Customer Relationship Summary (Form CRS)