


Proctor & Gamble (PG)
Proctor & Gamble is a branded consumer packaged goods company that operates worldwide through five segments: Beauty, Grooming, Health Care, Fabric/Home Care, and Baby, Feminine, and Family Care. With a market cap of roughly $375 billion, it’s the largest component of the consumer staples sector ETF, XLP. We hold PG in our Equity model but recently reduced our position to take profits.
Fundamental
Revenue has grown at an annualized rate of roughly 4.2% over the last five years, while EPS has grown at an annualized rate of 8.3%. The difference is due to an increase in operating margins, which have risen by 3% over that period. Furthermore, share buybacks are also fueling the outsized growth in EPS.
Long Term Debt-to Equity of 48.1% has remained steady in the post-pandemic period after steadily increasing from 2015 to 2019.
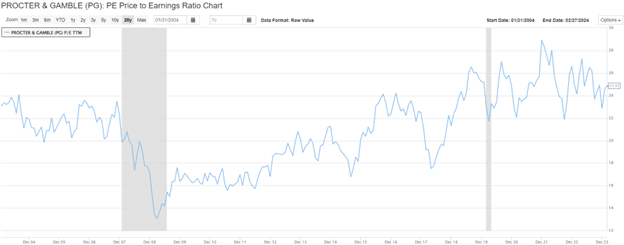
PG is a steady, slow-growing company with mature products and a secure market share in many of its essential products. As such, valuations and buybacks are critical to forging an outlook for PG. Throughout the post-pandemic period, the P/E ratio of PG has fluctuated between 22 and 29. It’s currently trading near the middle of that range at 24.9. However, pre-pandemic, the range was 18 to 26. Its price-to-sales ratio is also elevated versus pre-pandemic levels. The stock is expensive, but continued share buybacks partially justify the valuations.
For more on how buybacks can skew valuations, please read our latest article – Apple’s Magic.
Technical
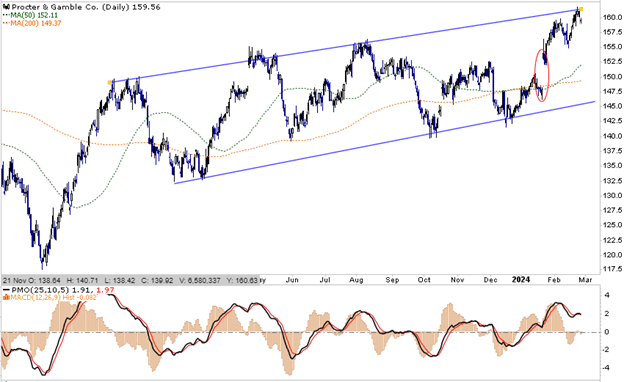
As shown below in the first (daily) chart, PG has been forming a bullish series of higher highs and higher lows since the second quarter of 2023. It recently found resistance at the top of the uptrend and may look to fill the recent gap-up (circled in red) before continuing its advance. Thus, a correction to find support at the 200-dma level would not be surprising, but the stock may correct further to the lower trend line shown below.
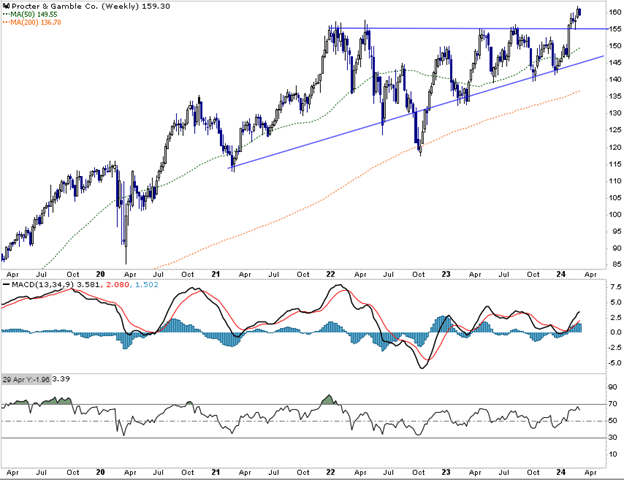
The second (weekly) chart below argues that the stock may be in for a more minor correction than suggested by the daily chart. PG recently broke out of an ascending triangle pattern that has been developing since 2022. It briefly established support at the previous resistance line, but another test of support near $155 would not be surprising. If support is again established, look for a continuation of the stock’s rally.
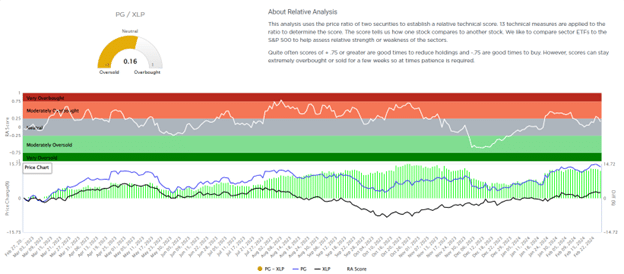
The final graphic shows its SimpleVisor relative score versus XLP, which is now .16. It is fluctuating between neutral and overbought territory, which gives the stock plenty of room for further advancement on a relative basis versus the sector ETF.
Disclosure
This report is not a recommendation to buy or sell the named securities. We intend to elicit ideas about stocks meeting specific criteria and investment themes. Please read our disclosures carefully and do your own research before investing.