


As we wrote in our last Five for Friday of 2023, we are changing the format of this weekly report. From now on, we will spotlight a stock, sector, factor, or theme each week. The content may vary from a fundamental to a technical deep dive on a stock of interest, or as we do in our initial report, both. On occasion, we may run a scan or address a reader’s request.
RTX
RTX Corporation, formally known as Raytheon, is a large aerospace company and defense contractor. Our Equity models currently have a long position in RTX.
Recent Trouble
In Mid-2023, RTX declined nearly 20% after announcing they discovered a flaw in the Pratt Whitney airplane engine manufacturing process. They initially estimated they would need to ground and inspect up to 700 Pratt Whitney engines, making repairs as deemed necessary.
In September, they revised their guidance after further investigation of the problem. The initial estimate that it would take 60 days to inspect and repair each engine was increased to 300 days. Further, they revealed the number of engines needing inspection could be nearly 3,000. The total estimated cost rose to $3 billion, and the stock fell another 20% as a result. RTX also revealed that most of the estimated costs would be compensation paid to customers for lost profits while aircraft are grounded.
In September, following the update, RTX stock bottomed out at $68, down nearly 35% from its record high set in April 2023. Since then, it has recovered almost half of its losses. This is partly due to investor confidence that RTX is aggressively handling the problem and reigning in total costs. RTX took a $3 billion one-time charge to its earnings to cover the estimated costs. If all goes according to their forecast, the cost to inspect and repair engines will not have a material impact on future earnings.
$3 billion is a hefty hit to RTX’s bottom line, but consider that it had a market cap of $150 billion at its April peak. A $3 billion one-time charge was not commensurate with the $50 billion hit to RTX’s market cap at its lows. Further, EBITDA has been running close to $12 billion a year. $3 billion only represents a quarter’s worth of earnings.
From a ten-year present value perspective, we estimate the $3 billion loss should reduce its market cap by roughly 3%
Technical
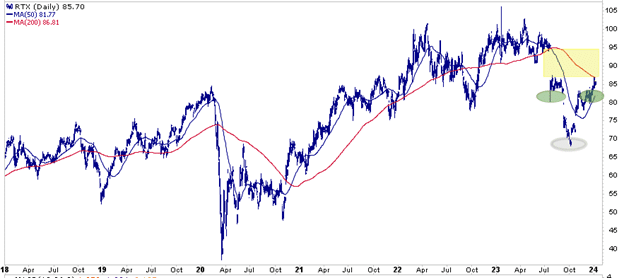
The first graph shows the trading activity surrounding the situation discussed above. RTX gapped lower on the original announcement and again after the revision. It then started to recover. In its wake is an island bottom, inverse head and shoulders pattern, and an unfilled gap (yellow) between 85 and 95. All three are technically bullish and argue the shares could get back to prior highs.
Also worth highlighting, the 50-day moving average is quickly approaching the 200-day moving average. A cross of the 50-dma above the 200-dma, as we suspect will occur, is bullish.
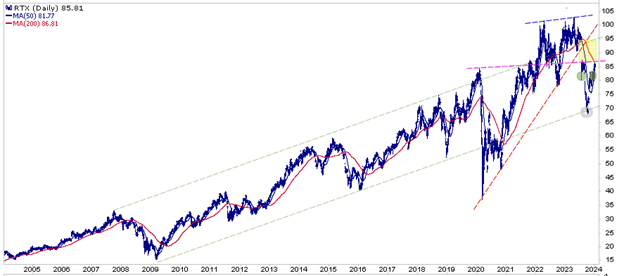
The second graph is longer term and thus offers a broader perspective. The green lines represent the channel it has traded in for the last 20 years. RTX is hitting the pink resistance level. Such may result in a period of consolidation. A break above it is bullish and further increases the possibility of new highs in the near term.
Fundamental
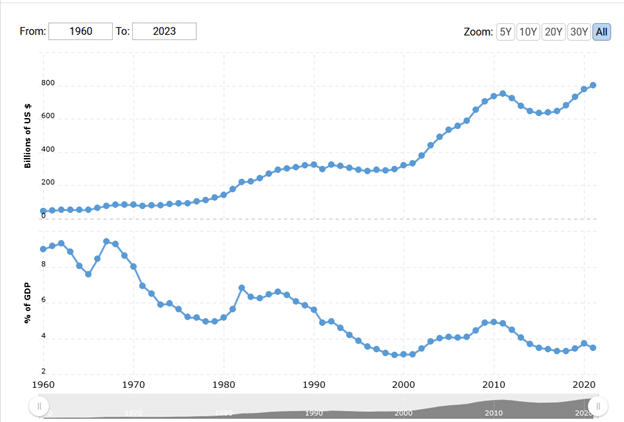
Before reviewing RTX valuations and fundamental data, it’s worth noting that the Ukraine and Middle East wars benefit RTX. Further, potential hot spots like the Red Sea, Iran, and Taiwan help keep domestic and international defense spending robust. In fact, the new Congressional agreement to avoid a government shutdown calls for $886 billion in defense funding. Per the graph below charting defense spending, the current deal is a 10% increase compared to 2023.
The following bullet points summarize RTX’s financial and valuation status:
- It has a P/E of 17, down from a peak of 33 in 2020, but it aligns with its historical valuation. The P/S of 1.8 is relatively low and slightly below its 10-year average. Both figures are moderately below the S&P 500.
- Long-term debt to equity is 46%, significantly lower than its average of 64% in the last ten years.
- Revenue and earnings growth are approximately 3%. RTX is not a high-growth company. Revenue and earnings will vary with geopolitics, but expect GDP-like growth going forward. RTX pays out approximately 40% of its earnings via its dividend.
- RTX is consistently buying back shares but not aggressively. Such helps boost EPS on the margin.
- Profit margins have remained constant. As such, revenue growth and earnings growth will likely mirror each other.
Don’t expect fireworks from RTX. It is a slow but consistent growth company. Its valuations are below the market, reflecting its subpar growth. Technically, the stock appears poised for a run to record highs. Fundamentally, it is reasonably priced.
Any further updates on the status of the Pratt Whitney engines may greatly affect the stock price. Such provides risk if the news is bad or upside if they revise their costs lower.
Similarly, an escalation of the Ukrainian or Israeli conflict could positively affect sales and the stock price.
Lastly, RTX has a beta of .91, so it should perform in line with the S&P 500. However, RTX may be a great geopolitical hedge if hostilities worsen. Between its technical upside and geopolitical hedge potential, RTX plays a healthy role in a diversified portfolio.
Disclosure
This report is not a recommendation to buy or sell the named securities. We intend to elicit ideas about stocks meeting specific criteria and investment themes. Please read our disclosures carefully and do your own research before investing.


Michael Lebowitz, CFA is an Investment Analyst and Portfolio Manager for RIA Advisors. specializing in macroeconomic research, valuations, asset allocation, and risk management. RIA Contributing Editor and Research Director. CFA is an Investment Analyst and Portfolio Manager; Co-founder of 720 Global Research.
Follow Michael on Twitter or go to 720global.com for more research and analysis.
Customer Relationship Summary (Form CRS)