


Walmart (WMT) versus Target (TGT)
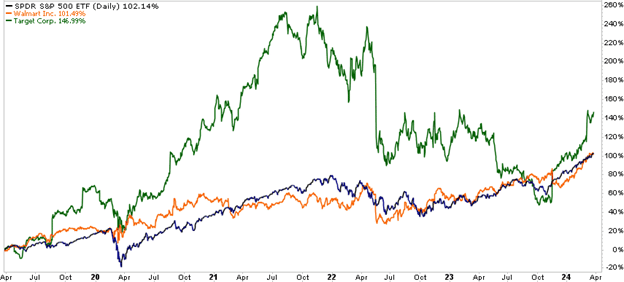
Last week’s analysis of Costco (COST) revealed that its two major competitors trade at much lower valuations. This week’s Friday Favorites will compare Walmart (WMT) and Target (TGT) to explore whether one looks like a better investment. We currently have a 1.50% allocation to WMT in our equity model but no position in TGT.
WMT and TGT are similar in many respects, but differences do exist. Walmart has a higher market cap ($490b) and a more widespread brick-and-mortar presence than TGT ($78b). Both companies derive sales from the Grocery and Retail Merchandise segments. Walmart caters to more cost-conscious consumers with its “Everyday Low Prices” branding. It would be a stretch to describe Target as offering higher-end retail merchandise, but its branding focuses more on quality than prices. A more significant difference is WMT’s ownership of Sam’s Club, a discount warehouse concept like that of COST. TGT has no such presence in the discount warehouse space.
Valuations
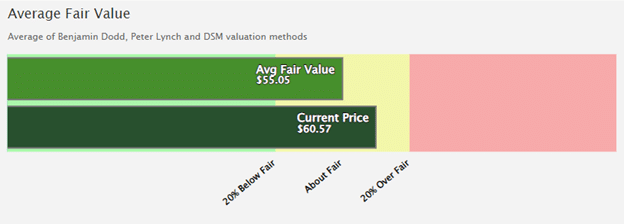
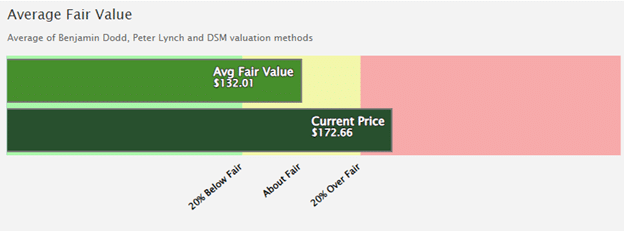
The first two charts below compare WMT and TGT on the average of three commonly used valuation metrics. Walmart is trading within our fair value range, about 10% above the fair value price. Meanwhile, TGT is trading roughly 31% above our fair value estimate.
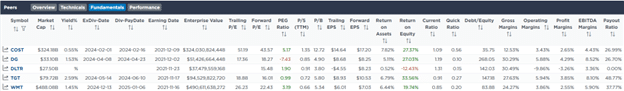
While TGT appears more overvalued when viewed through our fair value models, it trades at lower valuation ratios than WMT. The third chart below shows that WMT has a P/E of 26.2, whereas TGT has a P/E of 18.7. The valuation gap widens further when you bring expected growth into the equation with the PEG ratio. WMT trades at a relatively high PEG ratio of 3.2, while TGT boasts an attractive PEG ratio of 1.
Both companies have a long history of conducting share repurchases. However, in the past three years, each company’s pace of share count reduction has slowed dramatically. In fact, TGT shares outstanding have risen marginally over the past two years. Still, both companies have recently taken actions that signal a position of financial strength. Walmart has increased employee pay, while TGT recently announced that bonuses will be doubled for corporate employees this year.
WMT
TGT
Fundamental
While both stocks have similar operating efficiency concerning assets, TGT offers a substantially higher Return on Equity (ROE). Given their similar asset efficiency and margins, TGT’s ROE advantage stems from the greater use of leverage. TGT has a Debt-to-Equity (D/E) ratio of 147%, while the D/E of WMT is only 84%. TGT’s debt to equity may result in a higher ROE, but it also carries risk given the current elevated interest rate environment. WMT is better positioned to preserve margins if rates stay elevated for several years.
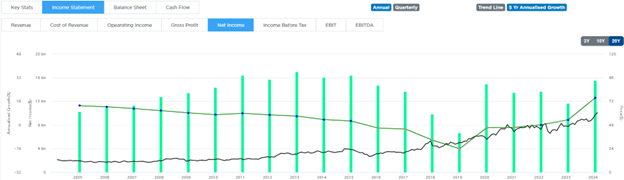
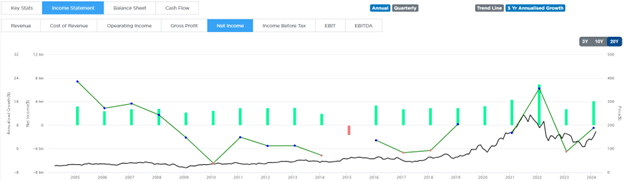
TGT has had a significantly higher annualized revenue growth rate over the past 5 years. Its 5-year revenue CAGR is 7.4% while WMT’s is only 4.7%. This historical growth differential supports the higher growth expectations analysts have afforded TGT, which results in a more attractive PEG ratio. In terms of 5-year annualized Net Income growth, however, WMT takes the cake, as shown in the two charts below.
WMT
TGT
Technical
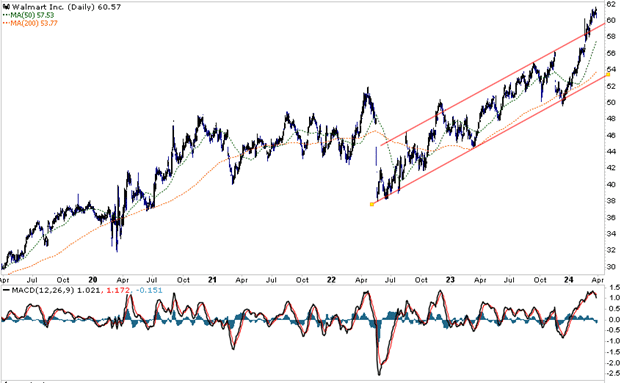
Both WMT and TGT have been on a stellar run this year. Their charts, however, tell very different stories. As shown in the first chart below, WMT had traded in a long-term bullish channel before breaking above the resistance line in February. The MACD appears to be turning over from a high level, which favors a pullback to test support near $60 per share. If the price can’t find footing there, then the 50dma would likely be the next stop.
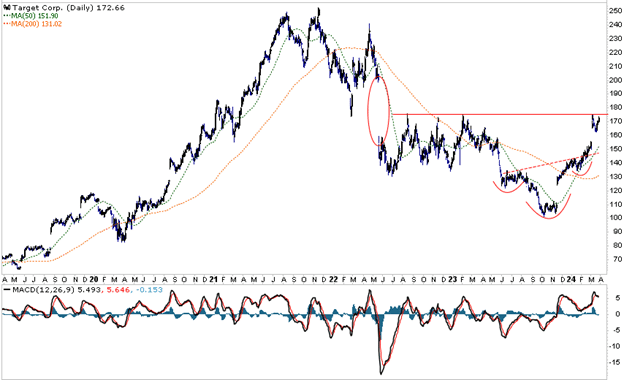
In contrast to WMT’s prevailing trend, TGT had been trading in a bearish trend coming into this year. It’s coming off a bullish inverse head and shoulders pattern, as highlighted in the second chart below. The bullish reversal and recent golden cross bode well for TGT investors going forward. There’s still a large gap to fill from back in 2022, but the stock is running into substantial resistance, as shown in the chart. A pullback to the 50dma would not be surprising and would provide a better entry point for prospective buyers. A consolidation before another test of resistance could also be in store.
Disclosure
This report is not a recommendation to buy or sell the named securities. We intend to elicit ideas about stocks meeting specific criteria and investment themes. Please read our disclosures carefully and do your own research before investing.