


German economic growth in the fourth quarter was revised lower to negative 0.4%. More concerning, German GDP is now back to pre-covid levels. Weak household consumption and capital formation were responsible for the decline. Most U.S. investors do not pay attention to German economic data or data from other major economic powers, despite the fact the U.S. economy is heavily linked to the global economy.
The graph below shows quarterly German and U.S. real GDP since 2012. The R-squared of .7706 denotes a strong relationship between German and U.S. economic activity. Real German GDP has fallen seven quarters since 2012, while the U.S. only declined thrice. Friday’s disappointing data from Germany doesn’t ensure a decline in U.S. GDP, but it warns that global economic activity is slowing. Given the Fed, ECB, and other central banks continue to hike interest rates and the importance of international trade, Germany’s data is another warning the year ahead could be treacherous.

What To Watch Today
Economy
- Durable Goods Orders, January Preliminary (-3.8% expected, 5.6% prior)
- Durables Excluding Transportation, January Preliminary (0.1% expected, -0.2% prior)
- Non-defense Capital Goods Orders Excl. Aircraft, January Preliminary (0.0% expected, -0.1% prior)
- Non-defense Capital Goods Shipments Excluding Aircraft, January Preliminary (-0.6% prior)
- Pending Home Sales, month-over-month, January (1.0% expected, 2.5% prior)
- Pending Home Sales NSA, year-over-year, January (-34.3% prior)
- Dallas Fed Manufacturing Activity, February (-9.10 expected, -8.4 prior)
Earnings
Market Trading Update
As the recession countdown begins, the market finally took notice of rising yields and the continued hawkishness of the Fed. In last week’s message, we discussed that while the bulls were betting on a “no recession” scenario, the market was beginning to discount that bet, and a deeper correction was coming. To wit:
“It is not uncommon for the market to hold up initially when the “sell signal” is triggered. Much like a car rolling downhill when the brakes are applied, it takes time to slow the previous momentum to a stop. The “sell signal” suggests that momentum is slowing, and it is likely that sellers will overtake buyers soon.
However, on Friday, the market cracked that initial support at the 20-DMA as the MACD signal deepened. While the market did rally into Friday’s close, suggesting the bullish bias remains, this is the first sign of a potential retest of the multiple support levels clustered around the 3950-4000. If the market can hold those levels, such will be an opportunity to increase equity exposure. A failure of that support will suggest a deeper correction is at work.”
This week, worse-than-expected inflation data and hawkish Fed minutes pulled the rug from beneath the bull’s feet. The sell-off started on Tuesday and intensified on Friday, taking out support at the 50-DMA. As we noted last week, critical support at the rising trend line from the October lows and the 200-DMA is now getting tested. A failure of those levels next week will put the bears back in charge of the market near term.
You will notice that we are now testing the bottom of the rising trend channel from October and failed at the June high resistance. Such sets up the market for a continued churn as the bulls and bears struggle for control.
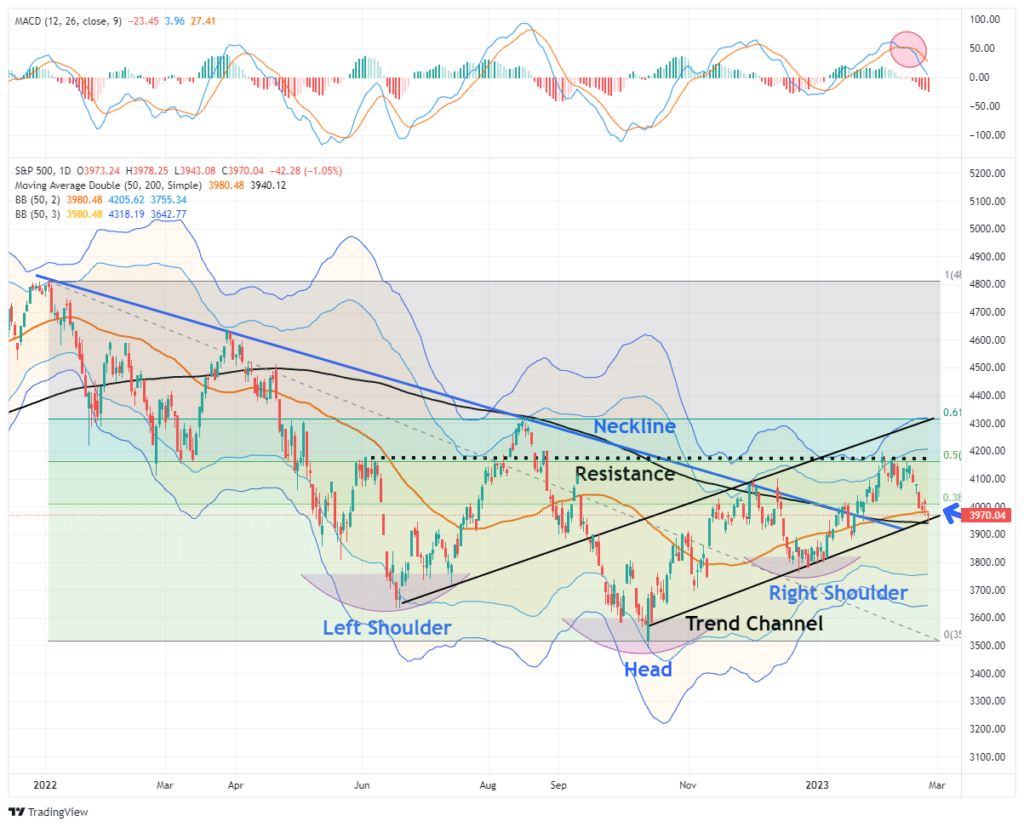
As noted below in both the Relative Performance Analysis and Risk Range Report sections of this week’s newsletter (link below), the market is oversold enough on a short-term basis to bounce. To wit:
“We expect a reflexive rally in the market to begin next week. Such will be a tradeable rally to sell into as the market remains on a stronger sell signal. As such upside will likely be limited and short-lived. Remain cautious for now, but opportunities are beginning to present themselves.“
The challenge for the market near term remains the economic data that continues to hint that inflationary pressures remain “stickier” than previously thought.
Read the rest of this weekend’s newsletter, “The Recession Countdown Has Started.”
The Week Ahead
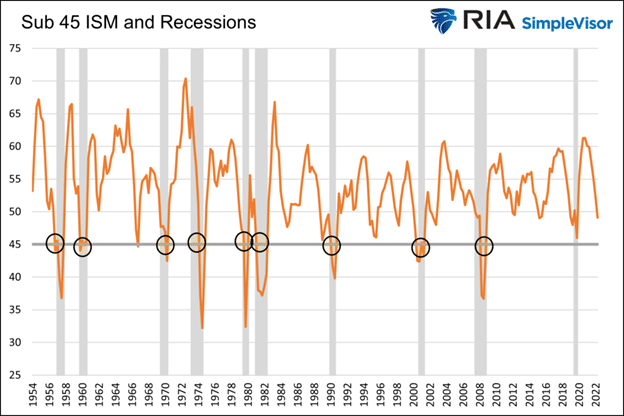
This week’s critical economic data worth closely following will be a few regional Fed surveys and the national ISM manufacturing index. The graph below shows a reading below 45 corresponds with the last ten recessions. The current expectation is for a slight improvement from 47.8 to 48.0. Pending home sales and the Case-Shiller home price index will shed more light on the state of the housing market.
Instead of Friday’s PCE inflation data, we expect more of the “higher for longer” narrative from the Fed this week. The Fed Funds market implies a 30% chance of 50bps at the next Fed meeting. We wouldn’t be surprised if the odds continue higher.
PCE Inflation
Like CPI and PPI, PCE inflation surprised to the upside. Core PCE, the Fed’s preferred inflation measure, was +0.6%, double expectations. The high print pushed the year-over-year rate from 4.6% to 4.7%. Notably, last month’s data was revised higher. The data only confirm the Fed’s fears that inflation will not come down as quickly as they or investors would like. Higher for longer is with us for a while!
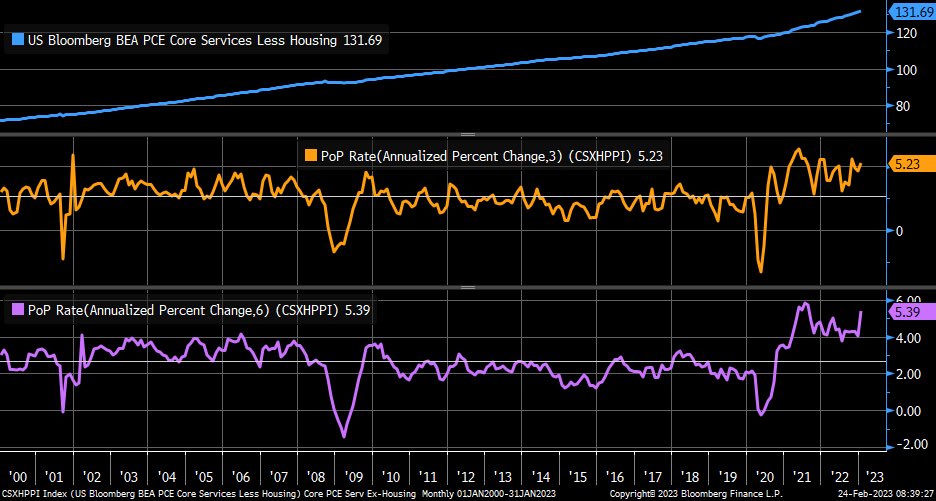
Liz Sonders of Charles Shwab notes: PCE core services ex-housing (Fed’s most-watched measure currently) moved higher in January, with 3-month annualized % change (orange) moving up to +5.2% and 6-month annualized % change (purple) moving up to +5.4%


As the Market Goes, So Goes Sentiment
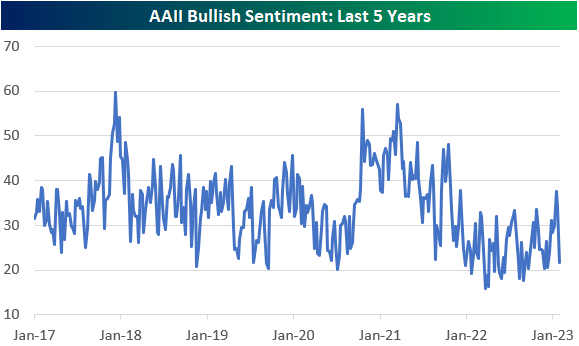
Over the last few months, the bulls were in charge, and investor sentiment grew more bullish. As the graph below from Bespoke Investments shows, the AAII sentiment survey of individual investors recently peaked above all of 2022 peaks.
The recent market decline sent bullish sentiment back down to 21.6%, well off the 33.6% five-year average. Such is not surprising, given sentiment’s ups and downs closely follow the market’s peaks and troughs. Therefore, we often consider investor sentiment a contrarian indicator. The market will typically reverse course when it resides at very high or low levels. If the only tool we had was investor sentiment, our bullish juices would start flowing when the AAII bullish reading was back in the teens. We reduced our equity exposure at the recent peak when others began buying into a Fed pivot-induced rally. With sentiment back nearer lows, our comfort in adding back exposure is higher, assuming other technical and fundamental indicators confirm the view. As the saying goes- “be wary when everyone is on one side of the boat.”
Tweet of the Day

Please subscribe to the daily commentary to receive these updates every morning before the opening bell.
If you found this blog useful, please send it to someone else, share it on social media, or contact us to set up a meeting.