


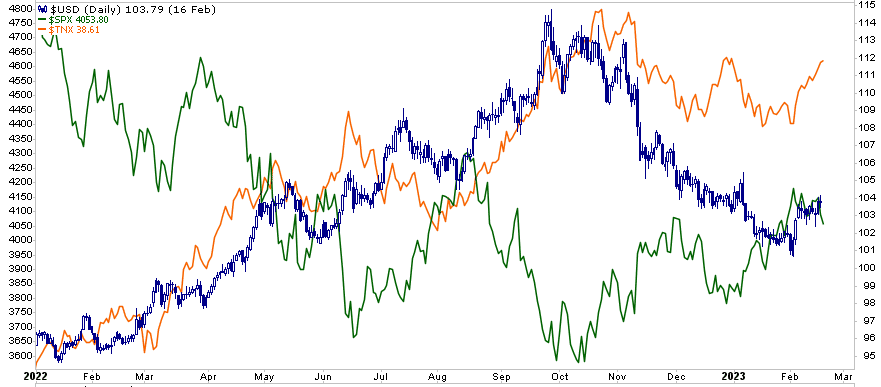
As we share in a section below, it is becoming more evident the Fed intends to raise the Fed Funds rate higher than expected and keep it there longer than the market’s expectations. A result of the Fed’s renewed commitment to higher for longer, is dollar strength. Higher Fed Funds and higher yields across the maturity spectrum are sparking a renewed interest by foreigners to shift toward U.S. bonds. Further, relative dollar strength seems likely if the hawkish commitment from the Fed will be around for the year.
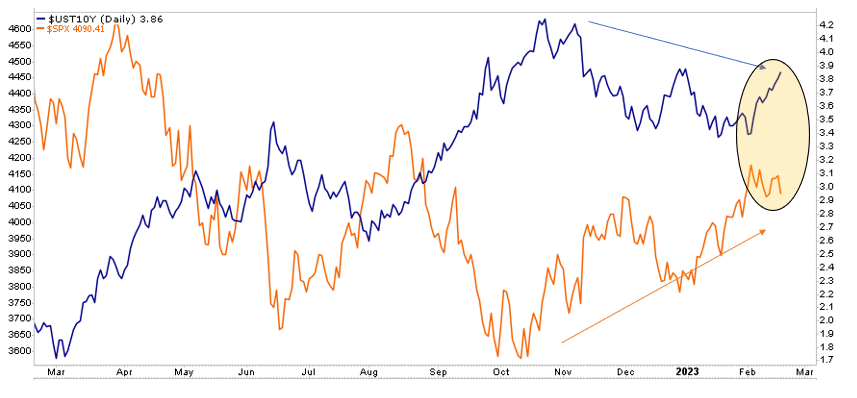
Through the Fed’s rate hiking campaign, dollar strength correlated well with higher yields (orange) and lower stock prices (blue), as we show. Conversely, since October, when the idea of a sub 5% Fed Funds terminal rate and a Fed pivot was the popular market narrative, the dollar slumped, yields fell, and stocks rallied. The dollar started rising again in early February. Investors should consider whether the rally is a short-term countertrend bounce or part of a more significant move higher.
What To Watch Today
Economy
- Philadelphia Fed Non-Manufacturing Activity Index, February (-6.5% prior)
- S&P Global U.S. Manufacturing PMI, February Preliminary (47.2 expected, 46.9 prior)
- S&P Global U.S. Services PMI, February Preliminary (47.3 expected, 46.8 prior)
- S&P Global U.S. Composite PMI, February Preliminary (47.5 expected, 46.8 prior)
- Existing Home Sales, January (4.10 million expected, 4.02 million prior)
- Existing Home Sales, month-over-month, January (-2.0% expected, -1.5% prior)
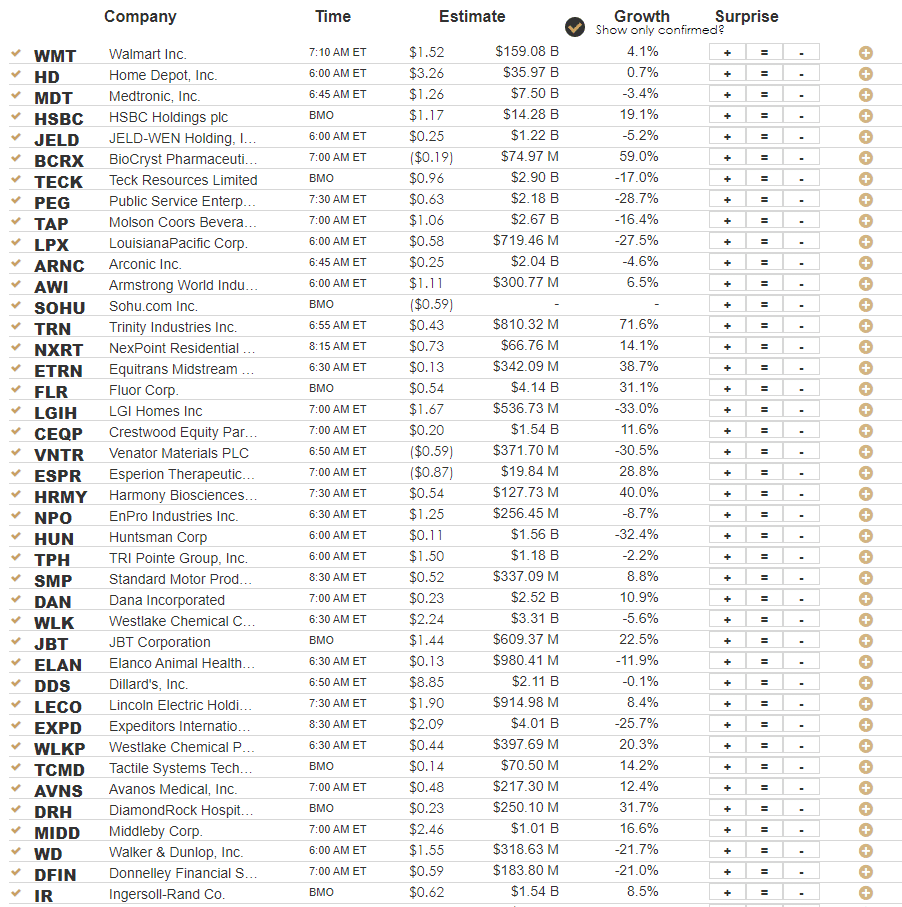
Earnings
Market Trading Update
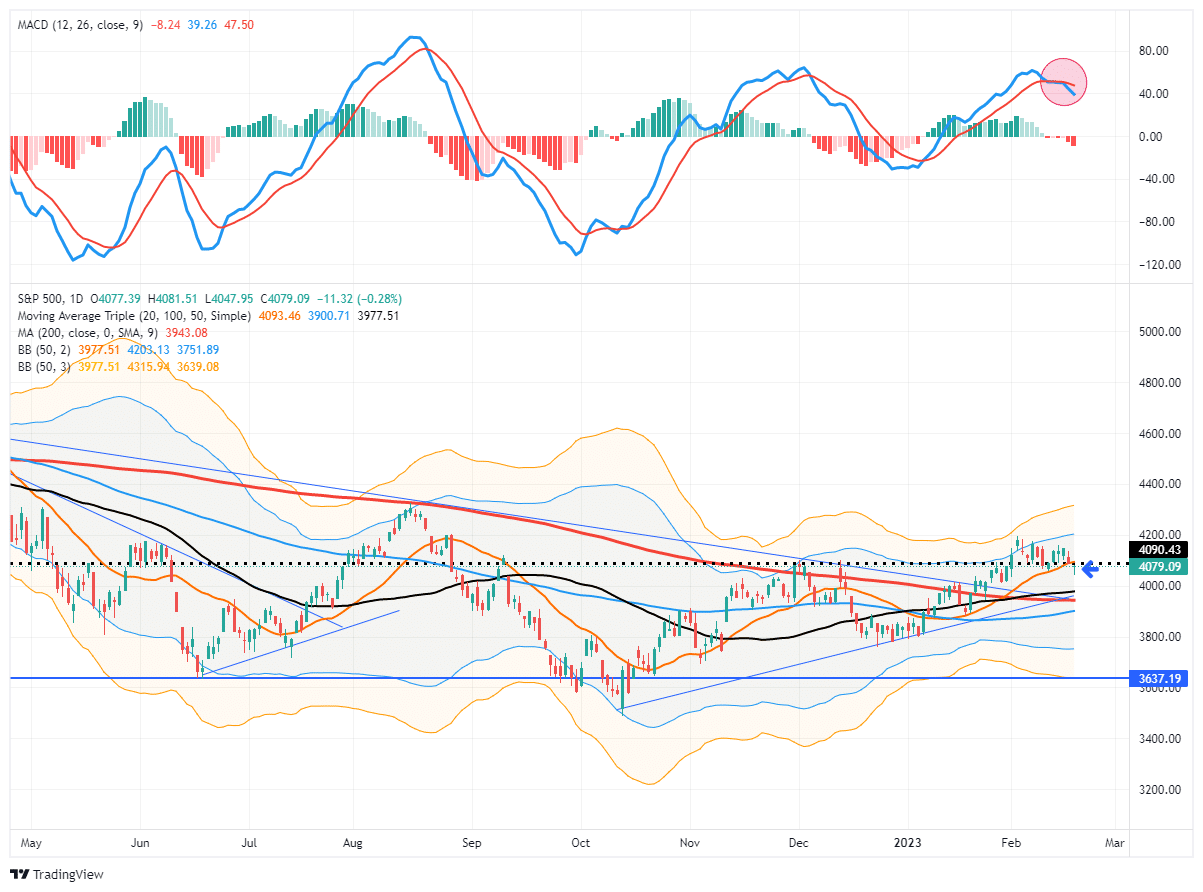
As shown, the bullish action of the market was evident all week as markets would open lower and then rally into the day’s close. With the market hugging the 20-DMA, that initial support level remained consistent all week. However, as shown, it is not uncommon for the market to hold up initially when the “sell signal” is triggered. Much like a car rolling downhill when the brakes are applied, it takes time to slow the previous momentum to a stop. The “sell signal” suggests that momentum is slowing, and it is likely that sellers will overtake buyers soon.
However, on Friday, the market cracked that initial support at the 20-DMA as the MACD signal deepened. While the market did rally into Friday’s close, suggesting the bullish bias remains, this is the first sign of a potential retest of the multiple support levels clustered around the 3950-4000. If the market can hold those levels, such will be an opportunity to increase equity exposure. A failure of that support will suggest a deeper correction is at work.
As discussed in this weekend’s newsletter, the economic data has supported the bullish case of a “no landing” scenario. That scenario assumes the economy avoids a recession entirely, allowing earnings to start growing again in the second half of the year. That somewhat optimistic scenario is heavily at odds with a Federal Reserve focused on slowing inflation which is only achieved by reducing economic demand through tighter monetary policy.
While markets are rallying short-term, history suggests that equities will not be able to fend off higher rates indefinitely. Such is particularly the case with the 2-year Treasury rate, which correlates with changes to Fed policy. It also suggests that interest servicing on consumer debt will become more problematic over the next several quarters as individuals run out of savings.

While the bulls are betting on a “no recession” scenario, history suggests such an outcome is unlikely to be the case. However, for now, the bulls continue to ignore the Fed.
The Week Ahead
While this week will not rival last week in terms of important economic data, there are a few reports worth following. The most important will be the PCE price index on Friday. Will the Fed’s preferred measure of inflation be hotter than expected, like CPI and PPI? Goldman Sachs thinks so. They forecast that the core PCE index rose 0.55% in January and 4.5% yearly. The consensus is 0.4% and 4.3%, respectively. Jobless claims on Thursday will be informative regarding the labor market.
The Fed will release the minutes from its February 1 meeting on Wednesday. Given that the minutes are updated notes from the meeting, will they emphasize their “higher for longer” theme? Might they also hint that raising the amount of QT is an option? Recent comments from Fed members lead us to believe the minutes will be more hawkish than expected.
Will Stocks Catch Down to Mounting Fed Hawkishness?
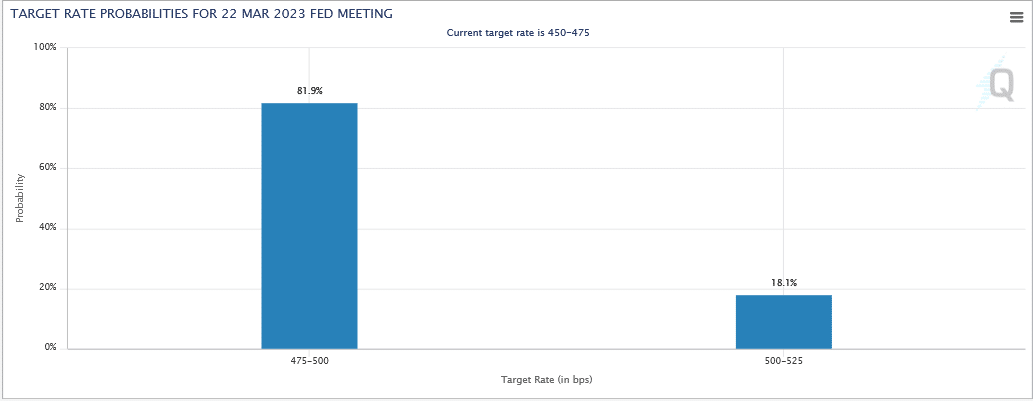
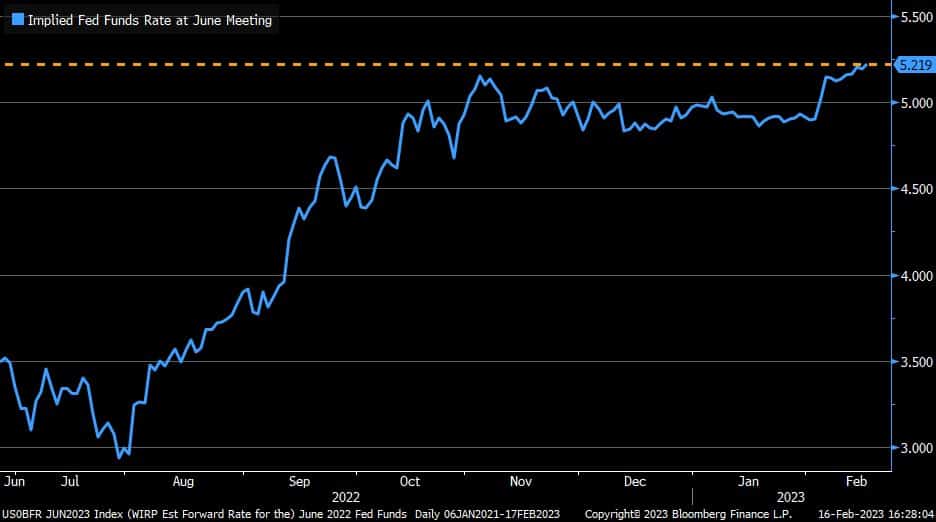
As shown in the first graph, Fed Fund futures are pricing in a 21% chance the Fed hikes rates by 50 bps at the March meeting. While the odds are still relatively small, two weeks ago, the odds were near zero. Two weeks ago, some thought the February rate hike was the last one. Strong CPI, PPI, and Retail Sales turned Fed projections on their head. Today’s base case is for another 75bps leaving rates at 5.25%. The July Fed Funds contract implies a 19% chance Fed Funds will be 5.50% and a slim 2% chance of 5.75%. The second graph shows that the June contract indicates a higher Fed Funds rate than the prior peak last October. The market, which was ignoring the Fed’s “higher for longer” rhetoric, is back to believing the Fed.
The equity rally kicked off in late October when the Fed pivot narrative started. As shown in the third graph, bond yields fell, and stocks rallied as a dovish narrative emerged. Of concern, as we circle on the chart, bond yields along with Fed Funds futures are pricing in a more hawkish Fed, yet stocks have not reacted to the same degree.
Why the bearishness on Thursday and Friday? Consider the following headlines and quotes from late last week:
- FED’S BULLARD: I WOULDN’T RULE OUT SUPPORTING 50-BPS MARCH HIKE.
- FED’S BULLARD: AT THIS POINT, I SEE THE POLICY RATE IN THE RANGE OF 5.25% TO 5.5% AS APPROPRIATE.
- FED’S MESTER: THE RETURN TO PRICE STABILITY WILL BE PAINFUL.
- “It’s not always going to be, you know, 25 [basis points],” said Cleveland Fed President Loretta Mester
- “As we showed, when the economy calls for it, we can move faster. And we can do bigger [increases] at any particular meeting.”

Median and Sticky CPI Joins the List of Concerns
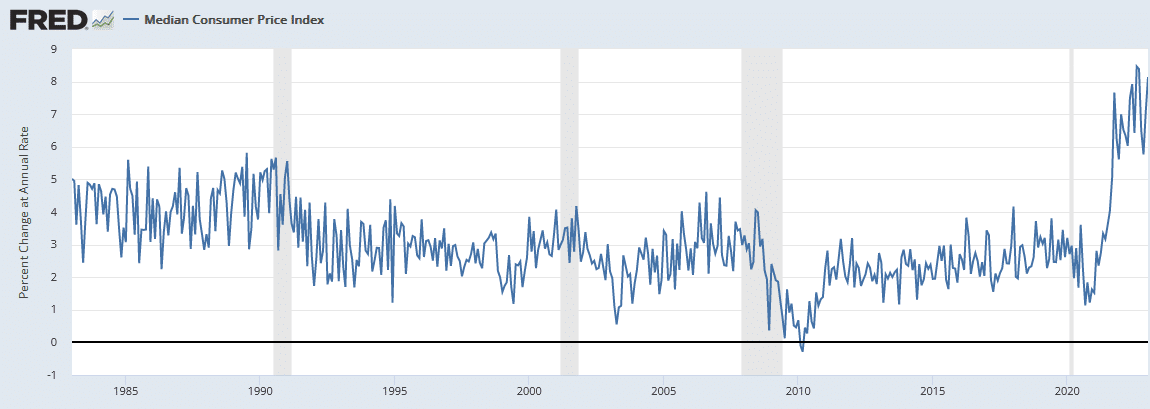
Inflationary concerns were reignited last week as CPI and PPI surprised to the upside. While housing, energy, and food prices tend to steal the headlines, there is a lot of data underneath the surface that is also informative. Two such indicators, which we share below, present worrying signs that inflation may be stubborn to fall.
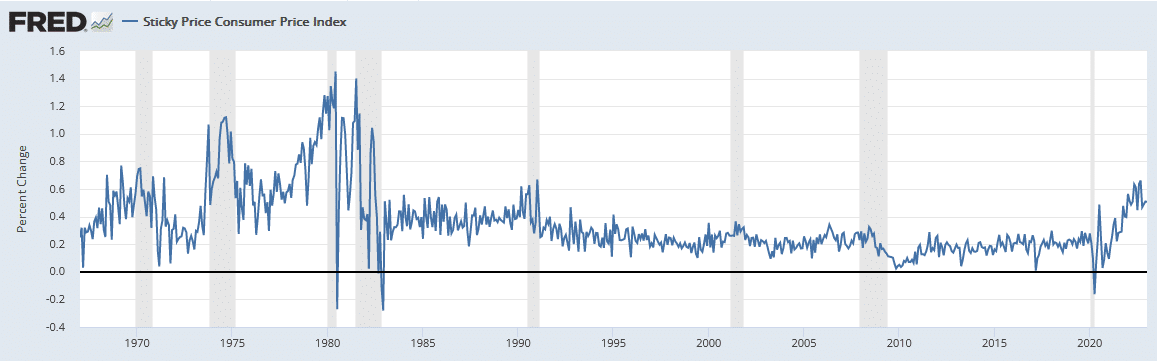
The first graph shows the median CPI. This simple measure, created by the Cleveland Fed, sorts the underlying CPI prices from high to low and strips out all but the middle 1% of prices. The median rate shown below is the annualized monthly rate. Half of the underlying CPI prices grew at or higher than an 8% annualized rate last month. Unlike CPI, it does not show signs of peaking. The second graph charts monthly sticky CPI. Some consider the Atlanta Fed sticky CPI a good indicator of future inflations, as explained by the Fed:
Because these goods and services change price relatively infrequently, they are thought to incorporate expectations about future inflation to a greater degree than prices that change on a more frequent basis.
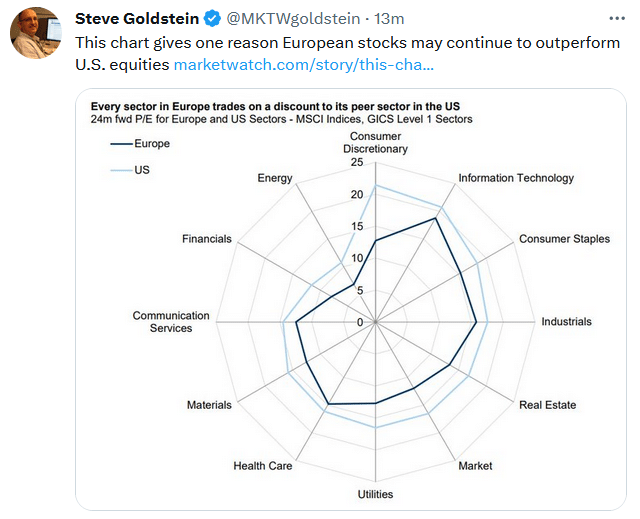
Tweet of the Day
Please subscribe to the daily commentary to receive these updates every morning before the opening bell.
If you found this blog useful, please send it to someone else, share it on social media, or contact us to set up a meeting.