


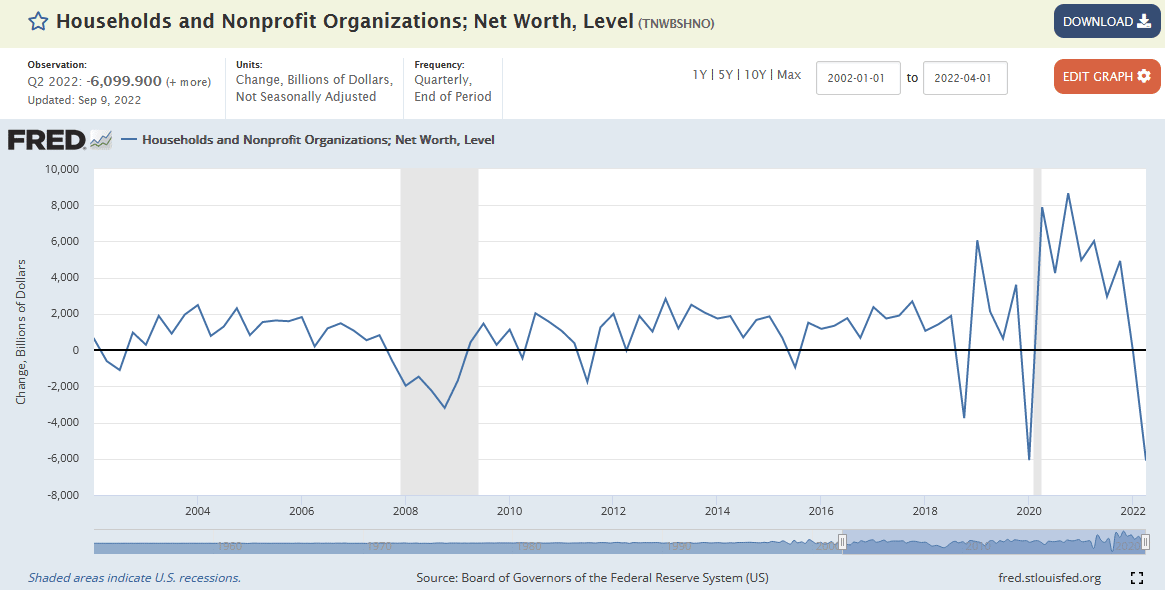
U.S. household net worth fell in 2Q22 by $6.1 trillion following a slight decline in the first quarter. As the graph below shows, household net worth rarely declines on a quarterly basis. The recent decline is on par with the decline in the first quarter of 2020 when covid was wreaking havoc on the economy and markets. While the current fall is daunting, we must consider that household net worth has risen substantially since the pandemic’s start. Since the second quarter of 2020, household net worth has been up $33 trillion to the most recent data. Currently, the total household net worth is $143 trillion. While the decline is not substantial compared to the increase of the last few years, it does portend that consumers may marginally take a more conservative approach toward spending habits due to recent losses.

What To Watch Today
Economy
- 7:00 a.m. ET: NFIB Small Business Optimism, August (90.1 expected, 89.9 prior)
- 8:30 a.m. ET: Consumer Price Index, MoM, August (-0.1% expected, 1.3% prior)
- 8:30 a.m. ET: CPI excluding food and energy, MoM, August (0.3% expected, 0.3% prior)
- 8:30 a.m. ET: CPI, year-over-year, August (8.1% expected, 8.5% prior)
- 8:30 a.m. ET: CPI excluding food and energy, YoY, August (6.1% expected, 5.9% prior)
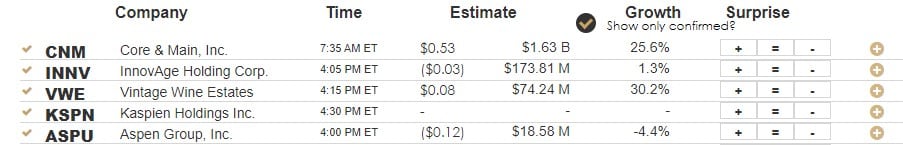
Earnings
Market Trading Update
As noted in this past weekend’s newsletter:
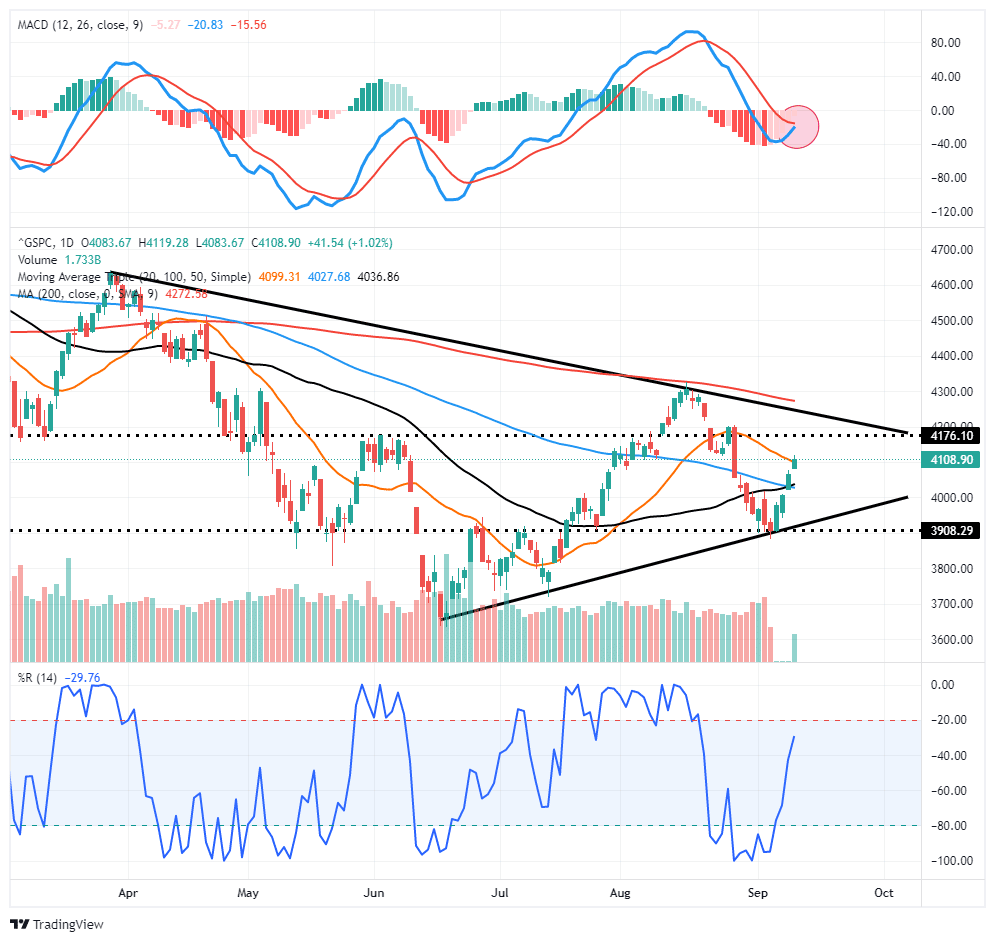
“First, the market held support at the rising bullish trend line and managed to climb through resistance at the 50- and 100-day moving averages (dma), which now sets up a potential rally to the 20-dma. With markets not overbought, there is fuel for an additional rally into next week, and importantly, the market is very close to flipping the MACD onto a ‘buy signal.‘”
That occurred yesterday with the market pushing above the 20-dma and getting very close to triggering a MACD buy signal. Such would pave the way for the rally to extend to the next resistance line at 4176, coinciding with the March peaks’ downtrend. If the market can clear that resistance at the 200-dma, a rally to the March highs is likely.
Again, the bullish technical backdrop certainly defies the reality of tighter monetary policy and slower economic growth. But as we noted in the newsletter, “we have to trade the market for what it is, not what we wish it to be.”
For short-term traders, a further rally is likely, so adding exposure is warranted for the time being.
For longer-term investors, you will likely want to consider selling the rally as it advances to reduce risk and opportunistically reposition portfolios for a weaker macro-environment in 2023.
Another Bullish Sign
Key points from Sentiment Trader
- Volume in advancing shares as a percentage of total volume exceeded 90% on Friday.
- A 90% up volume day has now occurred four times in two months
- After similar clusters, the S&P 500 was higher 91% of the time a year later
“Other clusters of four NYSE up volume days of 90% in two months led to a bullish long-term outcome for the S&P 500.
Weak returns over the next week are a good reminder that sometimes markets take a breather after a burst of buying demand. Historically, a cluster of 90% up volume days has been bullish for stocks, especially 6 and 12 months later. Over more than 70 years of history, the only negative long-term return occurred during the largest financial crisis since the Great Depression.“

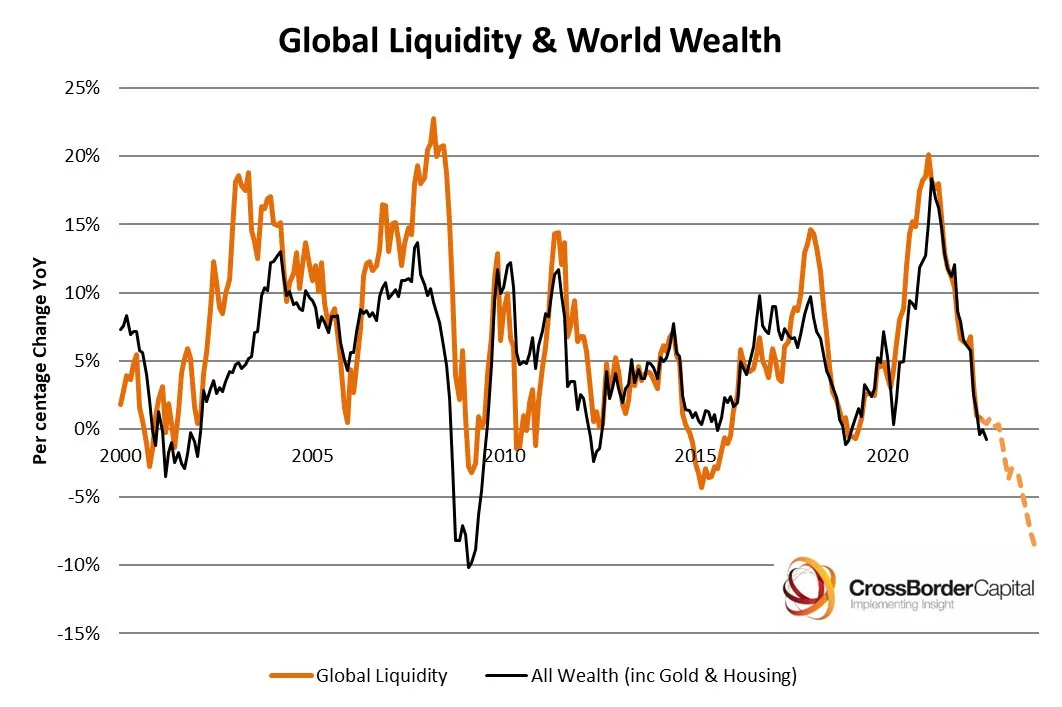
Global Wealth Is Also Declining
The graph below from CrossBorder Capital shows that global wealth, like U.S. household net worth, is declining. While the decline is slight, the strong correlation between global liquidity and wealth argues that the wealth destruction in the coming year could be on par with the financial crisis in 2008 if central banks continue to remove liquidity from the banking system and financial markets.
SimpleVisor Gamma Band Update
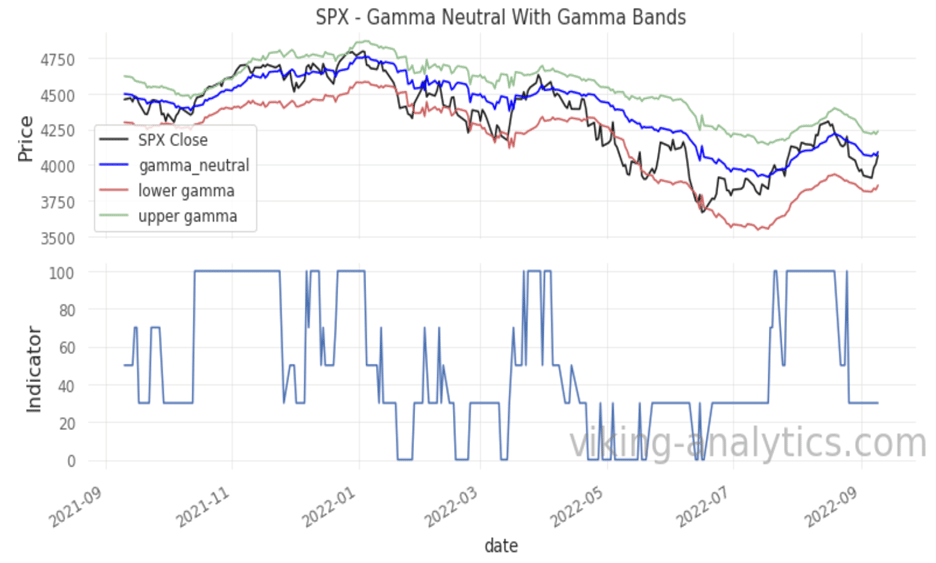
Every Monday, Viking Analytics provides SimpleVisor subscribers their Gamma Band Update. The research uses options data to ascertain what price levels push options dealers to hedge their options books by buying or selling S&P 500 futures. Often at important option expiration dates like this Friday, the Gamma neutral will act like a magnet on the index. If that happens, the market will be unchanged for the coming week.
Yesterday’s Gamma Band update provides key levels heading into Friday’s quadruple witching options expiration. Per the article:
The S&P 500 (SPX) found technical support and rallied sharply to close the week just under its gamma flip level. Below the gamma flip, we anticipate amplified volatility. Our gamma band model enters quarterly option expiration week with a 30% allocation to the SPX and will increase its long position if SPX closes above the gamma flip currently near 4,090. The model will move to a 0% allocation if the market closes below the lower gamma level, currently near 3,875.
The chart below shows how price (in black) relates to the gamma flip (in blue) and the lower gamma level (in red). The Indicator in the second chart below shows the daily positioning allocations.
Since the market started trending lower in January, the Gamma Neutral (blue) and Upper Gamma (green) has acted as resistance. Gamma Neutral is at 4090, and the Upper Gamma band is around 4250.
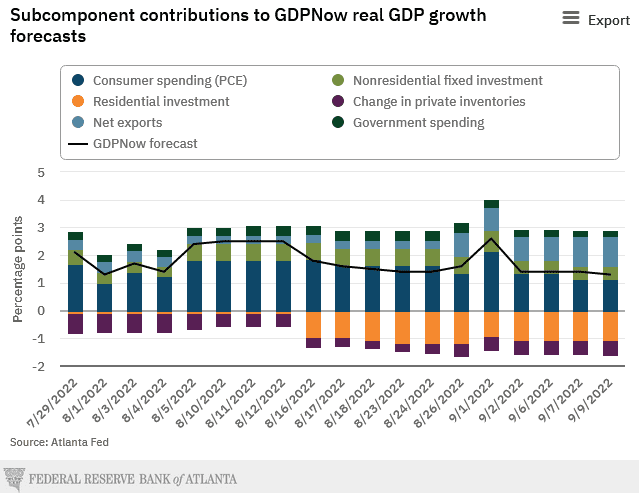
Q3 GDP Forecast
As we approach the quarter’s end, forecasts for GDP start becoming more accurate. The Atlanta Fed, which only uses actual economic data, is currently tracking Q3 GDP at 1.2%, as shown below. The second graph highlights how each major subcomponent contributed or detracted from the estimate. Net exports and consumer spending add the most to the tracking figure, while residential investment is the least. Given high mortgage rates, it is not surprising that residential investment is negative. However, given the dollar’s strength, it is surprising that net exports (exports less imports) contribute to growth. A positive net exports figure represents a trade surplus. Trade surpluses have been few and far between over the last 30 years. As such, we suspect the current instance of buoyant net exports has to do with high energy prices and growing energy exports to help offset Russian oil and gas.

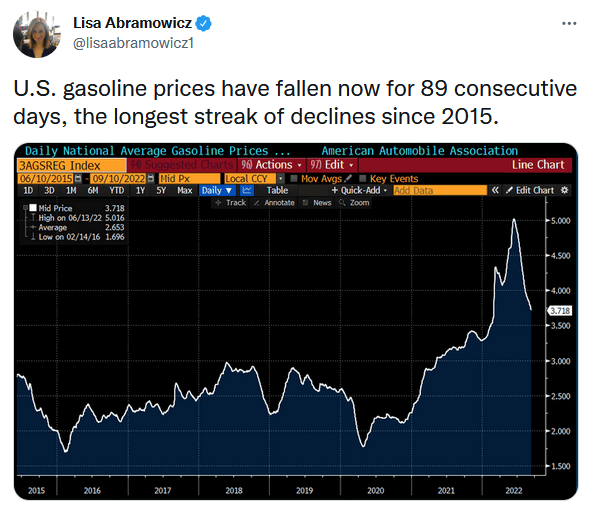
Tweet of the Day
Please subscribe to the daily commentary to receive these updates every morning before the opening bell.
If you found this blog useful, please send it to someone else, share it on social media, or contact us to set up a meeting.