


Since the Iranian conflict began, bond yields have risen sharply due to investor expectations of a spike in inflation. Recent inflation data shows those rising inflation expectations are somewhat justified. In March and April, the monthly rate of inflation, as measured by CPI, rose by 0.86% and 0.64%, respectively. On an annualized basis, those equate to inflation running in the high single digits. The problem with that cursory review is that bond yields are based not solely on current inflation but on inflation over the bond’s entire term. For example, a five-year note yield should incorporate inflation expectations over the next five years. When we analyze the recent increase in bond yields, we notice an important disconnect has occurred.
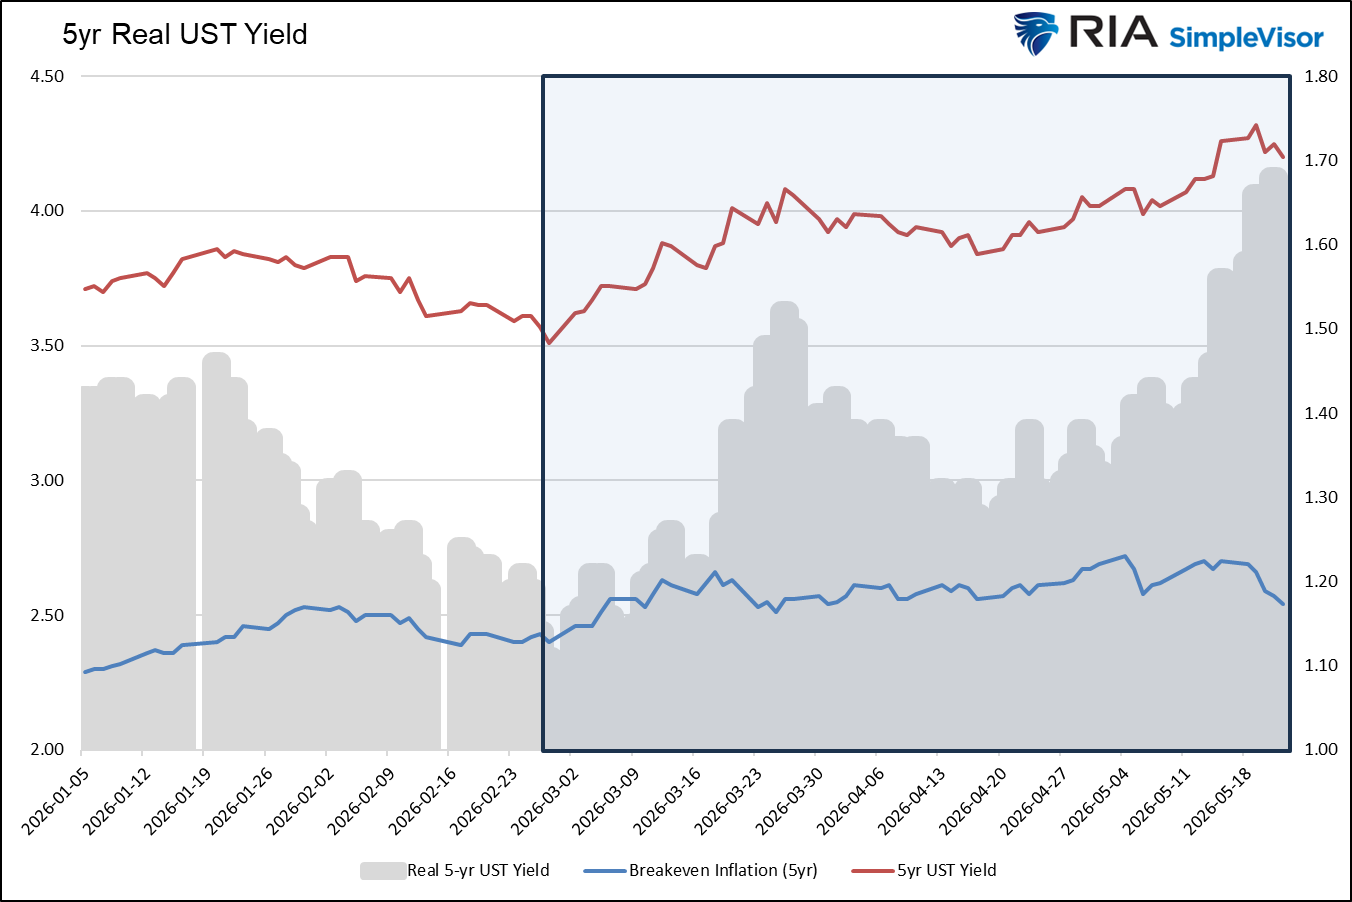
The graph below shows 5-year UST yields (red) and 5-year inflation expectations (blue), as measured by TIP and nominal bond yields. Importantly, inflation expectations are not survey responses or best guesses; they measure actual money being put to work in the markets. Since the war started in late February, the 5-year UST yield has risen by nearly 70 bps, while 5-year inflation expectations have risen by only 15 bps. Thus, the 5-year real yield is up by about 55bps since the conflict started. The takeaway is that the recent increase in yields is not primarily about rising inflation expectations but rather about recency bias. Investors fear that high inflation rates from a few years ago are about to recur and are selling bonds to protect themselves against it.
While we understand the fear, the reality is that the market is not pricing in future inflation in line with the market reaction. The extra yield, known as the term premium, will likely normalize when oil prices fall and inflation expectations cool. Accordingly, we expect the red and blue lines below to converge.
What To Watch Today
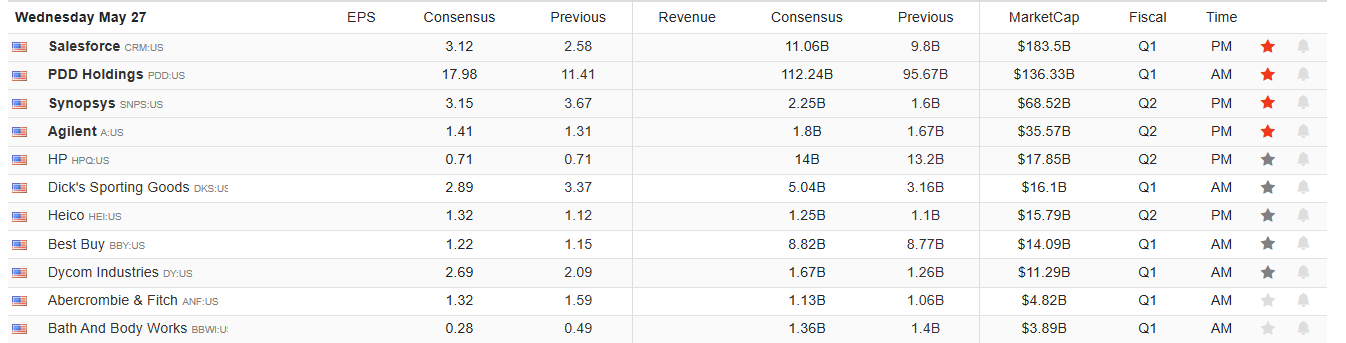
Earnings
Economy

Market Trading Update
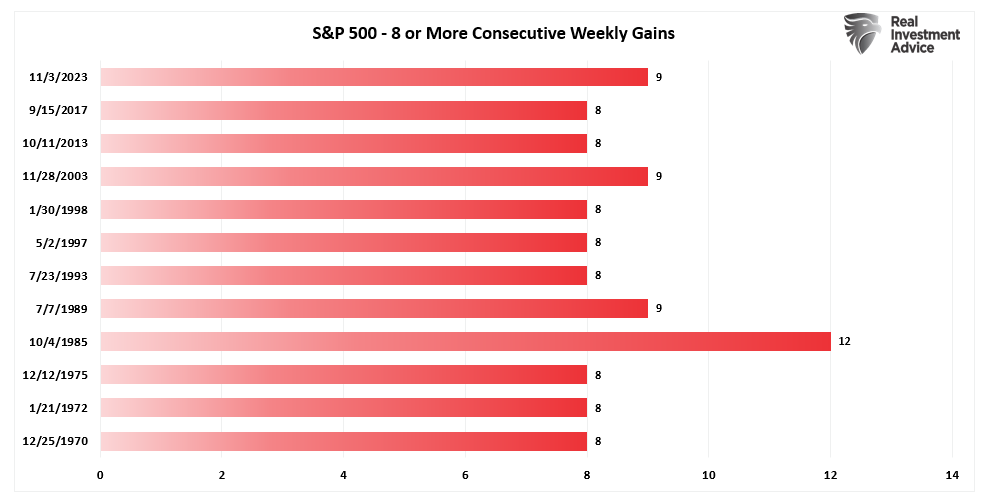
Yesterday, we reviewed the technical backdrop for the market as the technology trade continues. This past Friday, the market completed 8 weeks of consecutive gains, a feat that is somewhat rare historically. As shown below, since 1965, the S&P 500 has hit eight consecutive weekly gains on 13 occasions, or roughly once every 4.2 years. This analysis measures forward returns from the moment a streak reaches its 8th consecutive up week, capturing both cases where the run ended at exactly 8 and cases where it extended to 9, 10, or 12 weeks. The pattern that emerges is the strongest momentum signal in the dataset: a modest near-term pause followed by decisively positive longer-term performance.
Short-term, the next week leans negative, but it is by no means guaranteed to go down. Of the 12 historical instances with complete data, 4 saw the streak extend to 9+ weeks (one reaching 12 weeks in late 1985), while 8 ended the run with a down week. The 1-week forward return averages -0.4% with a median of -0.3%, and 33% of instances were positive. The takeaway is that an 8-week run does not mechanically guarantee a pullback the following week—but the odds tilt modestly toward consolidation.
The intermediate horizon shows momentum reasserting itself with conviction. At four weeks out, the average return is +1.2% with 75% of instances positive. At 12 weeks, the average jumps to +3.1% with 75% positive. At 26 weeks, the average is +2.8% with 67% positive. The market’s tendency to digest gains over the first month or two is consistently followed by a resumption of the underlying trend.
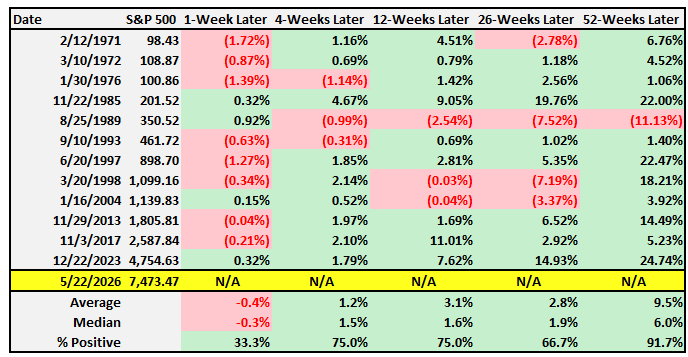
The 52-week picture is where the 8-week signal truly distinguishes itself. The average one-year forward return is +9.5%, with 92% of instances—11 out of 12—posting positive returns and a median gain of +6.0%. The only negative outcome was August 1989, when the streak ended just months before the 1990 recession and Gulf War drawdown (-8.8% one year later). Every other instance delivered positive returns, with several producing exceptional outcomes: the 2023 year-end run (+24.7%), the 1997 rally (+22.5%), the early-1998 surge (+18.2%), the 1985 advance (+18.4%), and the 2013 taper-resilient rally (+14.5%).
What makes an 8+ week winning streak structurally bullish is the conviction it implies. By the time the market strings together two full months of consecutive weekly gains, breadth has typically broadened, earnings revisions are positive, and the marginal seller has been exhausted. These conditions rarely reverse abruptly; they tend to persist through the bulk of an intermediate-term advance. The historical record shows that the discomfort of an 8-week run feeling “overdue for a pullback” is almost always followed by a pullback that gets bought.
For investors, the practical takeaway sharpens at the 8-week threshold. First, the near-term return distribution is choppy: roughly two-thirds of cases see a down week, but a meaningful one-third extend the streak further. Chasing the final weeks of an extended run still carries elevated short-term risk, but it is not the certain reversal that streak-ending observations would suggest. Second, do not mistake any pullback that does occur for a top. With a 92% one-year positive rate and an average forward return of +9.5%, the body of evidence across five decades shows that 8+ week winning streaks have overwhelmingly marked the middle of broader advances, not their exhaustion. Patient buyers who follow these signals on weakness have been rewarded in 11 of 12 historical instances.

Breadth Improves Slightly
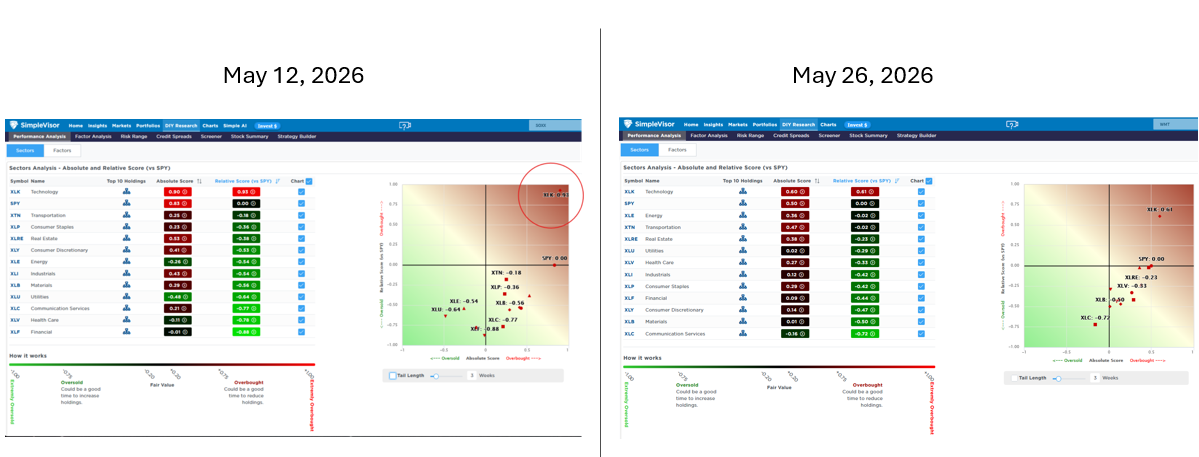
The graphics below compare the sector analysis from Tuesday with that from two weeks ago. Two weeks ago, we highlighted the tech sector in the upper-right corner as it was grossly overbought in both our absolute and relative analyses. Based on today’s graph and data, we can see a slight improvement in breadth. The technology sector is still overbought, but not nearly as much as it was two weeks ago. Further, many of the other sectors have shifted slightly to the right and upwards.
Communications is the only sector oversold on both a relative and an absolute basis, while technology is the only overbought sector. We would like to see breadth continue to improve while the market maintains current levels or hits new highs. Such would put the market in a more sustainable position.
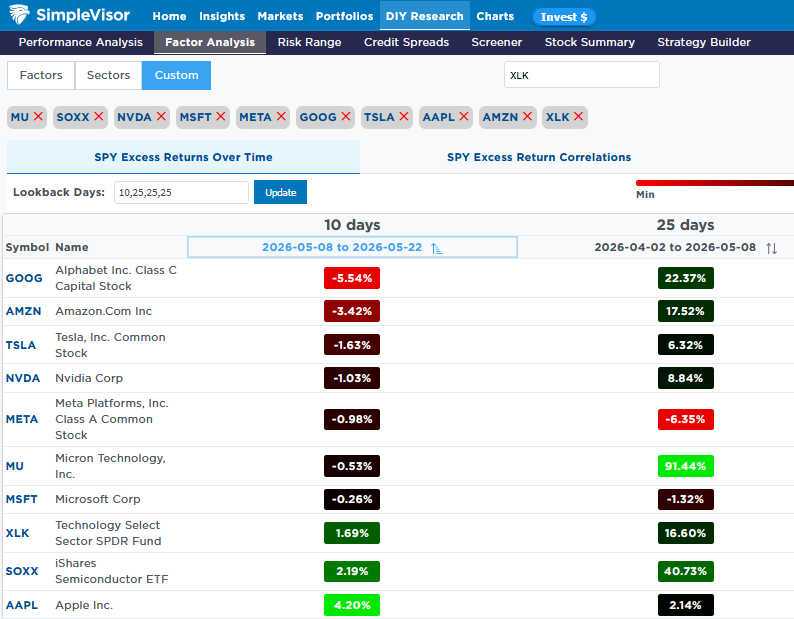
The second graphic shows that the Magnificent 7, excluding Apple and the recent semiconductor favorite Micron (MU), underperformed the market this past week. In the 25 days prior to that, all but Meta, Microsoft, and Apple grossly outperformed the market.
Corrections Vs. Bear Markets: Why 20% Declines Are Obsolete
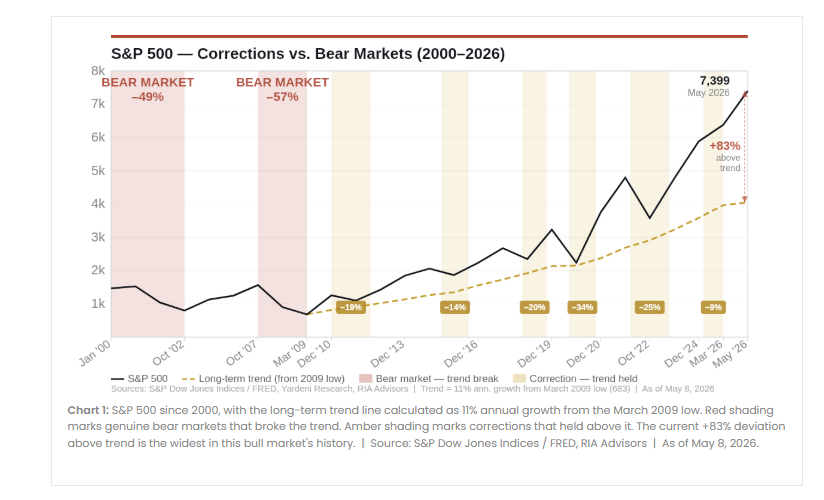
After three decades of watching market cycles play out from both sides of the trade, I’ve come to a simple conclusion: Wall Street’s love of simple rules is one of the most dangerous aspects of investing. When stocks fall 10%, it’s just a “correction.” However, if they decline 20%, it’s a “bear market.” Simple, clean, repeatable, and printed on every financial media graphic from here to Tokyo. The problem is that the definitions of a correction and bear market have not been updated since Alan Shaw developed them at Smith Barney in the 1960s. Moreover, the market those definitions were designed to describe no longer exists.
Currently, the S&P 500 index is roughly 83% above its long-term trend line, with the Shiller CAPE (cyclically adjusted price-to-earnings ratio) hovering near 40. That valuation level was only exceeded once in the history of American financial markets. The Fed’s balance sheet, still at $6.7 trillion, is more than eight times its pre-2008 level. Under these conditions, the old bear-market definition no longer measures what it was built to measure. A 20% decline from here doesn’t signal either a regime or price trend change. In other words, it would be only a “correction” within an ongoing bullish trend. That understanding is key to today’s discussion.
Tweet of the Day
“Want to achieve better long-term success in managing your portfolio? Here are our 15-trading rules for managing market risks.”
Please subscribe to the daily commentary to receive these updates every morning before the opening bell.
If you found this blog useful, please send it to someone else, share it on social media, or contact us to set up a meeting.