


The May CPI report released yesterday was considered the first inflation gauge to show how tariffs are impacting prices. We would like to see a few more months of inflation reports before claiming the coast is clear, but the May CPI is encouraging. For the fourth consecutive month, the CPI was below Wall Street estimates. Monthly CPI and Core CPI rose 0.1% versus expectations of 0.2% and 0.3%, respectively. The annualized rate of inflation based on the last three months is 1.35%, well below the Fed’s 2.00% target.
Interestingly, prices for new and used cars, as well as apparel, fell in May. Some forecasters thought that those goods were likely to see higher prices due to tariffs. New car prices fell by 0.3%, and apparel and used car prices declined by 0.4%. This suggests that companies are finding ways to limit the pass-through of higher costs resulting from tariffs. Might profit margins are weaker than expected in the coming earnings reports for companies in these industries?
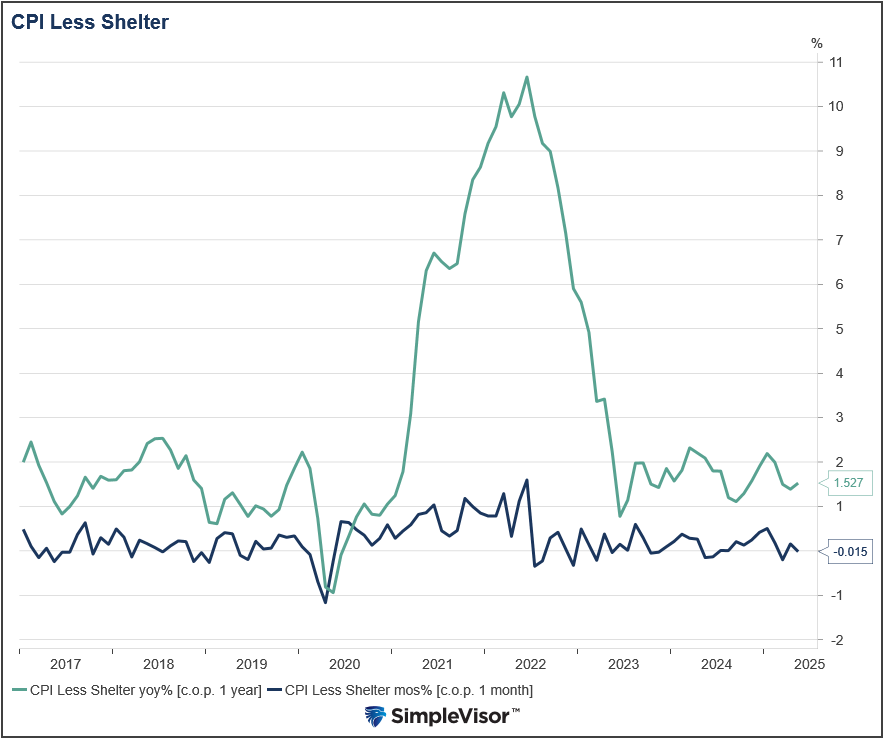
Shelter prices remain sticky, rising 0.3% and accounting for the total increase in CPI and then some. To wit, the graph below shows that the CPI, excluding shelter prices, was slightly negative in yesterday’s report, and they are running at only 1.50% year over year.
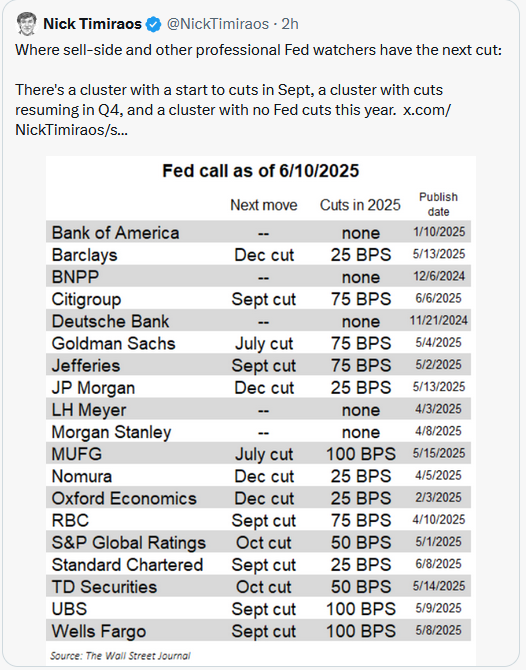
The odds of the Fed cutting are near zero percent at next week’s meeting. However, with another benign inflation report in hand, traders are inching up expectations toward two cuts for the remainder of the year.
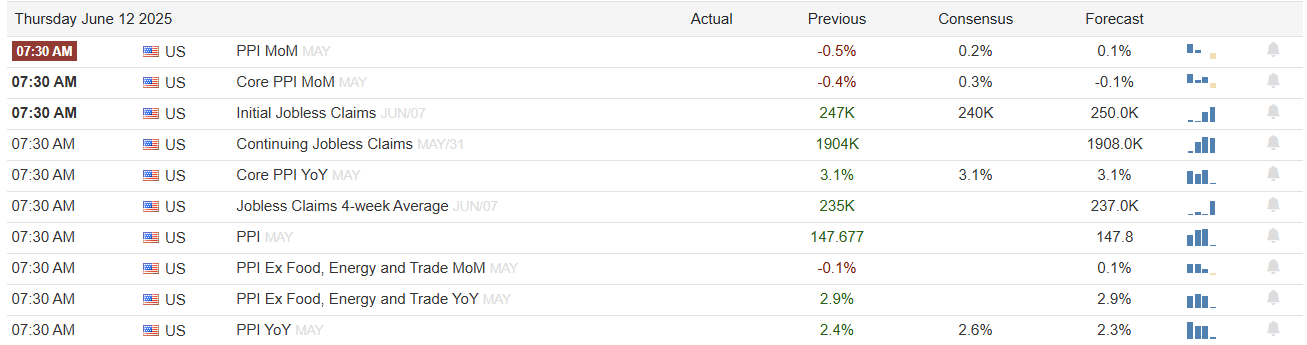
What To Watch Today
Earnings

Economy
Market Trading Update
Yesterday, we discussed that the recent rally from the lows suggests that the bull market has returned and fears of a secondary correction are likely overblown. Sentiment Trader recently discussed another indication that such is the case
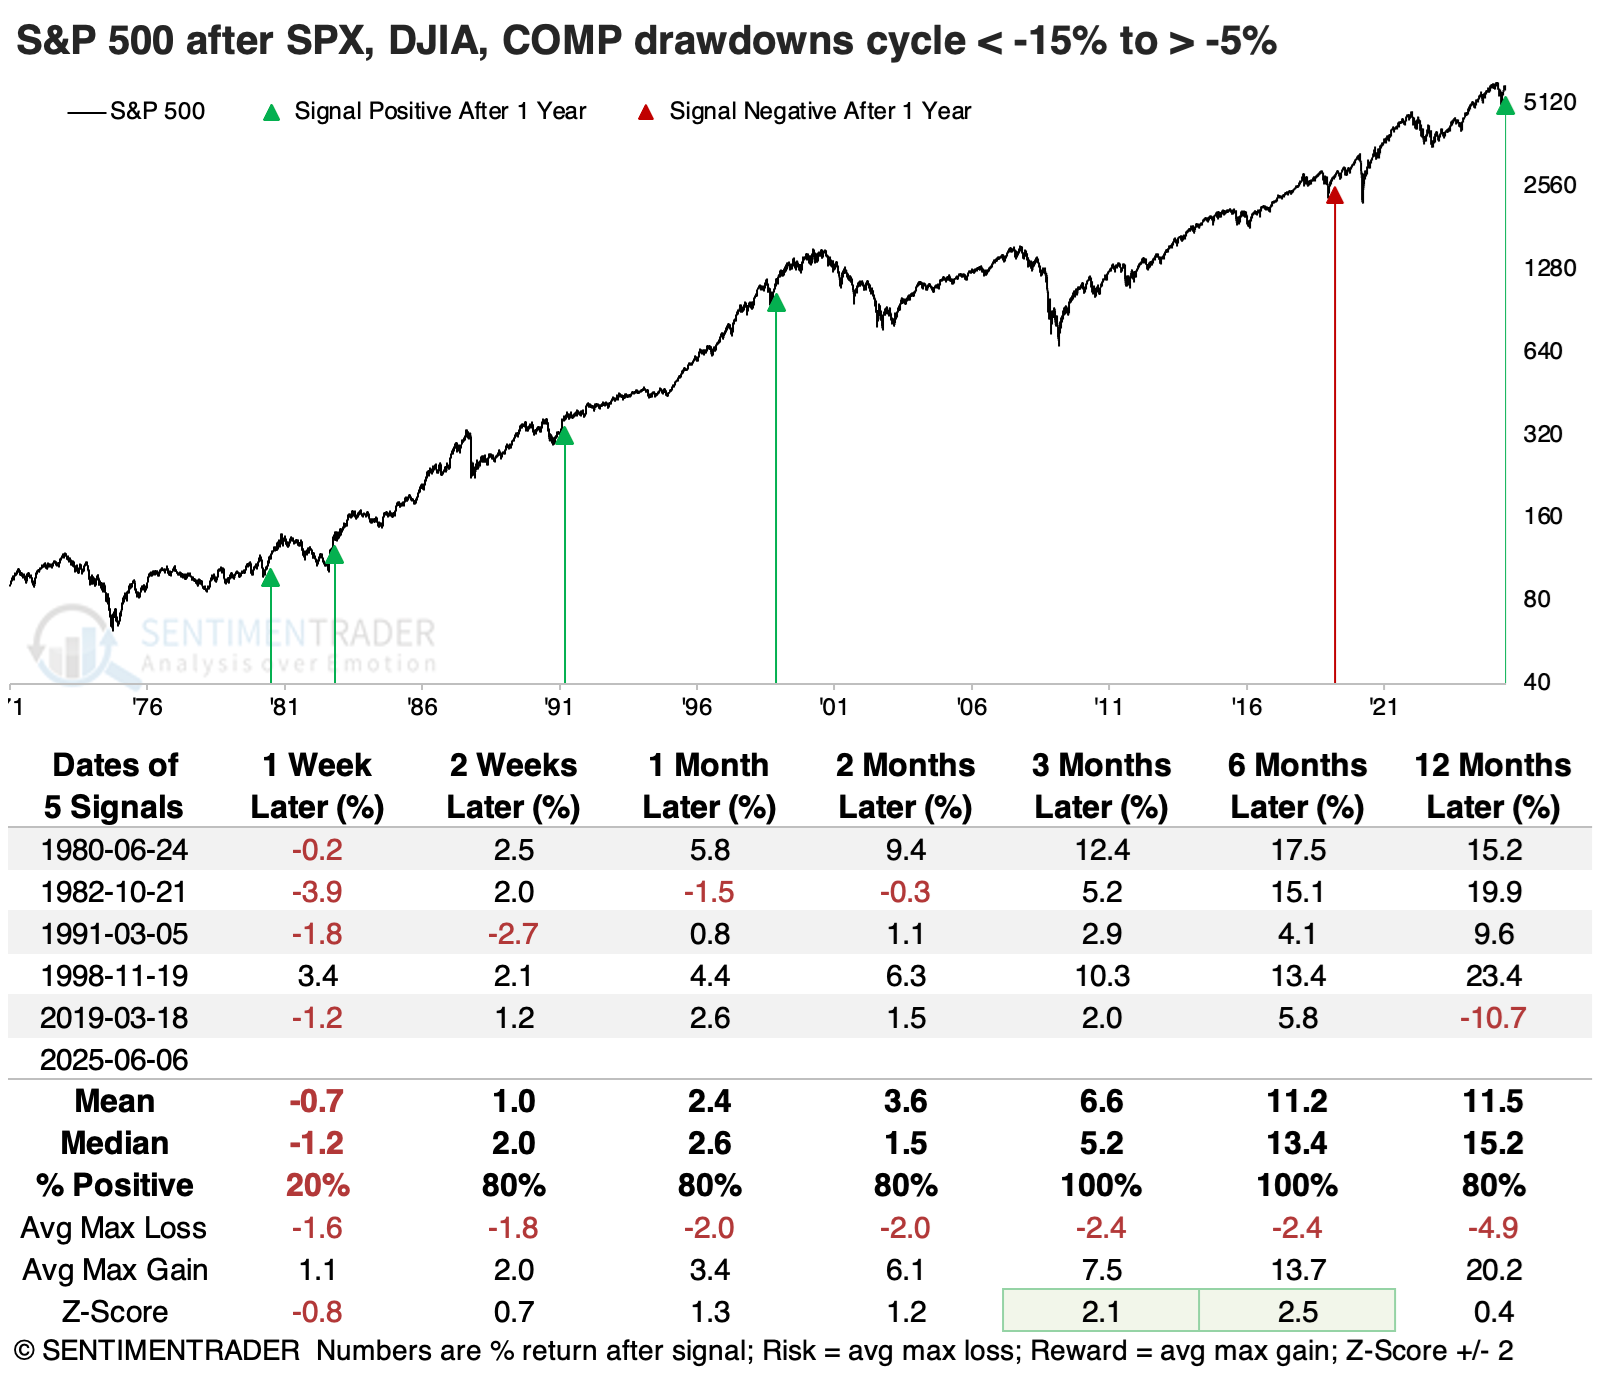
“Three of the ‘Big Four’ indices have come storming back. The most-followed three U.S. equity indices have recovered to within 5% of their multi-year highs. This is a notable recovery from at least a -15% drawdown for the S&P 500, Dow Industrials, and Nasdaq Composite. Only the small-cap Russell 2000, with less historical data to test, is lagging.”

The table below shows how the S&P 500 has performed after all three recovered to within 5% of a 3-year high after all were at least 15% below within the past 50 sessions. On average, the current drawdown was less than -4% between the three. As noted by Sentiment Trader:
“Not many times have we witnessed such a quick recovery across all three indices. However, they were good for the S&P 500 from the available history. It continued to power higher each time over the following three to six months, though it eventually succumbed to the pandemic panic in 2020.”
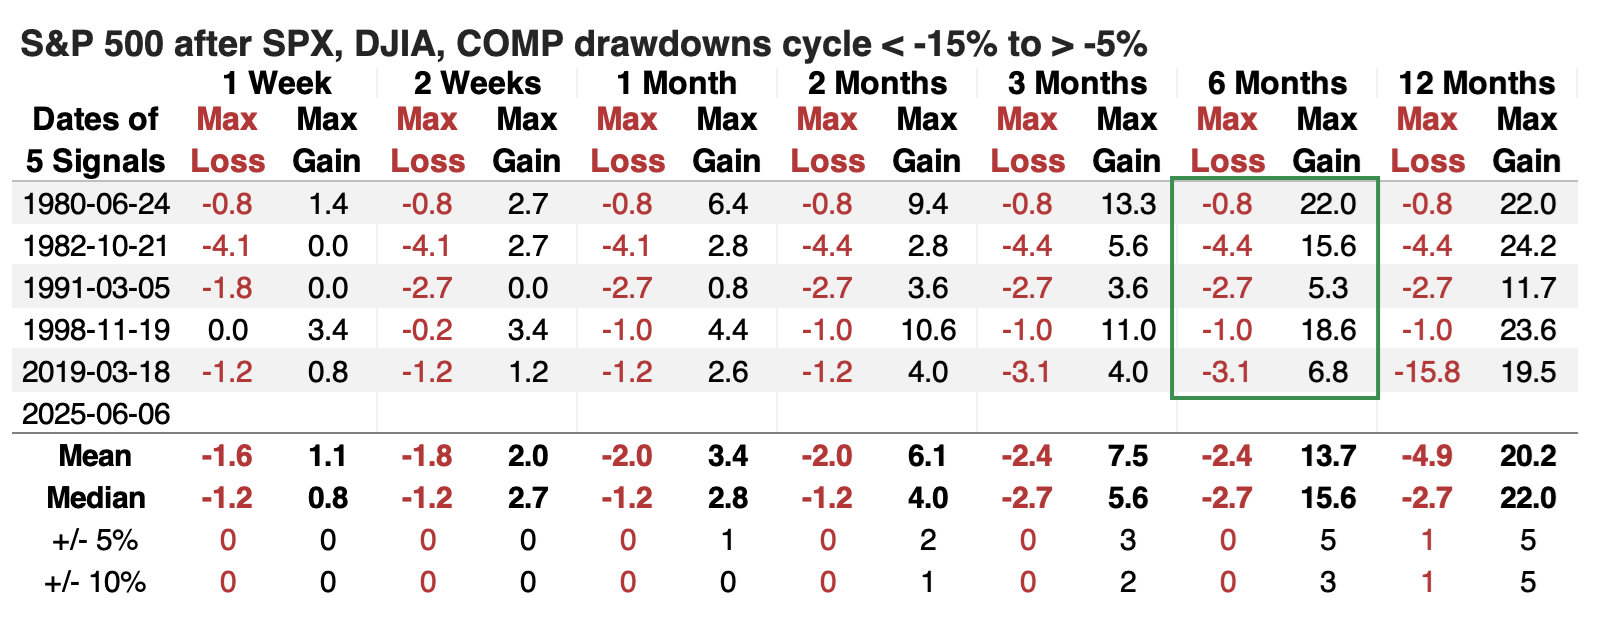
“Even more notable than its consistency was how little risk there was within the next six months. The S&P didn’t fall more than -4.4% at any point within that time frame across any of the signals (though, again, it’s a tiny sample size), while its maximum gain exceeded that in every instance.”
The bottom line is that while many narratives still suggest another “shoe will drop” any moment, the underlying technical recovery, breadth, and momentum indicate that it is not likely the case. As Sentiment Trader concludes:
“The fact that three of the most widely followed and benchmarked indices have already recovered most of their modest-to-serious drawdowns is also a positive sign. There haven’t been many times in the past 50 years when all three major indices recovered so quickly from such heavy selling pressure, which limits us. But the times it happened, it boded well for a further recovery. It was an especially good sign for the tech-heavy Nasdaq, reinforcing some of the other studies we’ve published in recent weeks.”
This doesn’t mean the market will not have short-term pullbacks and consolidations. However, those consolidations and pullbacks should be used to add equity exposure to portfolios. Be patient if you are underweight equities, and pick entry points opportunistically to reverse positioning.

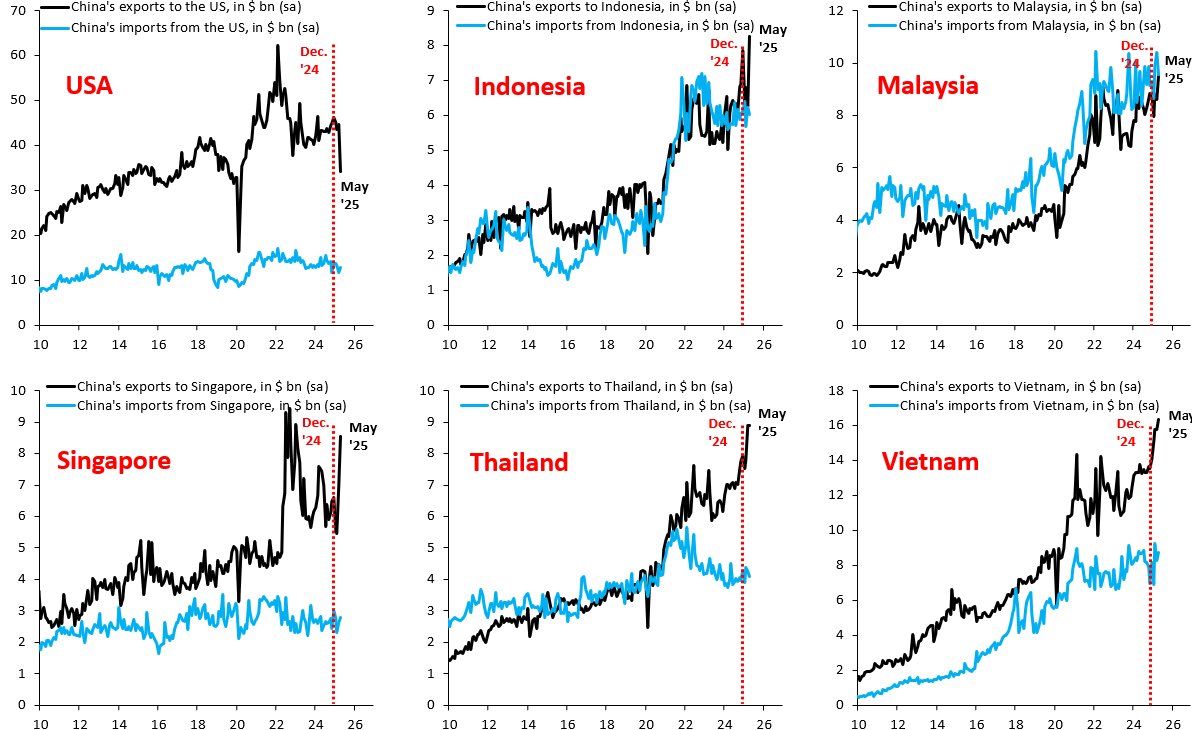
China Exports To The US Are Collapsing: Don’t Believe The Hype
The series of graphs below, courtesy of Robin Brooks from the Brookings Institution, shows how exports from Asia to the US have transformed due to tariffs. The easy, yet wrong, takeaway is that exports from China to the US are collapsing. At the same time, they are surging in Indonesia, Malaysia, Singapore, Thailand, and Vietnam. Given that these other countries also face hefty tariffs and there hasn’t been enough time for US importers to find new production facilities, what we are seeing is called transshipment. Essentially, China is shipping US-bound goods to the specified countries, removing the “made in China” label, and then exporting them to the US. Simply, China is not suffering as much as the graph suggests.
Deficits And The Tradeoffs Required To Fix Them
By falling significantly short of its intended savings goals, the DOGE program underscores the substantial challenges that hinder efforts to reduce federal spending and cut the deficit. Furthermore, its failure suggests that a more expedient way to reduce the deficit might be to increase federal revenue. Thus, we pose the simple hypothetical question: What if the government were to double taxes overnight?
While we do not support larger deficits or promote them, this article provides a better understanding of how fiscal deficits are part of a bigger picture, the tradeoff between private and public sector deficits and surpluses.
Your opinion on the fiscal deficit may change after reading this article.

Tweet of the Day
“Want to achieve better long-term success in managing your portfolio? Here are our 15-trading rules for managing market risks.”
Please subscribe to the daily commentary to receive these updates every morning before the opening bell.
If you found this blog useful, please send it to someone else, share it on social media, or contact us to set up a meeting.