


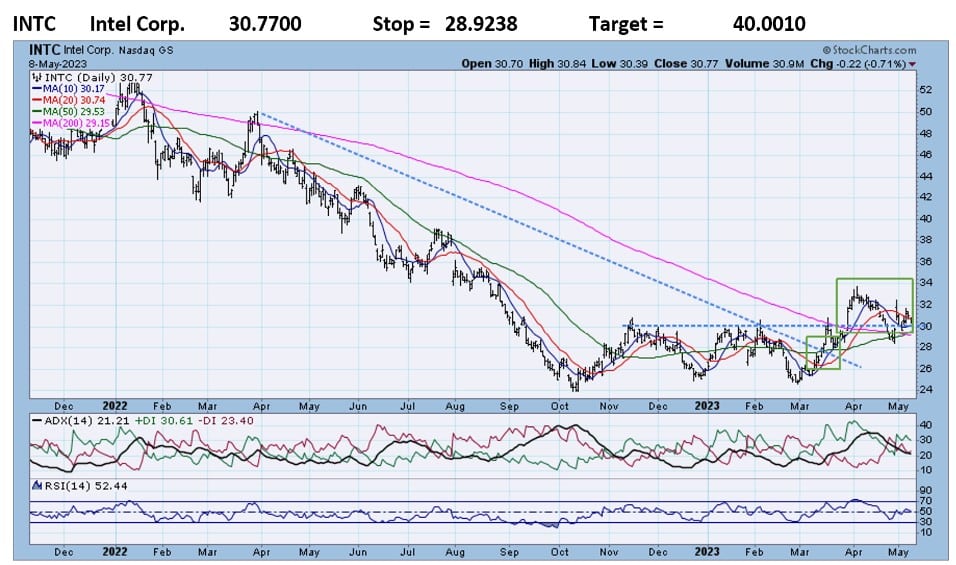
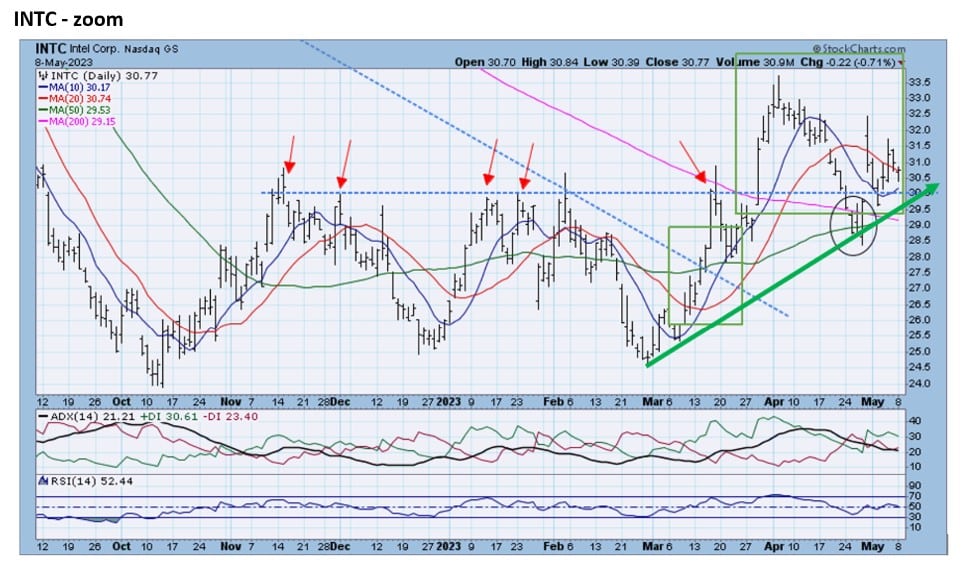
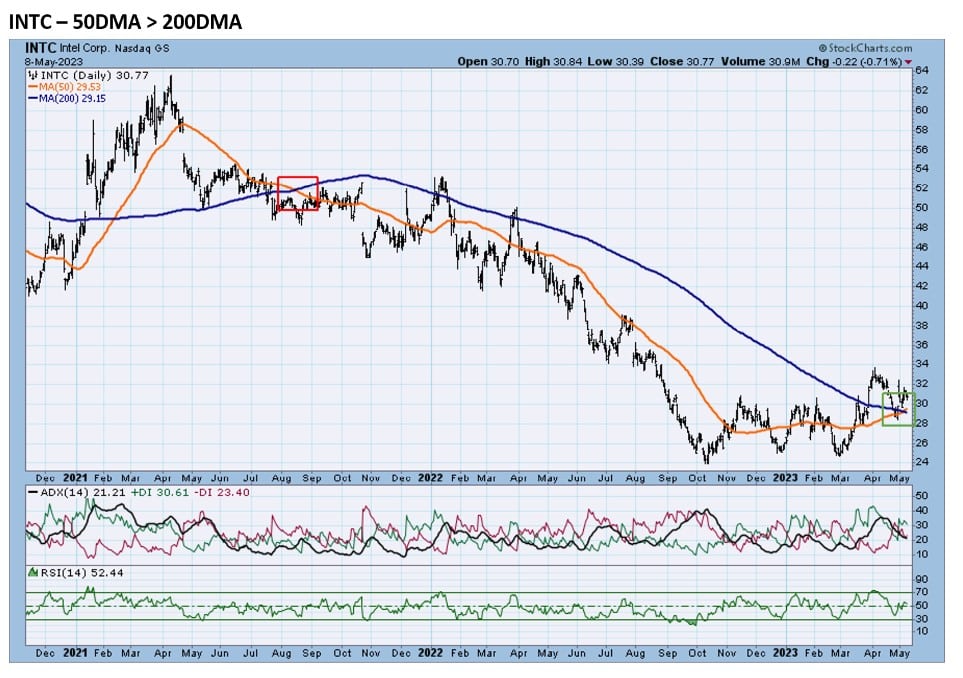
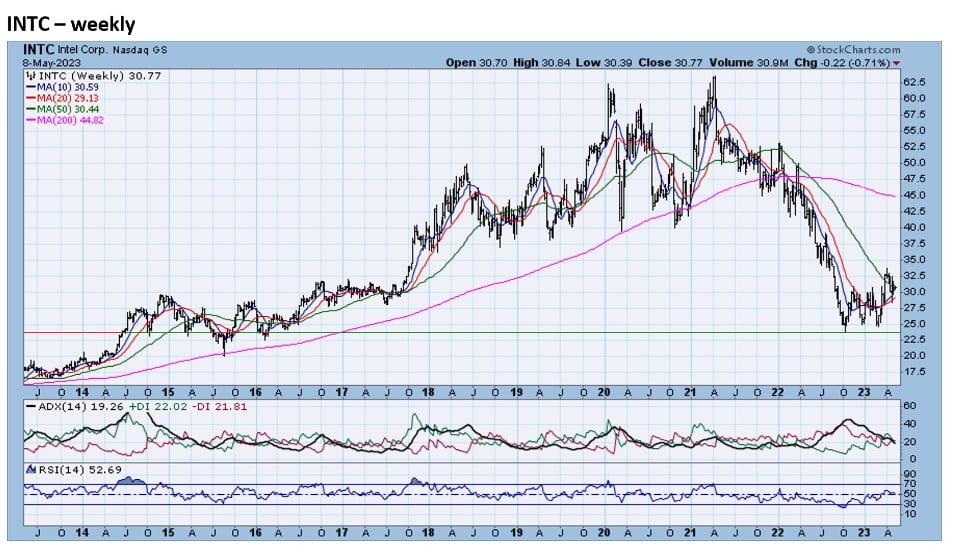
- INTC rose above its 12-month downtrend line in March and then moved above its 4-year resistance line at 30 (zoom chart). INTC is now at support from its 2-month uptrend line. Chart 3 shows that INTC’s 50DMA has moved above its 200DMA for the first time since August 2021. The 50DMA>200DMA is considered a long-term uptrend. The weekly chart shows that INTC has bounced off of long-term support in the mid-’20s.
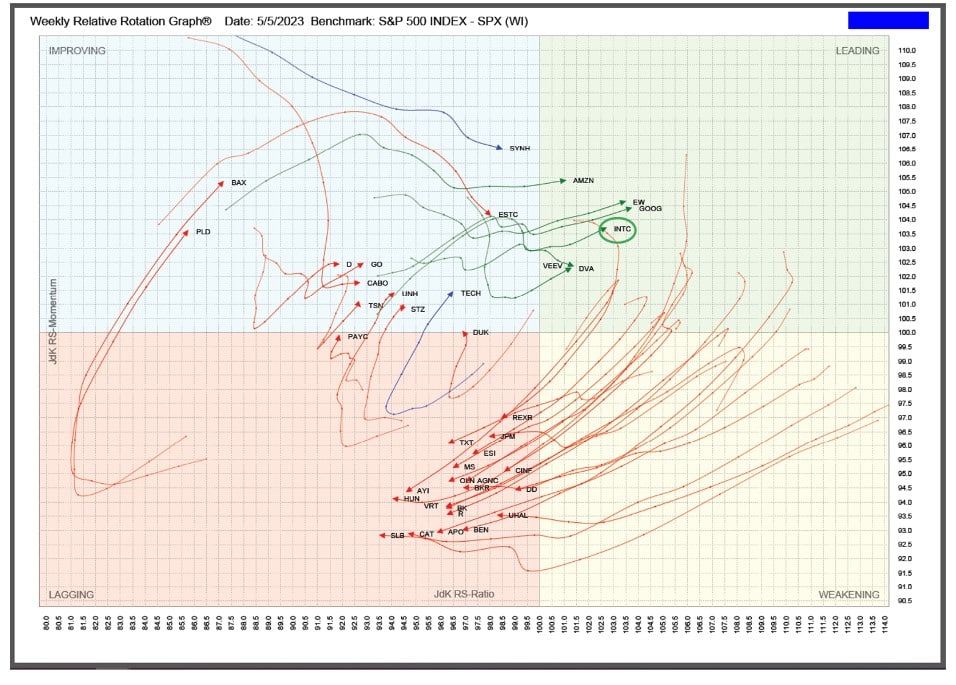
RRG analysis shows that INTC has moved into the Leading quadrant. INTC was ranked #2 out of the Russell 1000 in this week’s TPA-RRG report.
Relative Rotation Graphs (RRG) – explanation video


Jeff Marcus founded Turning Point Analytics (TPA) in 2009 after 25 years on trading desks and 13 years as a head trader to provide strategic and technical research to institutional clients. Turning Point Analytics (TPA) provides a unique strategy that works as an overlay to clients’ good fundamental analysis. After 10 years of serving only large institutions, TPA now offers its research services to mid and small managers, RIA’s, and wealthy sophisticated individuals looking for a way to increase their returns and outperform their peers.
Subscribe 2 Week Trial
Customer Relationship Summary (Form CRS)