


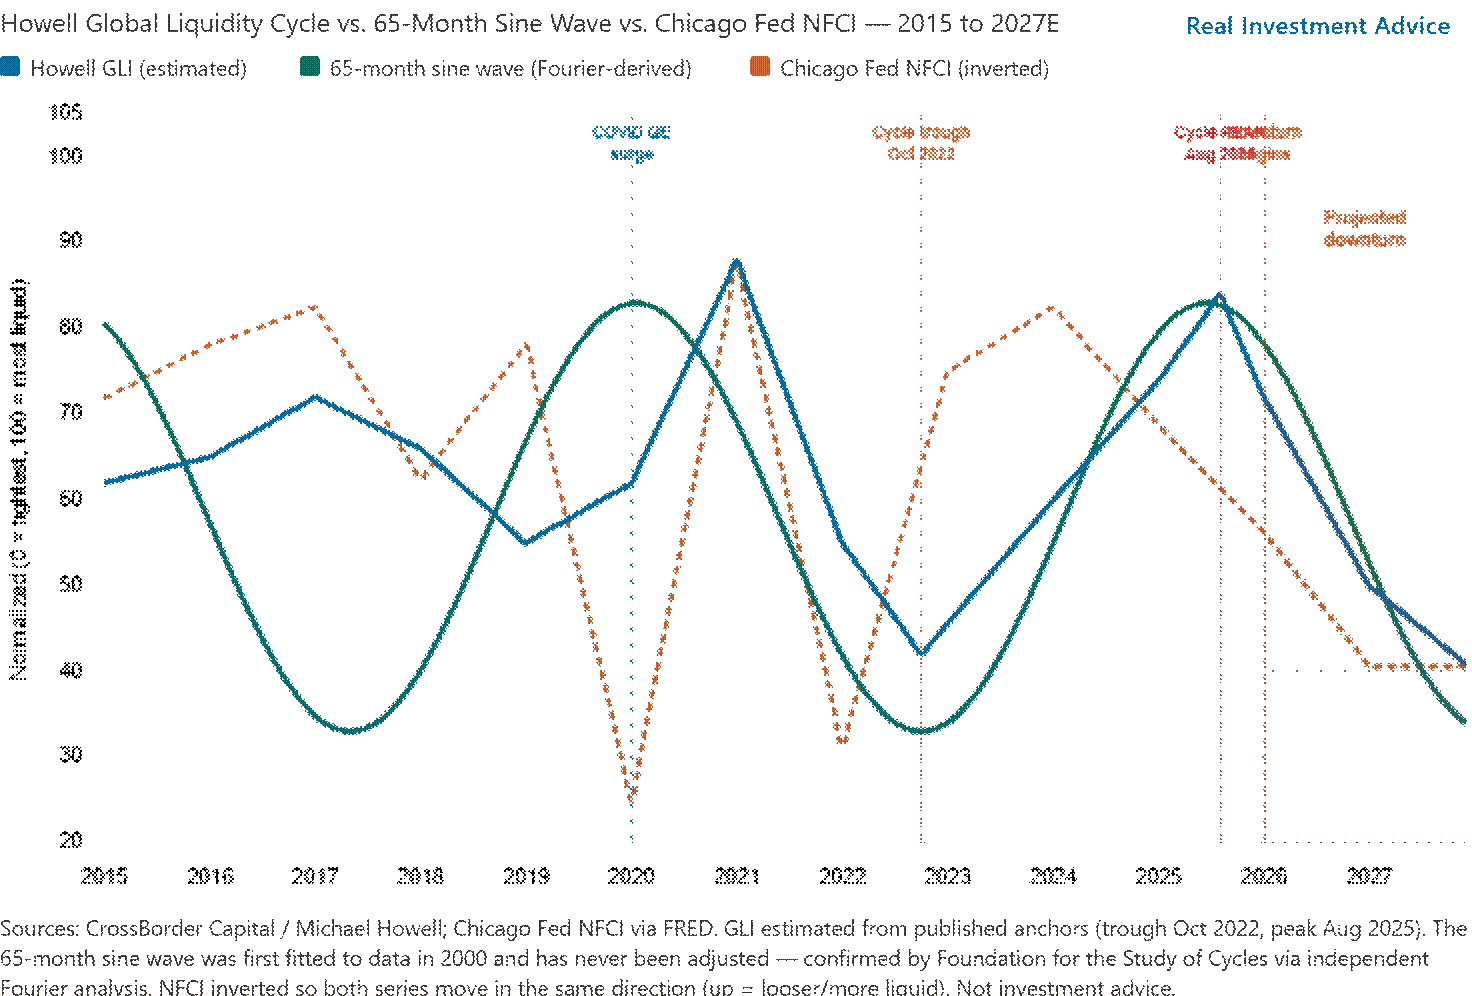
Michael Howell, founder of CrossBorder Capital, is one of the most followed global liquidity analysts. Howell’s Global Liquidity Index (GLI) often tracks closely to a 65-month sine-wave cycle that has tracked liquidity conditions well since 1965. As we share below, the 65- month cycle (green) bottomed in October 2022 and peaked in August 2025, exactly where his GLI (blue) predicted it would. Also shown, the Chicago Fed National Financial Conditions index (NFCI- orange) tends to align with the cycle and the GLI.
While there are many definitions of liquidity, Howell considers it the ability and willingness of credit providers to lend. His GLI captures factors such as central bank reserve injections, the US Treasury General Account (TGA) balances, cross-border capital flows, repo market conditions, collateral availability, and the dollar’s strength. Importantly, about three-quarters of all credit market transactions are estimated to be debt rollovers rather than new borrowing. Thus, measuring how easily and cheaply maturing debt can be refinanced is an important gauge of global liquidity.
The cycle is now pointing down into 2027. Howell projects $40 trillion in global debt rollovers by 2027, a $4 trillion increase from the previous year. That borrowing demand comes as liquidity contracts, creating a mismatch between refinancing demand and tightening financial conditions. Per his work, commodities, including gold, long-duration government bonds, cash, and defensive equities, tend to be among the best performers when the liquidity cycle falls. Conversely, more speculative and often leveraged assets such as crypto, small-cap stocks, emerging-market stocks, and private credit and equity tend to be among the worst performers.
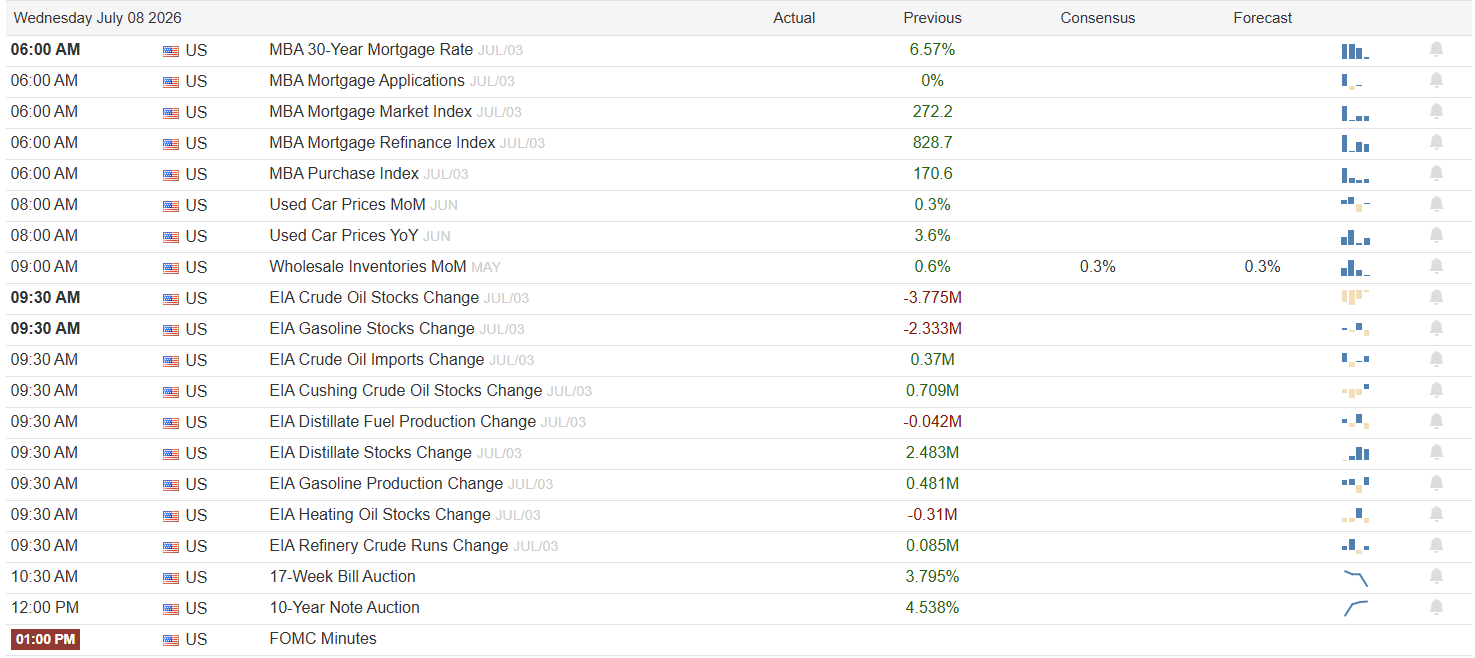
What To Watch Today
Earnings
- No earnings reports today
Economy
Market Trading Update
Yesterday, we covered Kevin Warsh using his Sintra debut to bury forward guidance, Forward Guidance: R.I.P. Today, back to a risk building quietly underneath a record tape. Leverage. Monday’s piece walked through which margin-debt gauges actually matter, and now the plumbing under that leverage has changed.
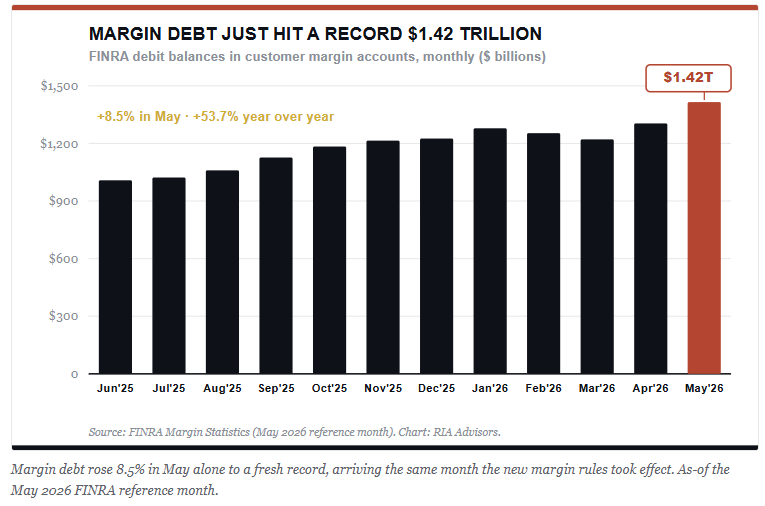
Start with the size of it. Margin debt hit a record $1.42 trillion in May, up 8.5% in a single month and better than 53% from a year ago. The dollar level always prints records in a bull market, so the level alone tells you little. The rate of change does not. A 53% annual jump is near the pace that outpaced the 2000, 2007, and 2021 tops.
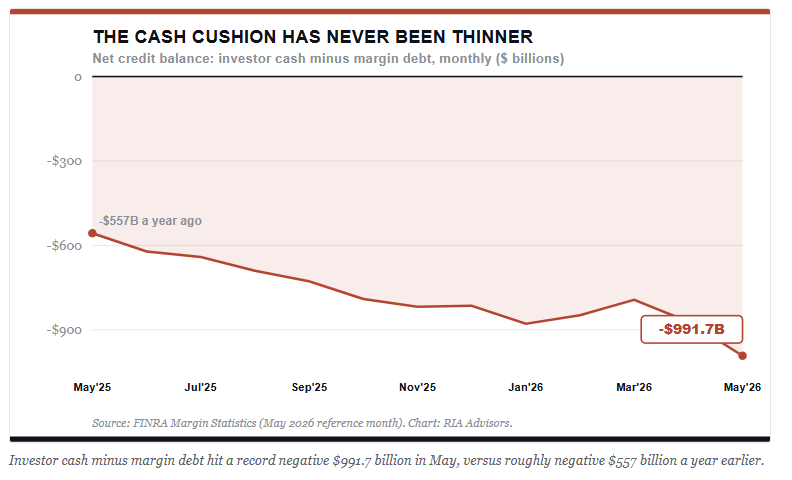
The other side of the ledger looks worse. The net credit balance, investor cash minus margin debt, sank to a record negative $991.7 billion in May. That is the thinnest cushion against forced selling on record, when a year ago it sat at negative $557 billion. Put simply, investors have never owed this much against the cash they actually hold.
Now, the change most investors missed. On June 4, FINRA scrapped the $25,000 pattern day trader minimum and the trade count, swapping them for a real-time intraday margin system. The old $2,000 floor to open a margin account still stands. The honest read is that the prior rule was a blunt wealth gate, and the new one is more risk-sensitive on paper. But the effect at a cycle peak is what counts. It lifts a brake on leveraged intraday trading for the smallest, most active accounts, and firms have until October 2027 to build the real-time monitoring meant to replace it. That does NOT cut leverage in the system. It lowers the friction on adding more, right when confidence runs highest.
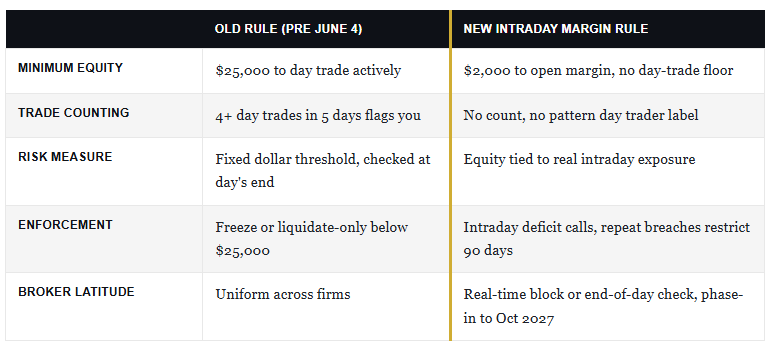
So here is the setup. Records on the screen, a record on the margin ledger, the thinnest cash cushion ever, and a rule that just made piling on easier. None of this times a market top. Margin debt tells you how much fuel is in the room, not when it lights.
What it does tell you is the size of the air pocket if sentiment turns, because leverage cuts both ways. We are holding equity exposure at target weight rather than above it, keeping quality high and dry powder ready, and managing risk at our stops instead of chasing the tape. Know how much of your own gain is borrowed before the market asks the question for you.

The First Half Chip Rally Reversal
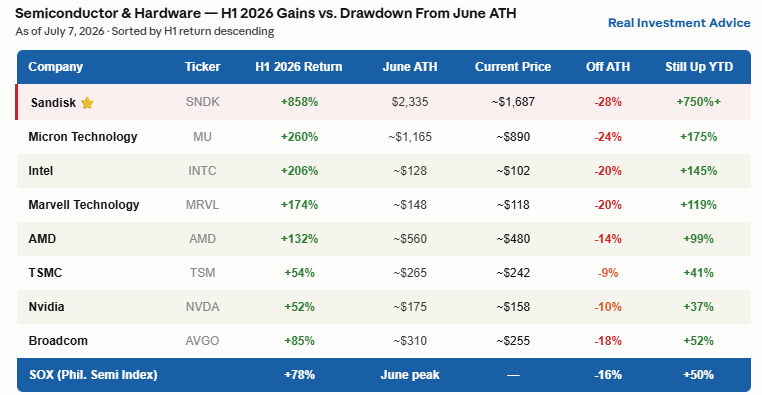
Many semiconductor and computer hardware stocks posted extraordinary first-half gains this year. For instance, Micron was up more than 260% through June, SanDisk was up by over 850%, and the broader semiconductor ETF SOXX had gained over 75% in the first half of 2026. That trade appears to be reversing. Interestingly, some blame Broadcom’s earnings announcement, in which its CEO chose not to raise the full-year AI semiconductor outlook. The truth is that the stocks had priced in so much future growth and were so grossly extended that any bit of bad news could have burst that bubble. Moreover, as we share in the Tweet of the Day, the massive profits and high margins in chip manufacturing and design will attract competition. We are already seeing that break the narrative.
Three forces are simultaneously driving the reversal: profit-taking after parabolic gains, valuation reality setting in as guidance stops beating expectations, and a broader market rotation back into value stocks and perhaps the hyperscalers. To wit, Jeff Kilburg of KKM Financial noted:
“The Great Rotation trade persists into Q3 as the blue boring names of the Dow Jones continue to attract inflows directly from recent profit-taking money from tech stocks.”
The bottom line is that this is not a fundamental collapse. It is what happens when stocks are priced for perfection for 2028-2029 earnings in 2026.

Tweet of the Day

New UPDATED Trading Rules With Desktop Printout
“Want to achieve better long-term success in managing your portfolio? Here are our 15-trading rules for managing market risks.”
Please subscribe to the daily commentary to receive these updates every morning before the opening bell.
If you found this blog useful, please send it to someone else, share it on social media, or contact us to set up a meeting.