


Current estimates predict the U.S. Treasury will raise between $600 and $700 billion once Congress increases the debt cap. Currently, the Treasury is drawing down its “checking account,” i.e., its Treasury General Account (TGA), as it can only replace maturing debt, not add new debt. The net result is that they are spending more than they are borrowing. Consequently, they are adding, not draining, liquidity from the financial system. Liquidity is nebulous and impossible to calculate to a tee. It’s even harder to compute how liquidity directly affects markets and how traders’ psychology about perceived liquidity affects markets. That said, it is an important determinant of market direction and worth exploring how the coming barrage of Treasury debt will affect liquidity.
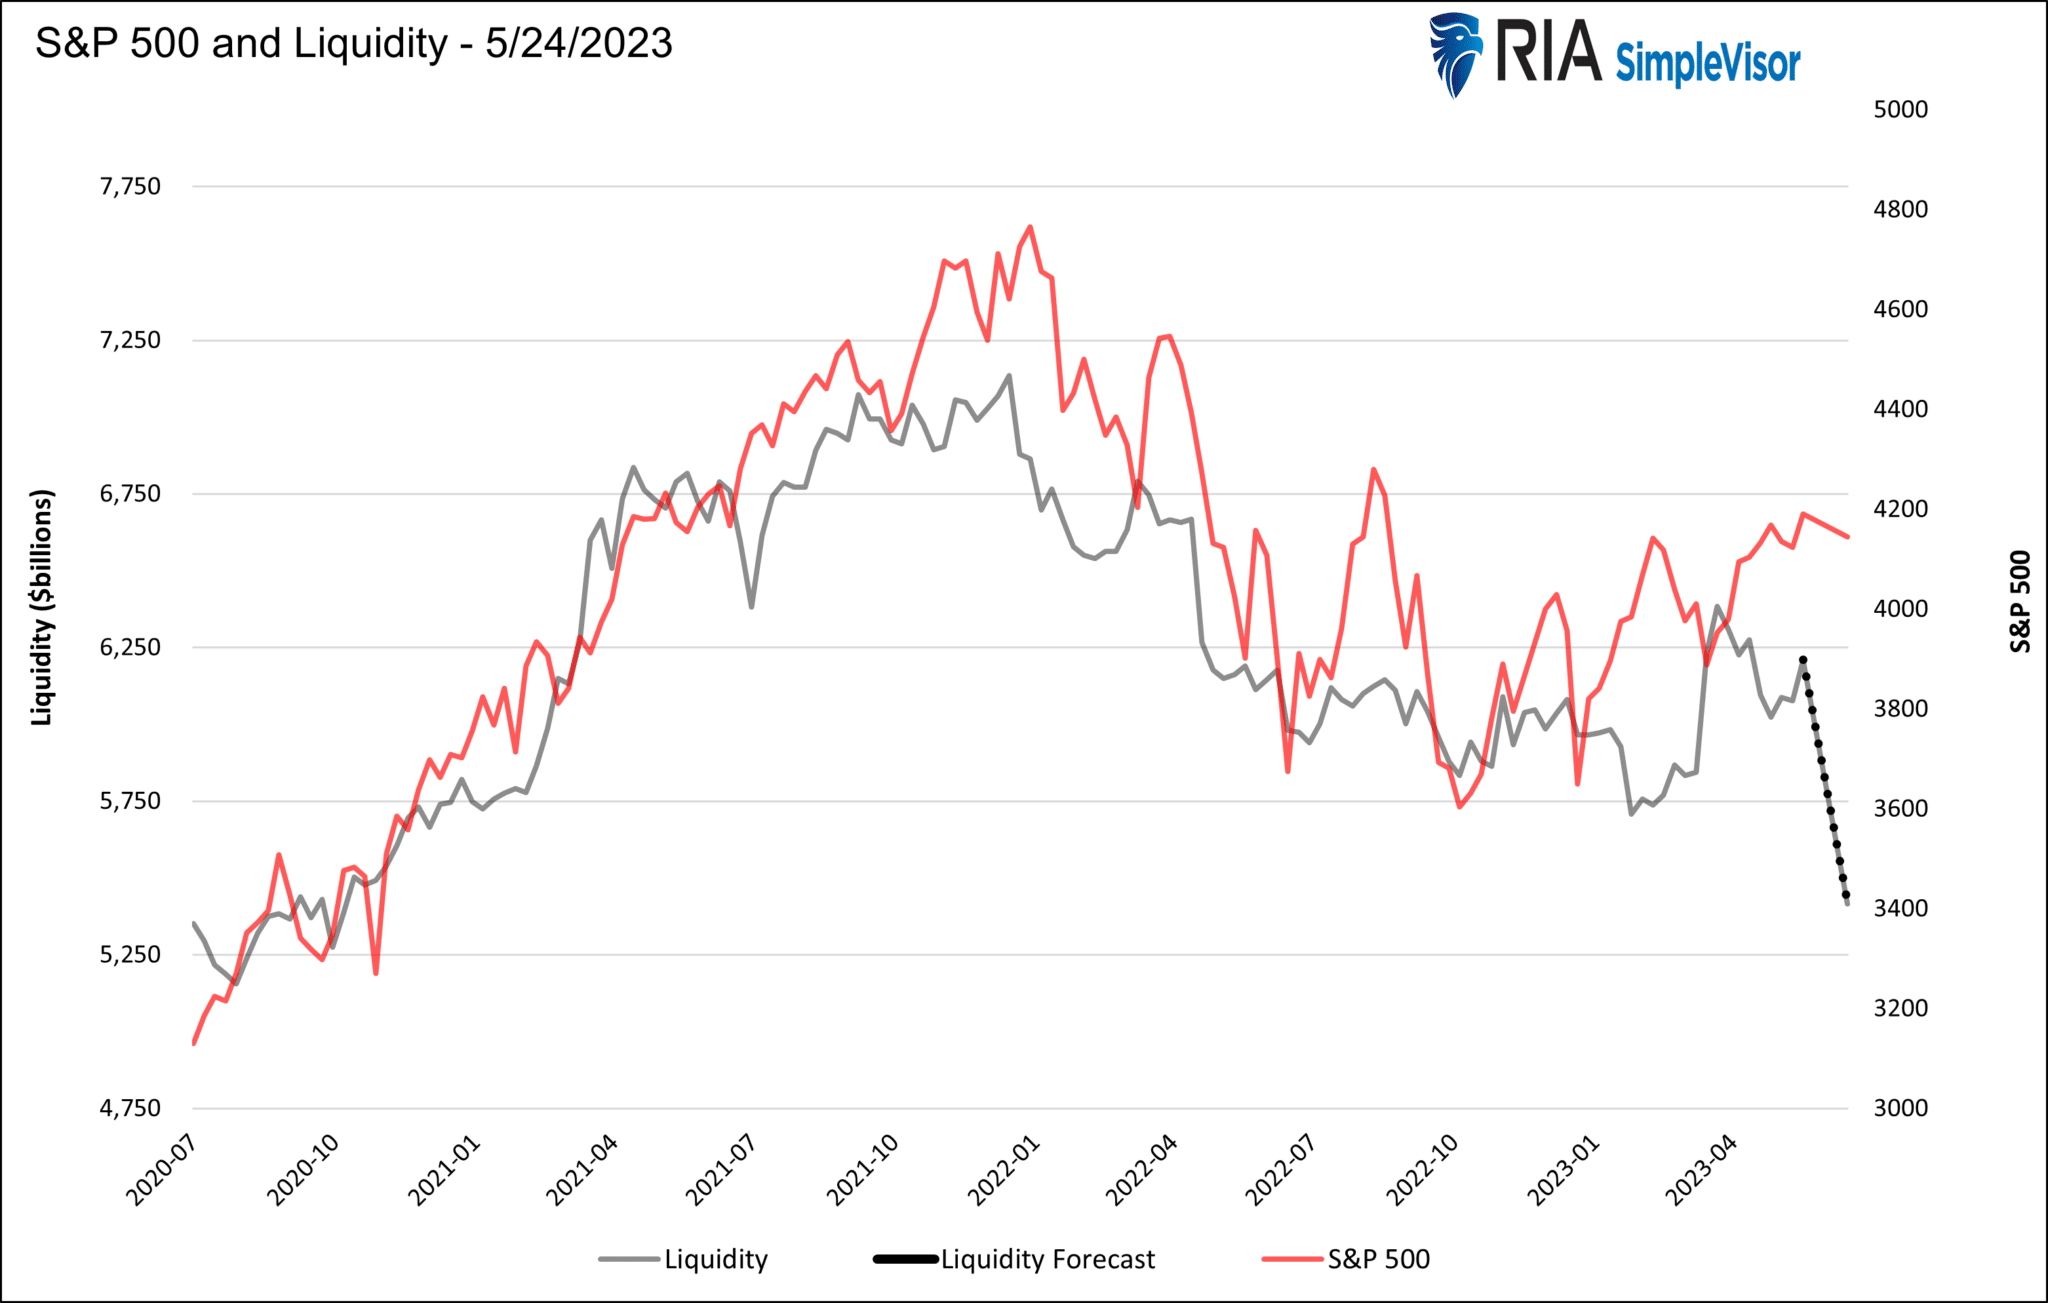
There are three significant components of liquidity. They are the Fed’s balance sheet, reverse repos transacted with the Fed, and the TGA. The Fed currently does $95 billion monthly of QT to drain liquidity. The reverse repo program has remained remarkably constant, not draining or adding liquidity. The drawdown of the TGA added over $500 billion of liquidity since January, mainly offsetting QT. Further, recent Fed bank lending programs also offset QT. The net result, as shown below, is liquidity increased this year. The coming Treasury debt issuance will become a substantial liquidity drain once the cap is increased, as shown below.
What To Watch Today
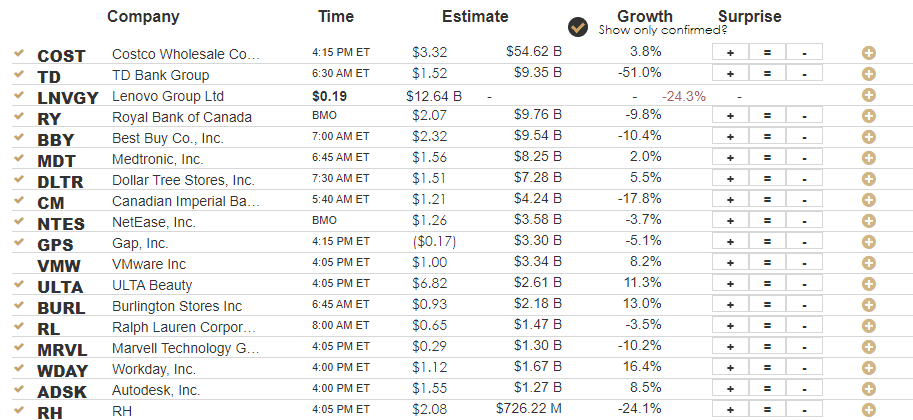
Earnings
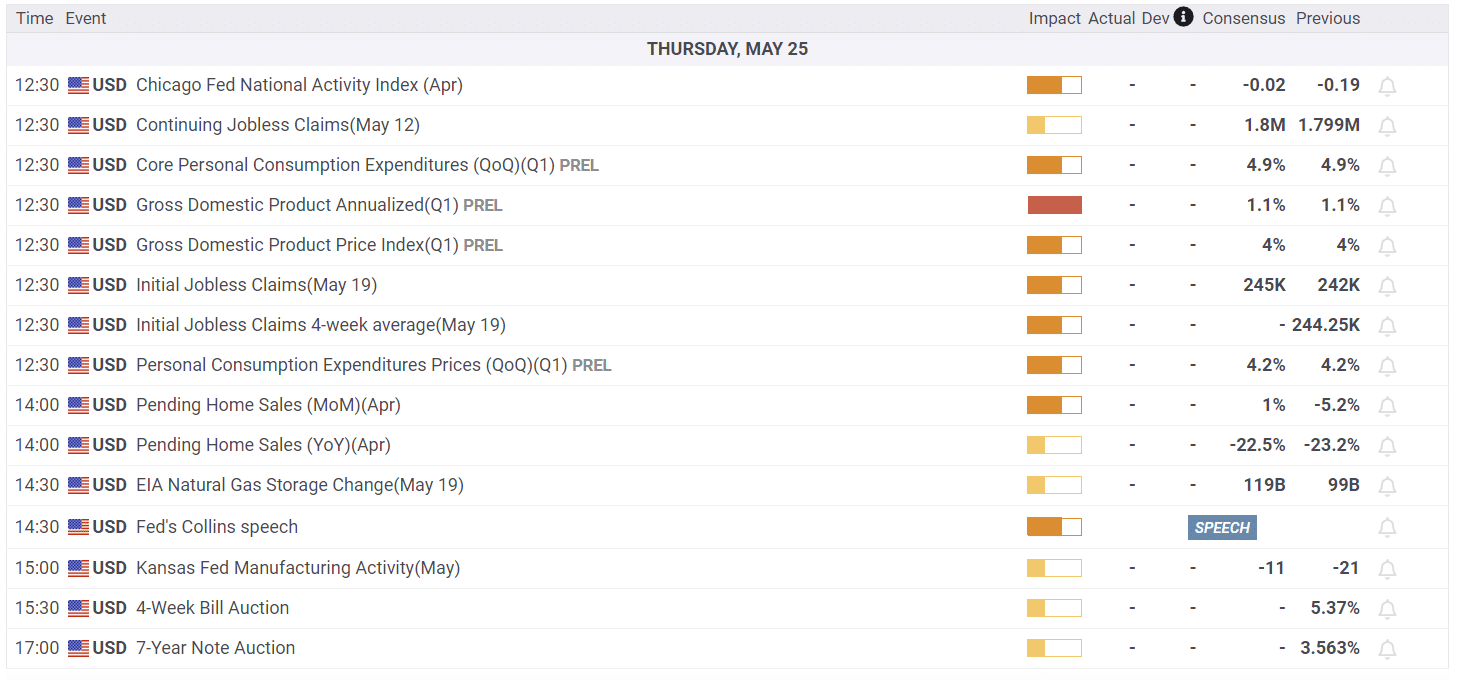
Economy
The following is an abbreviated excerpt from this coming weekend’s “Bull Bear Report.” (Click the banner below to subscribe for free email delivery.)
Could The Economy Avoid A Recession?
If you read or watch the media, the debate over a recession continues to rage. In one camp are those that are due to debt increases, surging interest rates, and a reversal of stimulus that a “hard recession” is inevitable. Others, especially those on Wall Street hoping for higher equity prices, suggest that “no recession” is likely and why earnings will begin to rise again. Then there is the possibility of a “soft recession,” where the economy does slow but does lead to a sharp increase in unemployment or a dramatic decline in equity prices.
Let me state that I do NOT know the answer. We can only evaluate the data as it comes in and manage portfolios according to the risks we are willing to accept.
However, with that said, some evidence supports the “soft recession” scenario. A recent precedent for such an economic outcome was in 2011. Interestingly, during that period, the world faced a manufacturing shutdown in Japan due to an undersea earthquake creating a tsunami that flooded Japan and sparked a nuclear meltdown. At the same time, the U.S. was entrenched in a debt ceiling debate, a downgrade of the U.S. debt rating, and threats of default. Given the combination of events, and the dependence on Japanese suppliers, the economy’s manufacturing sector contracted, convincing many of an impending recession.
However, as shown, that recession never happened.
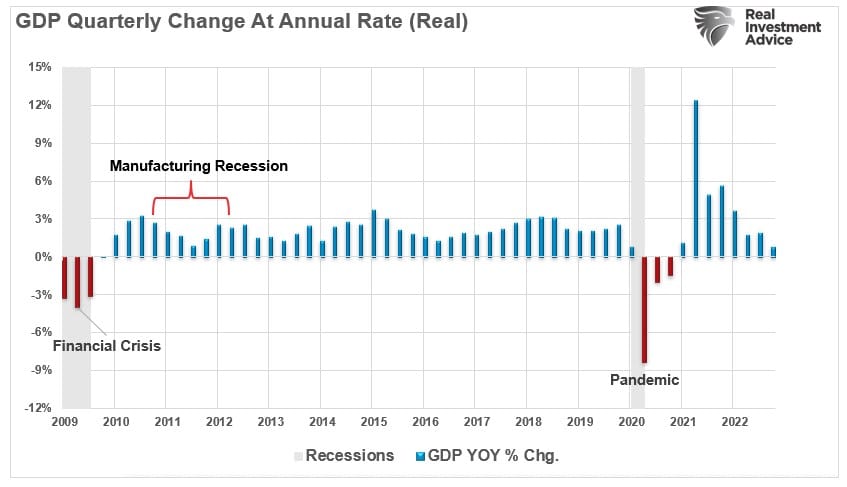
The reason was that the service sector of the U.S. economy remained strong enough to keep the economy afloat until the debt ceiling issue was resolved and Japan returned online. Unlike in the past, where manufacturing was a large component of economic activity, today, services comprise nearly 80% of each dollar spent.

This isn’t the first time we have seen the manufacturing side of the economy contract, but services remained robust enough to keep the overall economy out of recession. As shown, when the economy’s manufacturing side contracts while services remain expanding, the economy had a “soft recession.” The 1998, 2011, and 2015 periods are the most recent examples.
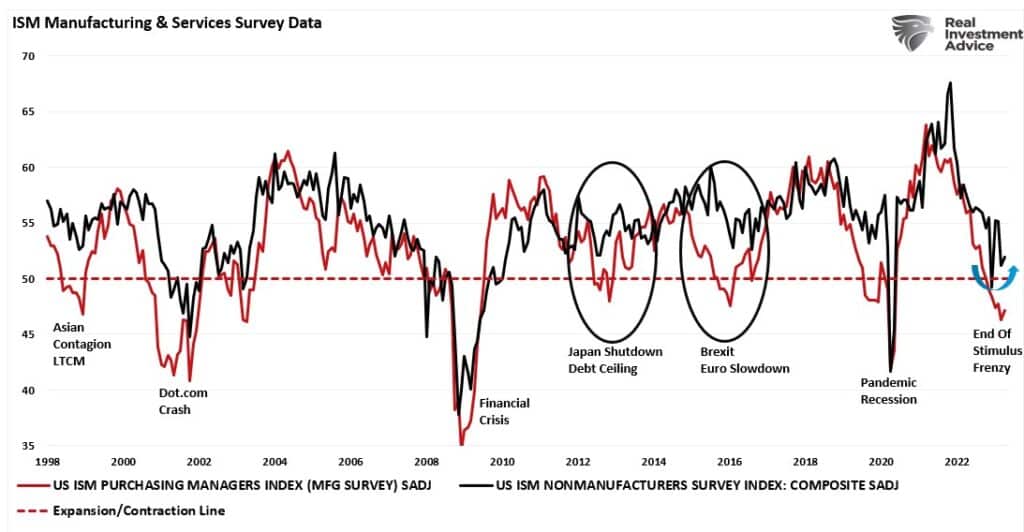
Of course, there are some important differences between today and 2011. In 2011, Inflation was low, the Fed funds rate was zero, and Ben Bernanke was providing additional accommodative monetary conditions through “Operation Twist” Today, inflation is running at 5%, the Fed funds rate is 5%, and the Fed is removing accommodative monetary conditions through “Quantitative Tightening.”
Read the rest of the analysis this weekend.

Trucking Continues to Point to a Recession
Last week JB Hunt Transportation Services (JBHT) warned that the freight trucking sector was slowing down. JBHT’s President said: “Simply stated, we’re in a freight recession.” UPS echoed their sentiment on Tuesday.– April 27 Commentary
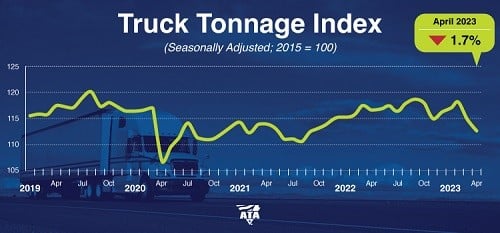
The quote above led our Commentary a month ago. The American Trucking Association (ATA) is now echoing those concerns. Per ATA’s chief economist Bob Costello-
While the broader economy continues to surprise and thus far stave off an expected recession, the freight economy is starkly different. The goods-portion of the economy is soft and as a result, even contract truck freight is now falling, albeit not nearly as much as the spot market. The tonnage index hit the lowest level since September 2021 in April and has now fallen on a year-over-year basis for two straight months.
Freight and shipping have always been excellent leading indicators of economic activity. Hence, will the warnings above again prove prescient, or will strength in the services industries offset said weakness?
Another Instance of Steep Valuations
Equity valuations are high. As investors, we can digest that in different ways. For instance, some investors will say yes, they are high but can go higher. The dot com bubble proves that is undoubtedly true. Others may say that high valuations portend lower returns over time. Such is also true, but timing a valuation normalization can be trying. Lastly, some investors will claim that most valuation measures do not account for future earnings growth. There is one method that does and is worth exploring.
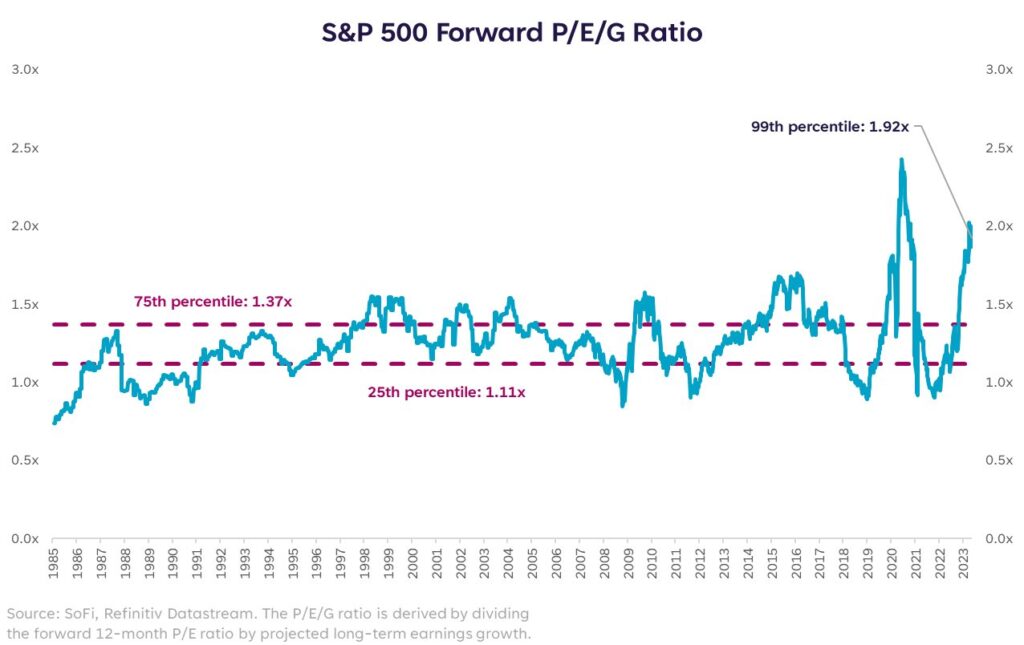
The S&P 500’s fwd P/E/G ratio is the forward P/E ratio divided by expected earnings growth. At its current level, the ratio dwarfs 2000 levels and is nearing mid-2020 levels. Liz Young, Head of Investment Strategies at Sofi, explains:
After that peak, earnings and growth expectations surged due to stimulus and reopening, bringing this ratio down. Not sure we can expect the same now…stocks look expensive by this metric.
The Long-Term Case for Energy Stocks
In a recent SimpleVisor Five for Friday article, in which we scanned for five stocks based on a theme, we highlighted the energy sector. In particular, we wrote:
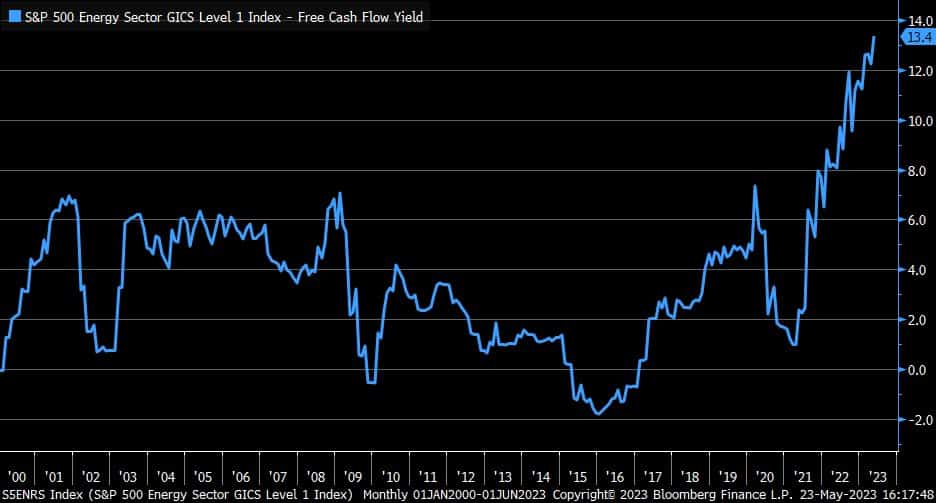
As the push for a green-energy transition gains popularity, producers of traditional fossil fuels have a disincentive to invest in production growth. Coupled with recently surging profits and attractive money-market rates spurred by the Fed’s fight against inflation, major energy companies are building sizable cash piles…. This week’s screen attempts to find large energy companies with a high potential for returning capital to investors through share buybacks.
One of the essential factors in the scan was the ratio of price to free cash flow, also known as free cash flow yield. Free cash flow measures how much cash a company has after paying all of its expenses and capital expenditures. Rising profits and slowing capital expenditures leave the energy industry with an extremely high cash flow yield. Some of this extra cash flow will be returned to shareholders via buybacks or dividends.
Tweet of the Day

Please subscribe to the daily commentary to receive these updates every morning before the opening bell.
If you found this blog useful, please send it to someone else, share it on social media, or contact us to set up a meeting.
Post Views: 3
2023/05/25