


Looking back at what drove asset prices is a crucial part of the forecasting process for 2023. In hindsight, it’s obvious the Fed’s monetary policy stance and policy expectations were the critical determinants of asset prices. To reduce inflation, the Fed raised the Fed Funds rate by 4.25% and reduced its balance sheet by over $400 billion. Both higher rates and reduced liquidity weighed on stocks and bonds throughout the year. Looking back, stock rallies were supported by investor hopes the Fed would stop hiking and pivot. Hawkish Fed rhetoric and projections for higher rates for longer fueled the selloffs.
The Fed is trying to cut consumer demand to bring inflation back to 2%. Therefore, they think they must weaken the labor market to accomplish this. Looking back at many Fed statements and speeches, the Fed acknowledges they might trigger a recession to meet its goals. Will we have a recession in 2023? No one knows, including the Fed or the brightest on Wall Street. However, we do know that Fed actions work with long lag times. The full effect of rate hikes and QT has yet to be felt.
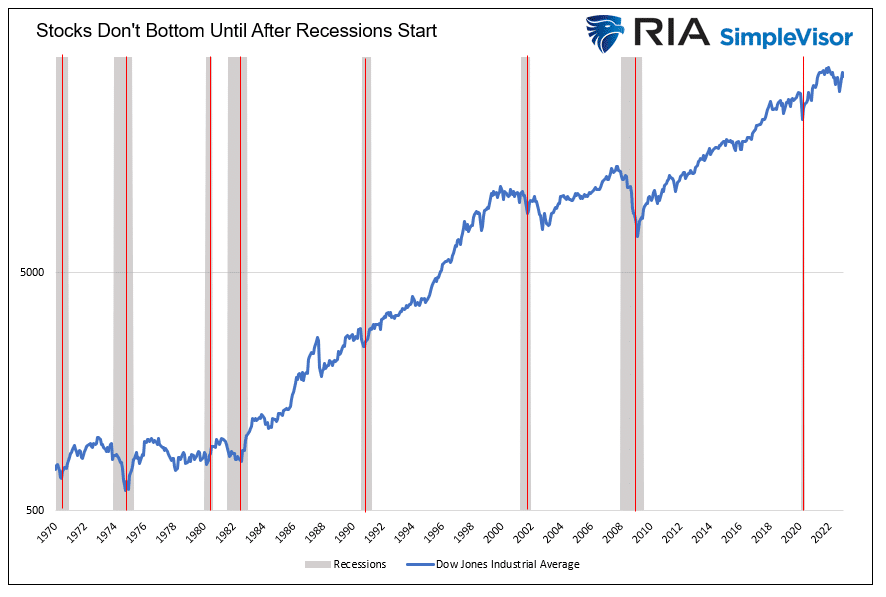
If inflation normalizes without a recession, stocks and bonds may do well. But, if a recession occurs, likely, stocks have not bottomed yet. As we share below, stocks never troughed until a recession started. Bonds in a lower inflation and growth environment should perform well as yields decline.
What To Watch Today
Economy
- 9:45 a.m. ET: S&P Global Manufacturing PMI, December Final (46.2 expected, 46.2 prior)
- 10:00 a.m. ET: Construction Spending, month-over-month, November (-0.4% expected, -0.3% prior)
Earnings
- No notable earnings releases today.
Market Trading Update
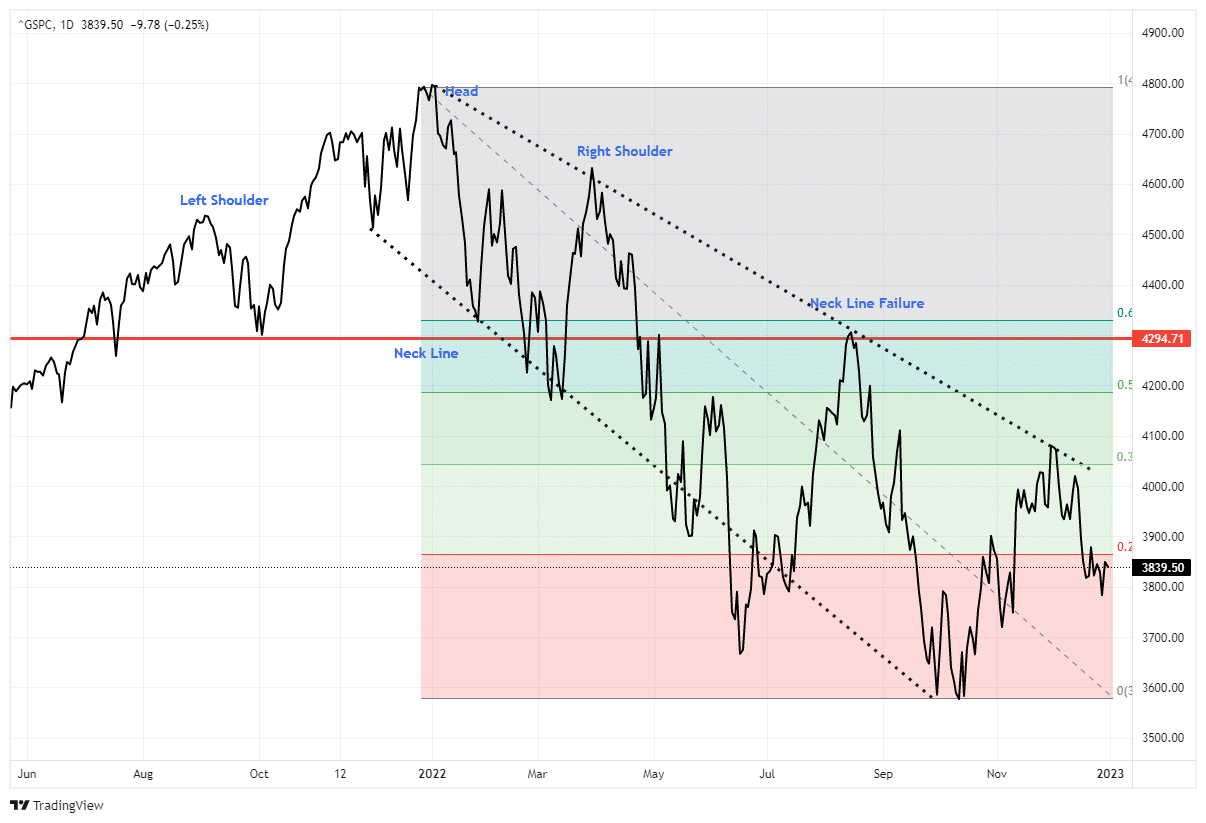
This morning, futures are set to open decently higher to kick off the New Year. The question will be whether or not the rally can stick throughout the day. There are reasons to be optimistic heading into the first couple of days of January as 401k’s, pensions, etc. get a boost from inflows. However, the market remains trapped in a very defined downtrend after completing the “head and shoulders” topping formation last year.
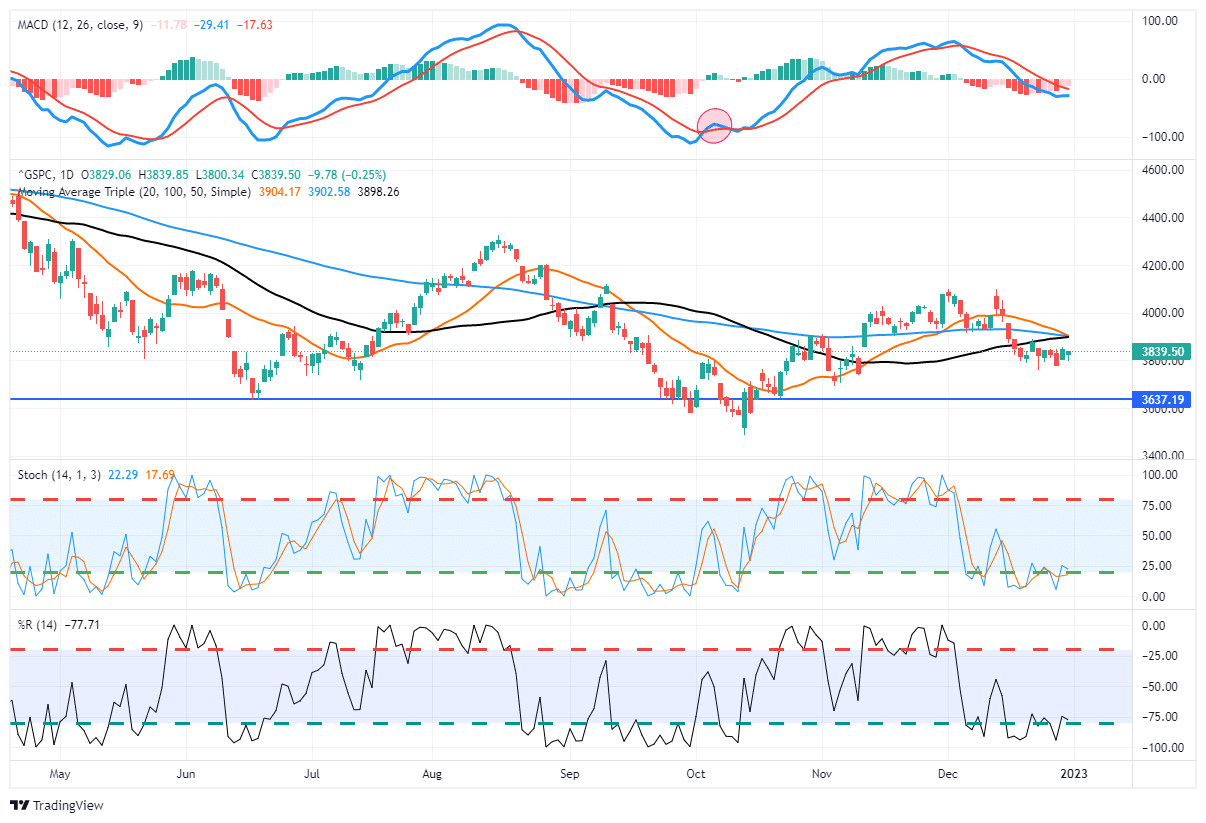
The market is oversold enough on a short-term basis for a rally. However, there is tremendous overhead resistance, with multiple moving averages sitting just above the current price. Also, the MACD signal, which provided great guidance last year, remains on a “sell signal.” We are entering the year with a significantly overweight cash position and severely underweight equities and are maintaining a very short-duration bias in our bond holdings.
The Week Ahead
2023 kicks off with a slew of employment data. JOLTs, on Wednesday, will inform us of the number of job openings, a key component in measuring the tightness of the labor market. The ADP report on Thursday and the BLS data on Friday are expected to show continued relatively strong job growth. Within the labor data, investors will also key on wages and hours worked as the Fed has mentioned their importance to the current bout of inflation.
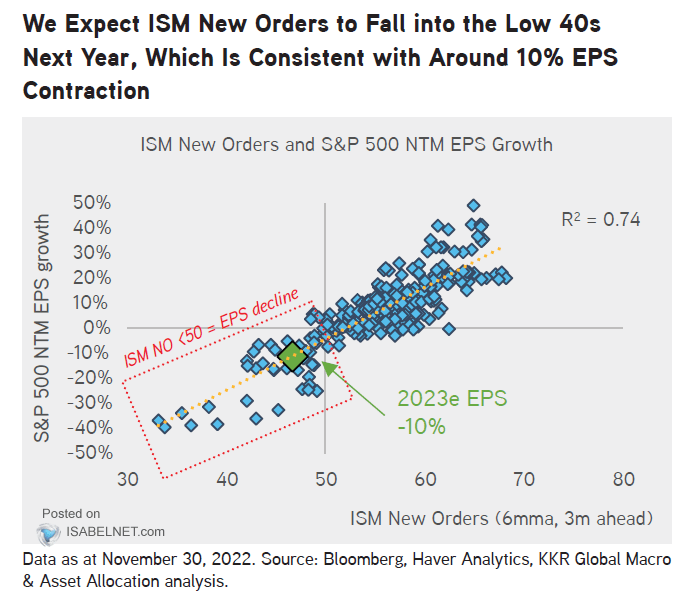
ISM will release its manufacturing survey on Wednesday. Last week’s Commentary discussed the robust correlation between ISM New Orders and corporate earnings. Per the Commentary:
The scatter plot shows a robust correlation (r2=.74) between ISM New Orders and EPS growth. ISM New Orders fell to 47.2 in the latest report, as shown in the TradingEconomics graph. Per the correlation, we should expect -10% EPS growth next year. If New Orders fall to the low 40s, as is typical in a recession, a negative EPS growth of 30% to 50% should be expected.
Looking Back and Ahead
In late 2021, the median S&P 500 forecast from Wall Street was 4,825 (per Bloomberg). The range of these forecasts was 5300 to 4400. Even Wall Street’s biggest bear, Michael Wilson of Morgan Stanley, overestimated returns by about 15%. The range for 2023 is 4750 to 3400, with a 4075 median. What will 2023 bring? We guess that, once again, Wall Street will be proven wrong.
We think a recession is probable, and if so, earnings will likely fall well short of expectations. In Valuation Math Suggests Difficult Markets in 2023, Lance Roberts makes a case that lower earnings and normalized valuations might result in a continuation of the 2022 bear market.
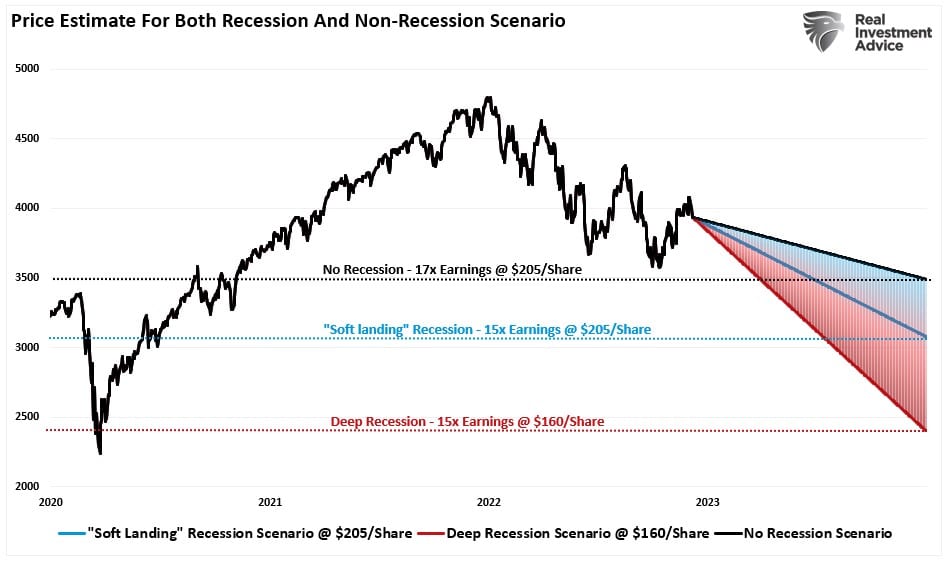
While we do not subscribe to the Goldilocks scenario many on Wall Street are pushing, we keep an open mind. Lance follows the graph above with the following:
We would be remiss in not giving some assessment for a bullish outcome in 2023. However, for that bullish outcome to take shape, we must consider several factors.
- We assume the $205/share in year-end estimates remains valid.
- That the economy avoids a recession even as inflation falls
- The Federal Reserve pivots to a lower interest rate campaign.
- Current valuations remain static at 22x earnings.
In this scenario, the S&P 500 should rise from roughly 4000 to 4500 by the end of 2023. Such would imply a 12.5% gain for the year. However, such would not recoup the losses from the market’s peak in 2022.
If the last three years taught us anything, expect the unexpected!

Tweet of the Day

Please subscribe to the daily commentary to receive these updates every morning before the opening bell.
If you found this blog useful, please send it to someone else, share it on social media, or contact us to set up a meeting.