


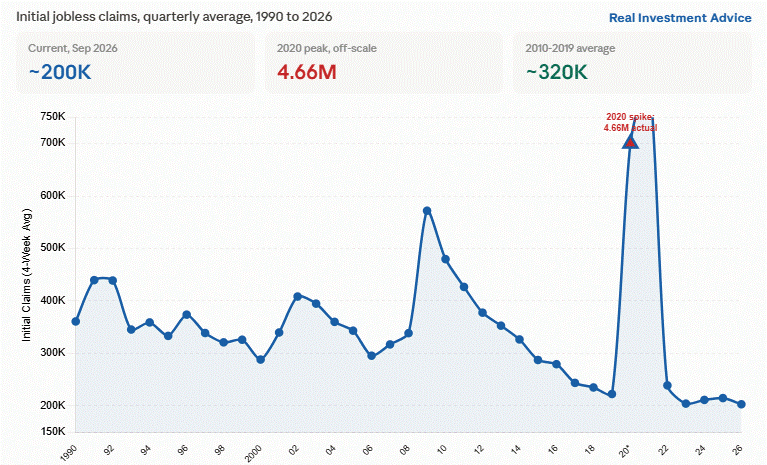
To justify hiking rates, Kevin Warsh and the Fed painted a rosy picture of the labor market. Interestingly, Warsh did so by citing record low jobless claims. To wit:
Unemployment claims, on a four-week moving average, are running at levels consistent with full employment. So, the labor side of the Fed’s congressional remit is in good shape.
Jobless claims are near historic lows, as shown below, and the news is even better as a percentage of the consistently growing labor force. However, treating them as proof the labor market is healthy is misleading. Jobless claims only measure layoffs. They say nothing about hiring. While jobless claims may signal that few people are being fired, they don’t tell you whether people are being hired. Consider that the JOLTS Hires level is at a 12-year low, and sits at the same level today as it was in 2014, when GDP was nearly half of what it is.
Economists deem this condition the “low-hire, low-fire” labor market, and the Cleveland Fed’s research bluntly calls it “half a misnomer.” The low-fire half is accurate, but the low-hire half is the part Warsh skipped.
Indeed’s Hiring Lab put the risk of this frozen labor market as “it’s only stable as long as nothing pushes on it.” The lack of hiring leaves no cushion if layoffs increase. In addition to fewer layoffs depressing the jobless claims data, we must also consider the lack of incentive to file for jobless claims. Per our Commentary in 2024:
Bloomberg estimates that the average wage coverage gap is bigger than ever at $1,400. Simply, unemployment claims payouts have not kept up with inflation. On the contrary, gig/part-time jobs have. Therefore, laid-off workers are better off working for Uber and other flexible gig economy jobs than filing claims.
What To Watch Today
Earnings
Economy
Market Trading Update
The bulls maintained control this past week, despite significant volatility and bearish headlines. The S&P 500 ended the week at 7,637.76 in index terms, which is not far off from where it started. The Fed’s rate hike knocked the index down toward 7,585 midweek before Thursday’s and Friday’s rebound reclaimed the ground. The index still sits above both its rising 50-day and 200-day moving averages, so the primary uptrend that carried the tape to record highs all year remains intact, for now. What changed this week is not the trend. It is the conviction beneath it.
Despite that, our overriding concern remains both breadth and momentum. While the market rolled over hard into Wednesday’s FOMC decision, the late-week snapback kept the weekly candle from closing ugly. Many will overlook last week’s price action, but it’s the fingerprint of a market losing its footing at the highs rather than one breaking out from them.
As noted, we also remain concerned about breadth, which thinned as well this past week. With the banks and the rate-sensitive groups taking the brunt of the hit this past week, it was technology, AI-adjacent sectors, and the megacap complex that kept the market afloat. As we have noted many times before, when leadership narrows to a handful of names while the average stock struggles, the tape is more fragile than the index level would suggest. The weekly range was the widest in more than a month, the kind of expansion that tends to arrive at inflection points rather than in the middle of trends.
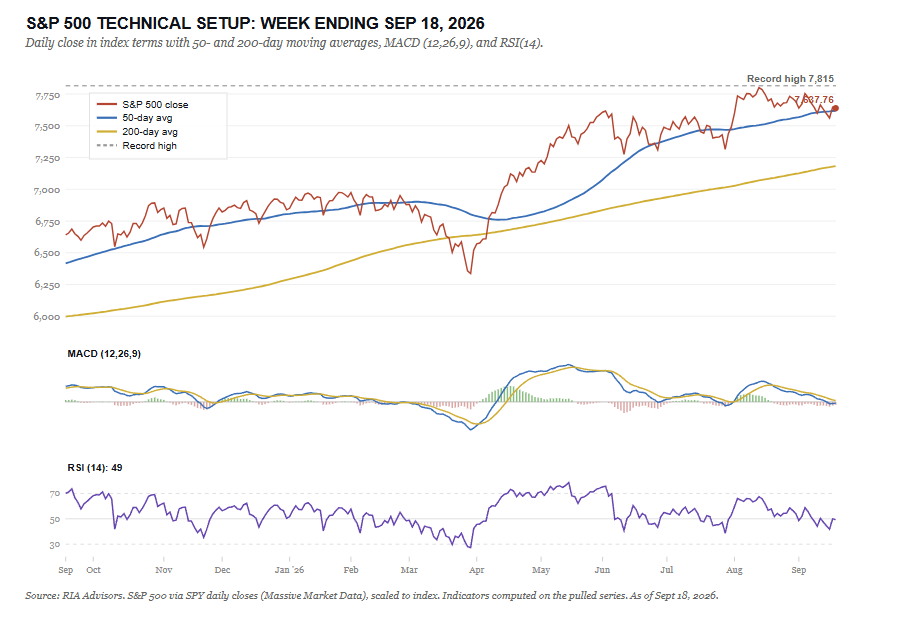
So, what does this mean for investors heading into this week as we begin to wrap up the third quarter? First, the levels that matter to investors are very close by. Resistance sits at 7,650, and then the round 7,700, the zone the rally must reclaim to prove Friday was more than a reflex. Support runs first to 7,585, Wednesday’s reaction low, and a failure there opens 7,500 and then 7,400, where the rising intermediate averages come into play.
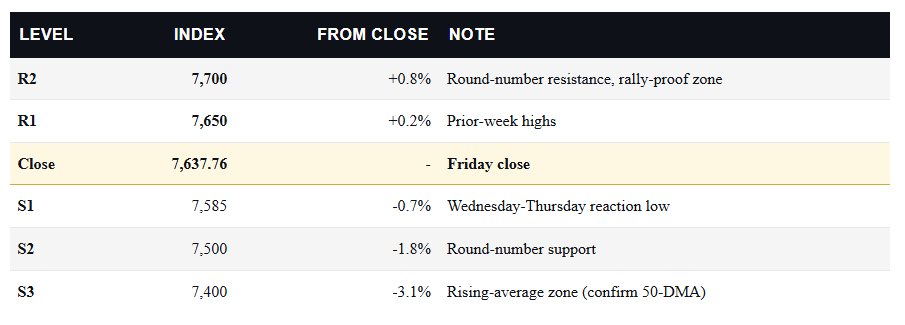
For shorter-term investors and traders, the market setup argues for patience over conviction. I say that because the current backdrop does not provide the proper entry to chase risk. However, if the market can rally toward overhead resistance levels (7,650 and 7,700), trimming exposure and raising stops seems the most logical course of action, rather than adding exposure. For now, with the 10-year pinned at 5%, a rejection at that level seems the higher-probability outcome.
With that understanding, we would only suggest adding exposure if the market makes a decisive break and holds above 7,585, with improving breadth. Lastly, consider sizing positions for two-way volatility, which has been the case as of late, and keep stops tight beneath any reaction low. A defined-risk hedge here costs little, and it earns its keep the moment 7,585 gives way.
The most important level to watch is 7,585. If the bulls can defend that level, then the record-high structure survives to fight another week. If they lose it, the burden of proof shifts to the bulls, with 5% yields and a hawkish Fed offering them little help.

The Week Ahead
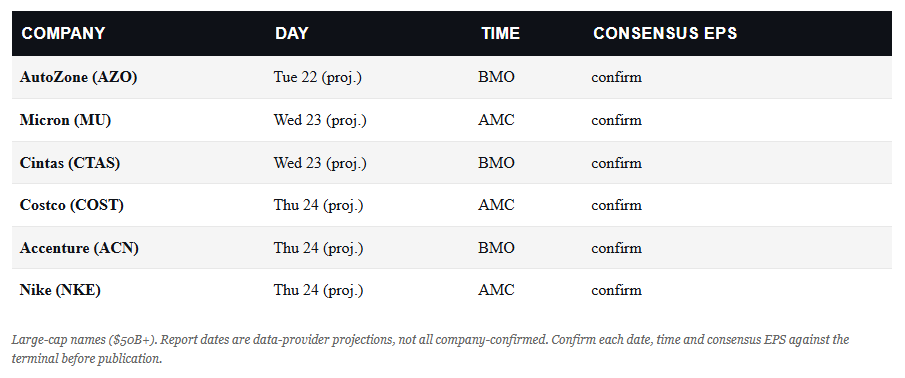
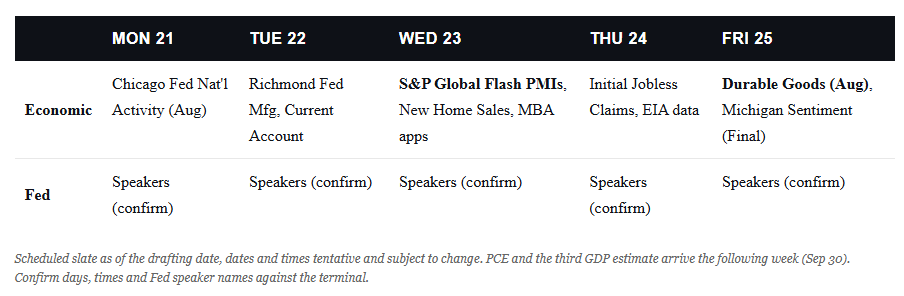
This week will largely lack relevant economic data and corporate earnings. Likely taking center stage will be a host of Fed speakers. We will be keyed on one of the more hawkish members, Beth Hammack, President of the Cleveland Fed.
Hammack has been one of the Fed’s most consistently hawkish voices in recent months. To wit, she dissented in favor of a hike at the July meeting specifically, arguing “inflation has remained stubbornly above 2 percent for more than five years” and that she’s “not confident it will return to our objective on its own.” She’s flagged supply-side pressure from energy prices and broadening demand-side pressures based on what she’s hearing from businesses in the Cleveland Fed district. Given that view, expect her speeches next week to reinforce her hawkish tone and possibly address whether Wednesday’s hike and another would be enough to satisfy her call to action. Her remarks are also worth watching for any direct comment on the Iran-driven oil spike, since she’s already on record treating energy costs as a real, not transitory, inflation risk.
K-Shaped Economy: Reality Or Media Driven Perception
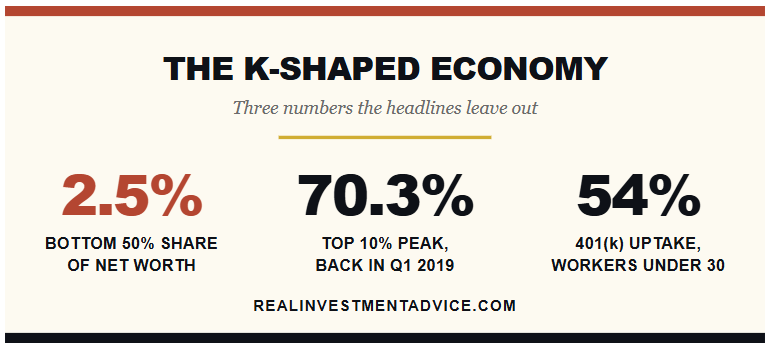
The bottom half of American households owns about 2.5% of the nation’s wealth. That number is real, and it ought to bother you. However, that number is also higher than it was in 2019 and 2015, and roughly six times higher than the 0.4% low it hit in 2011. You will not read that in many places because it doesn’t “fit the narrative.”
Unfortunately, the K-shaped economy headlines have settled into a single unvarying note, and after a while, people stop hearing anything else. I’ve spent the past several weeks working through the underlying data. While there is some truth to the coverage, most of the claims are exaggerated for “clicks and views.” But the psychological damage is clear.

Tweet of the Day
New UPDATED Trading Rules With Desktop Printout
“Want to achieve better long-term success in managing your portfolio? Here are our 15-trading rules for managing market risks.”
Please subscribe to the daily commentary to receive these updates every morning before the opening bell.
If you found this blog useful, please send it to someone else, share it on social media, or contact us to set up a meeting.